Data Wrangling Using Python
 Twinkle Charde
Table of content:
I. Introduction
III. what is data wrangling?
IV. Why data wrangling in data analysis?
V. How do we do it using Python functions?
Introduction:
Till now many people in their articles and videos might have conveyed you that why Python is preferred over any other languages for Data analysis. If you have gone through all the data present over internet then you will understand that Python is a cross-functional language which offers several benefits to its users. It provides heavy support and offers an extensive range of libraries for several tasks in the data analysis process.
Python is also known for its simple syntax and has high readability, which is a major benefit of it. It cuts down the time of data analysts otherwise spend on familiarizing themselves with a programming language. It has gentle learning curve and list of benefits goes on..
However in this article, we are gone focus mainly on one single part of data analysis which is Data Wrangling using Python, Why Data Wrangling in Data Analysis & How we do it using Python?
But before Why and How, we need to understand:
What is Data Wrangling?

In my previous article, you will understand that what is Data analysis. It is a process of making sense of data which includes its collection, pre-processing, transforming, modeling, and interpreting data to extract useful knowledge (patterns) from them, draw conclusion predict future trends, and guide decision making.
In this complete process of Data Analysis, Data wrangling stands at the initial stages. As you know, the value of insights obtained from data is mostly and majorly depends on the quality of data.
when we get a data from various resources, it is present in the raw form. Data wrangling is the process of transforming and structuring this raw data into desired format to improve its quality.
Now let us discuss,
Why Data wrangling in Data Analysis?
As I mentioned above, the value of insights obtained from data is mostly and majorly depends on the quality of data used in Data Analysis and Data Wrangling improves the quality of this data. It involves Data discovery, Data structuring, Data cleaning, Data enriching, Data validating and Data publishing.
These steps in Data wrangling, makes data easy to interpret by removing unwanted data and errors, increase the clarity of data and makes it easily understandable. Data Consistency increased by transforming it to uniform dataset. This Uniformity of data improves the Accuracy and Precision. All these points help to more effective Communication and Decision-Making to all the stakeholders which reduce time and make the process Cost Efficient.
How we do it using Python functions?
Now, let us jump into the most important part of this article.
By using below mentioned essential functions you can perform data wrangling i.e. you can convert a raw data in a structured data for efficient data analysis.
To describe data wrangling with example, in this article a dataset (obesity_dataset) has taken from Kaggle site.
To perform the data wrangling functions, first you need to import the NUMPY and PANDAS libraries in jupyter notebook as follows:

Then the following functions can be performed.
Function 1: pd.read_csv('location\file_name.file_type')
Once you imported the libraries now you can load dataset from your system to the Jupyter notebook using read.csv function of Pandas library.

If you can see in the above picture, the obesity_dataset was read using read.csv() function of pandas library. following is the elements used in the function.
df = pd.read_csv('location_of_dataset\name_of_dataset.file_type')
here, df is the variable name where dataset is assigned.
Function 2: df.shape
This function will provide the shape of dataset which means number of rows and columns present in it.

here, in obesity_dataset i.e. in df, 2111 rows are present with 17 columns
Function 3: df.info():
The next function is info() function which is used to get the detailed information about the data present in each column.
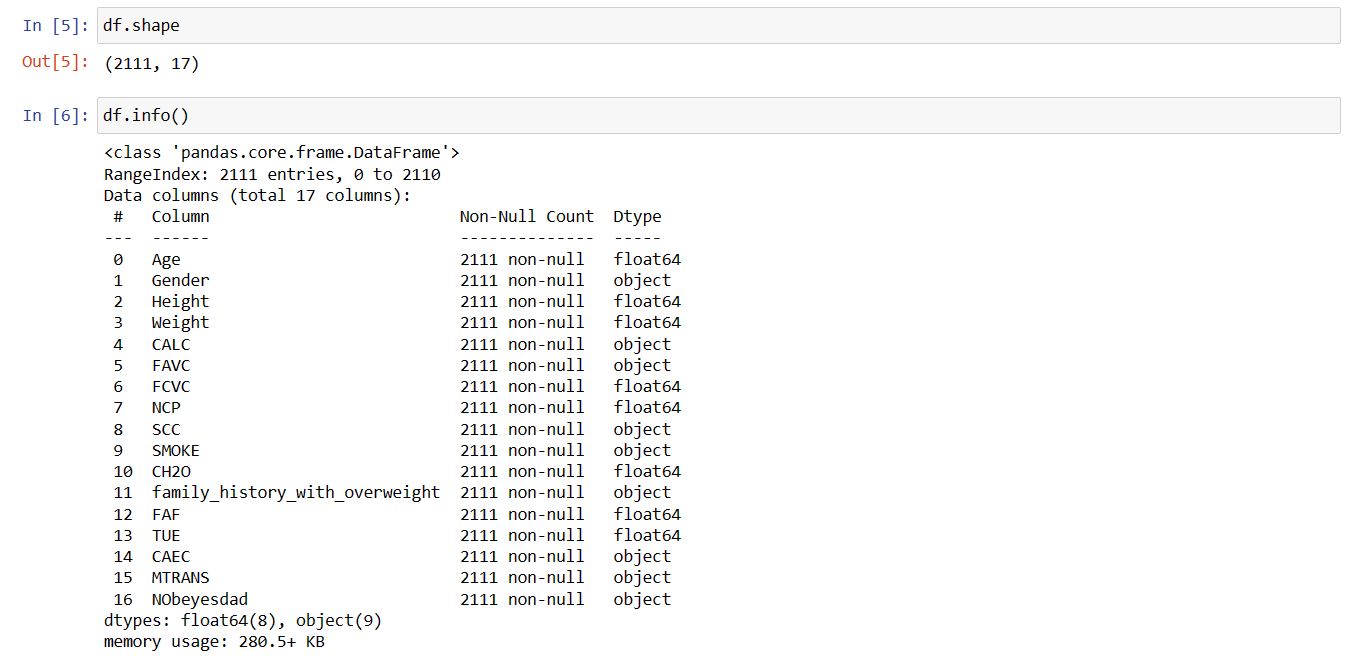
In the output of this function, you can see that the 17 columns are listed (indexing started from 0). It also display the number of non-null values present in the dataset with the datatype of the column and at the bottom memory used by the dataset is mentioned.
Function 4: head() & tail()
Till now we got the general information about the dataset however, if you want to take a look at how actually dataset looks then you can use the function head() and tail() to get the display of first 5 rows and last 5 rows respectively.
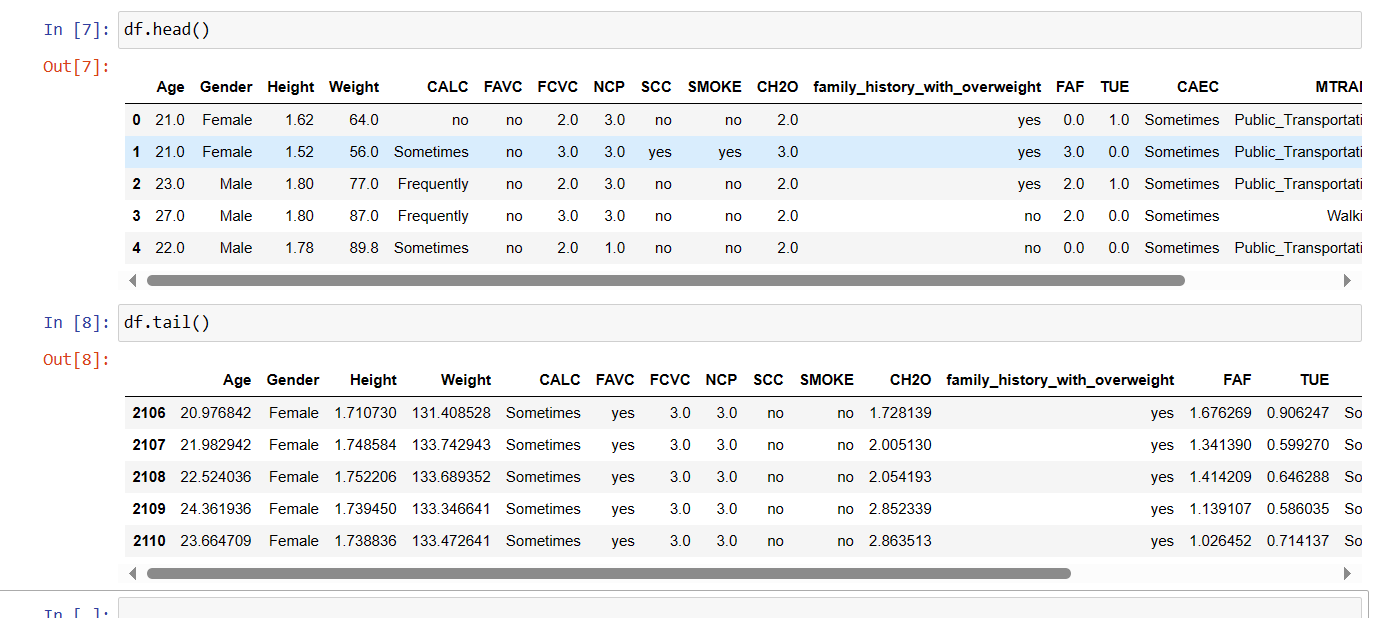
On each cell you can scroll to right to get complete view.
Function 5: describe()
The describe() function will help you to get the total count, mean, standard deviation, minimum value, 25% value, 50% value,75% value and maximum value of each column with numerical datatype.

Function 6: isnull()
The function isnull() will return true if any value present in the table is null else it will return false.
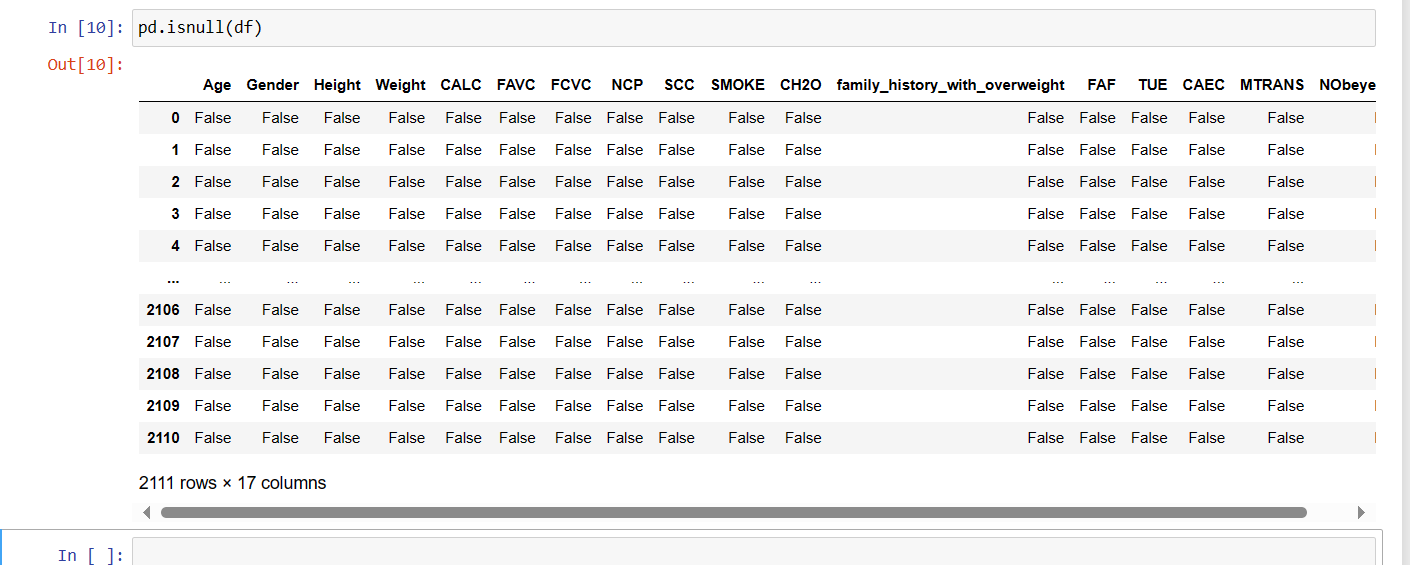
Function 7: isnull.sum()
This function will provide the number of null values present in the dataset. Since, in obesity_dataset no null values are present, it will return 0 values.

Function 8: drop()
After observing the dataset if you require to delete the column which has no significance to the information and unnecessary consuming the memory then you can drop those columns using drop() function.
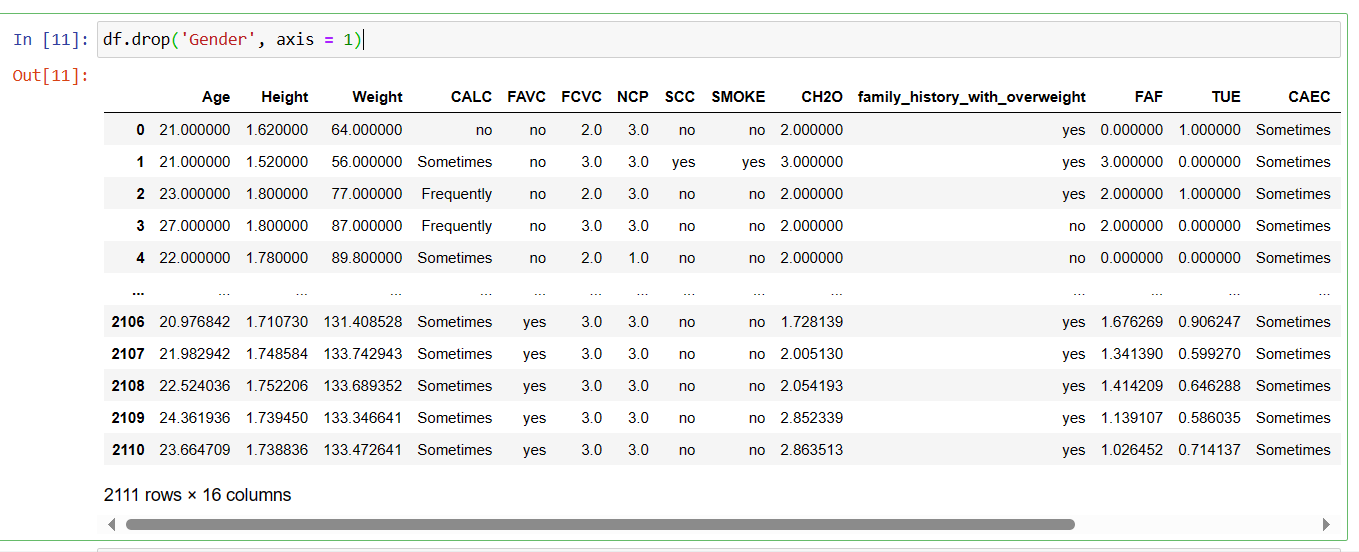
here, the column Gender present in second number in table is dropped.
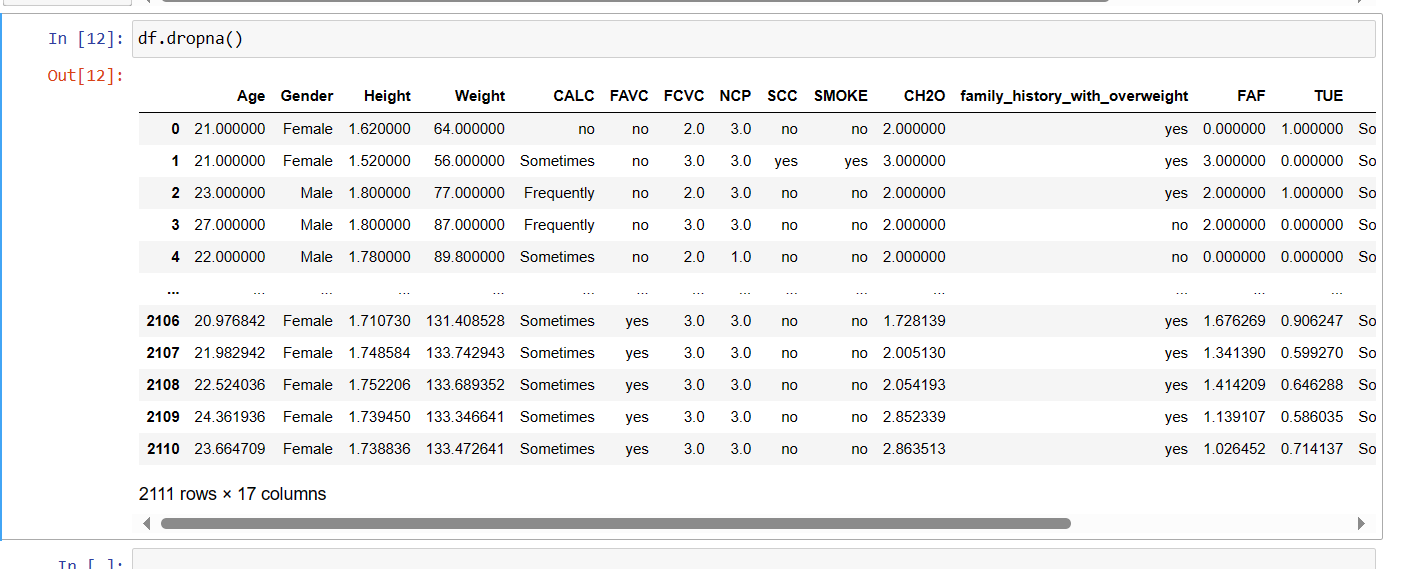
Function 9: dropna()
Using dropna() function you can drop the rows consist of null values in the table.
function 10: fillna()
Using fillna() function you can fill the missing values or null values with a specific value.
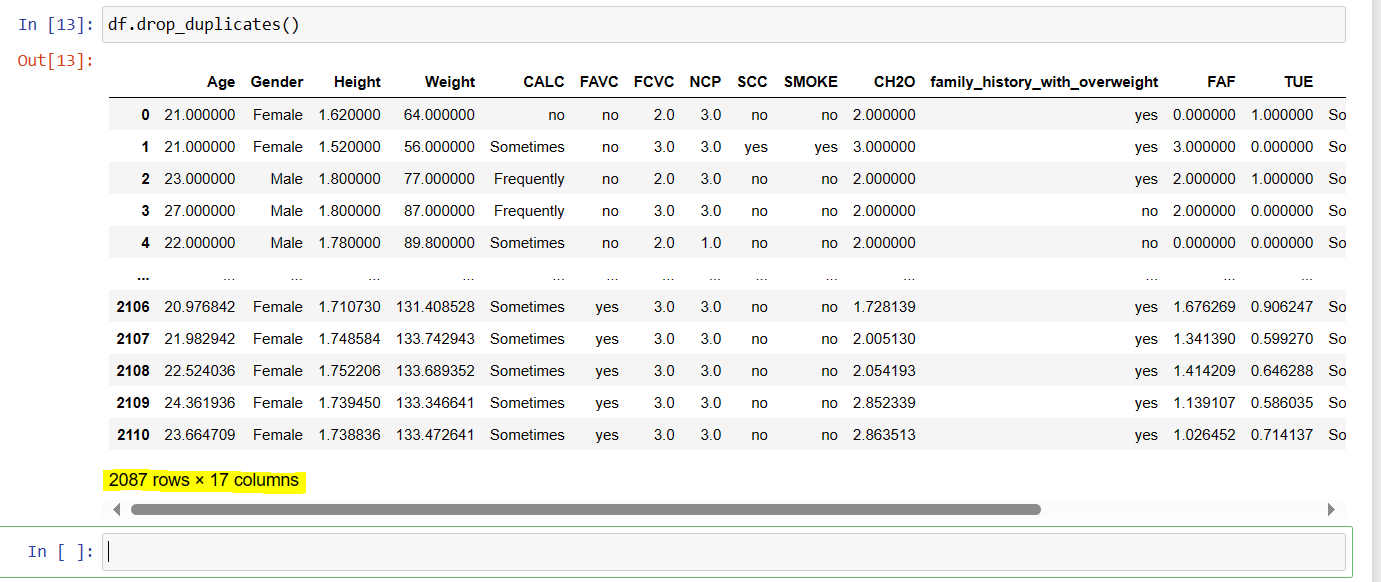
Function 11: drop_duplicates()
With the help of drop_duplicates() function you can drop the rows with duplicate values.
Function 12: column_name.replace ('old_value', 'new_value')
This function can be used to replace the existing value from the dataset to a specific new value.

In the above example, the term 'Male' and 'Female' is replaced with 'M' and 'F' respectively. This function will help you to structure the data as per your requirements.
Function 13: column_name.str.replace('old_value', 'new_value')
This function helps to replace any specific existing substring of a string from column with string datatype to a new specific value.

In the above example, the substring 'Public' of the string 'Public_transportation' was replaced to 'common' in the column 'MTRANS'.
Here we can use a element 'case' to make the changes case-insensitive.
Previously, the substring was mentioned as 'Public' however even when it was mentioned in lower case in the function it was replaced with new substring 'common' as the element 'case = False' was mentioned as you can see in below example.

Function 14 : dataset.rename (columns = {'old_name' : 'new_name'})
The function rename() is used to rename the exiting name of column with new column name. In the below example, the column is renamed using dictionary.

Function 15: Creating new column.
Here new column 'BMI' has created simply passing the name of new column in a function. The values in the new column is defined by arithmetic operations of existing column. The column is created at the end of table.

Above, you have got an introduction of commonly used functions for data wrangling. In the upcoming articles we will explore more data wrangling functions.
/
Subscribe to my newsletter
Read articles from Twinkle Charde directly inside your inbox. Subscribe to the newsletter, and don't miss out.
Written by

Twinkle Charde
Twinkle Charde
Hello, I am a healthcare professional with deep passion to explore the world of data, healthcare & pharma-drugs. I am curious about data and its methods which helps our world to understand the science of health and progress ahead in our journey to create better future for our society. This encouraged me to learn and understand the basic tools -programming language like python, Tablue for data visualization and SQL which My hobbies are reading, writing and spending time with nature brought me here on this platform to share with you all my knowledge, understanding about the world of data.