Day 74 : Connecting EC2 with Grafana .
 Prathmesh Vibhute
In the dynamic world of cloud computing, monitoring server health and performance is crucial. Grafana, an open-source analytics and monitoring platform, is a popular tool for visualizing metrics. In this blog post, we'll walk through connecting both a Linux and a Windows EC2 instance to Grafana to monitor various server components.
Task:
Connect an Linux and one Windows EC2 instance with Grafana and monitor the different components of the server.
Install Docker:
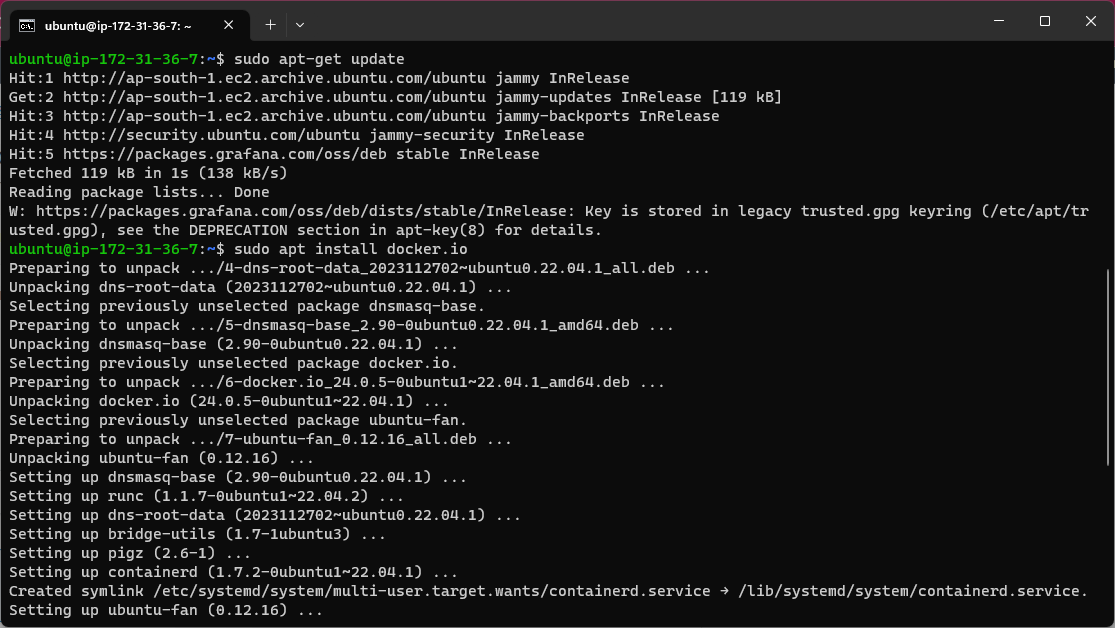
Updates the package lists on the system, ensuring that the latest package information is available for installation.
 sudo apt-get update
 sudo apt install docker.io
 sudo usermod -aG docker $USER
 sudo reboot
Download Loki Config:
Use the following command to download the Loki configuration file:
mkdir grafana_configs
cd grafana_configs
wget https://raw.githubusercontent.com/grafana/loki/v2.8.0/cmd/loki/loki-local-config.yaml -O loki-config.yaml
This command uses wget to download the Loki configuration file from the specified URL.
The configuration file contains settings for Loki, such as storage configurations, retention policies, and remote storage options.

Download Promtail Config
Download the Promtail configuration file using the command below in grafana_configs directory:
wget https://raw.githubusercontent.com/grafana/loki/v2.8.0/clients/cmd/promtail/promtail-docker-config.yaml -O promtail-config.yaml

Run Loki Docker container:
Execute the following command to run the Loki Docker container, providing the downloaded configuration file:
sudo docker run -d --name loki -v $(pwd):/mnt/config -p 3100:3100 grafana/loki:2.8.0 --config.file=/mnt/config/loki-config.yaml


Edit the inbound rule in the security group of the ec2 instance to allow port 3100.

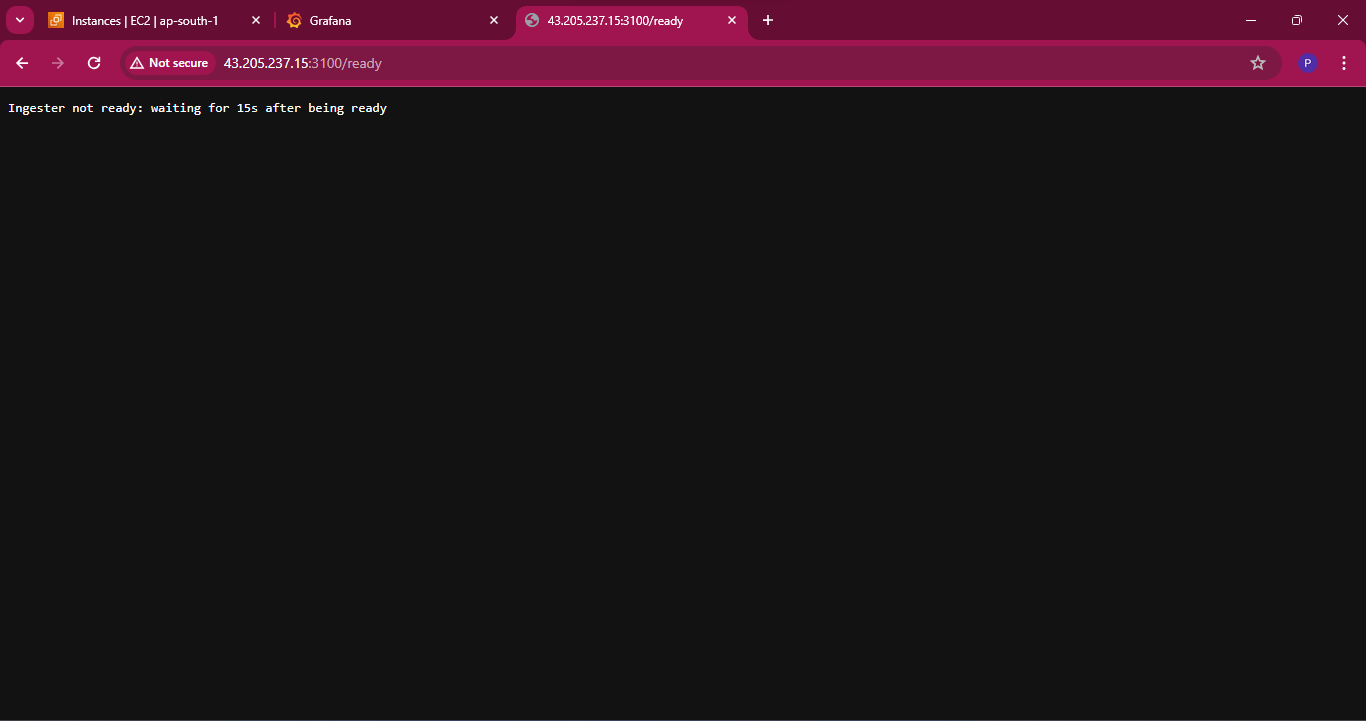
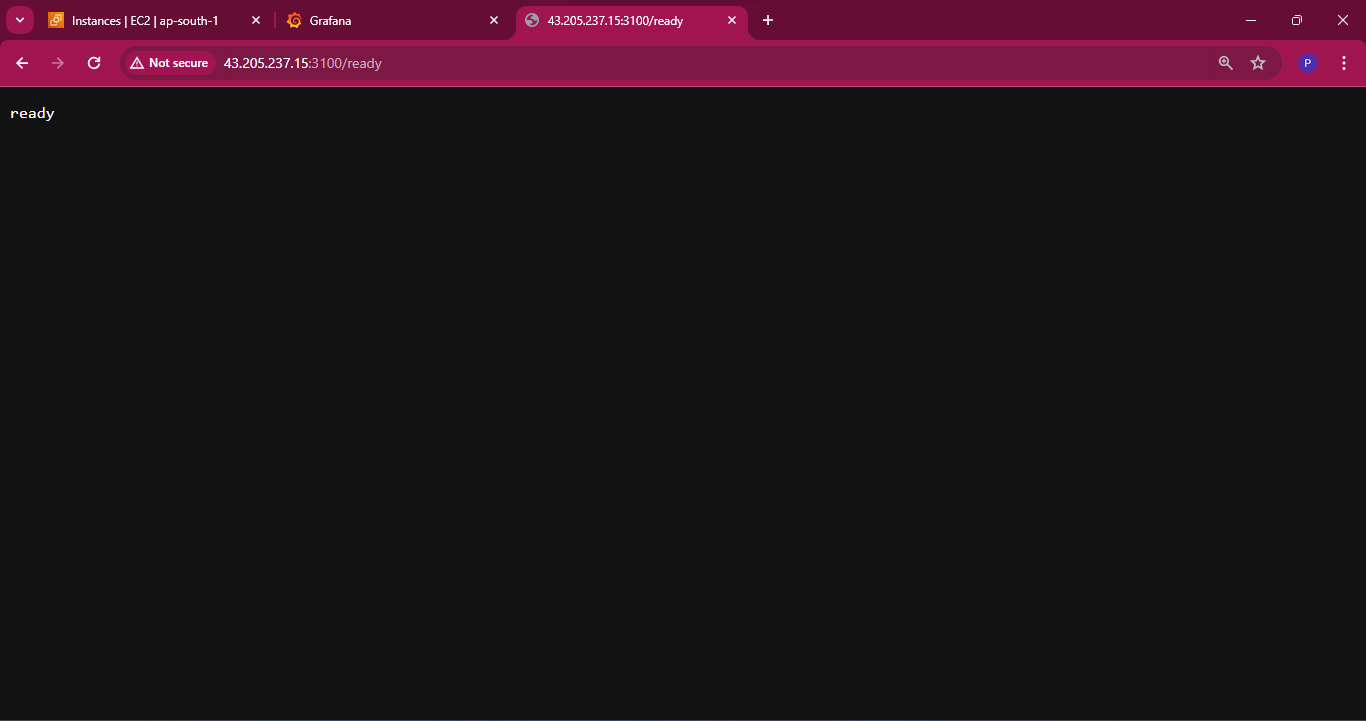
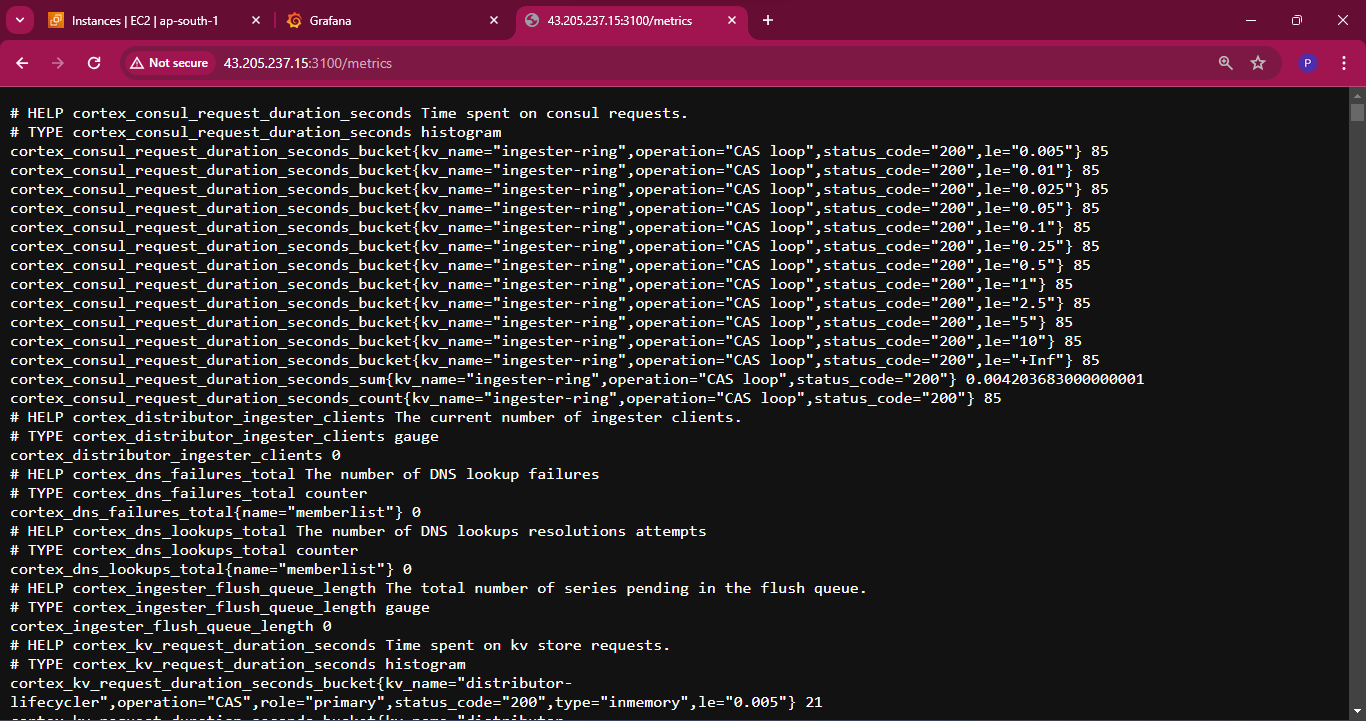
Copy public-ip of instance and paste in browser on https:<public-ip>:3100/ready and check loki is ready..?
In Loki what kind of logs or metrics are there we can get those like this use /metrics
Run Promtail Docker container:
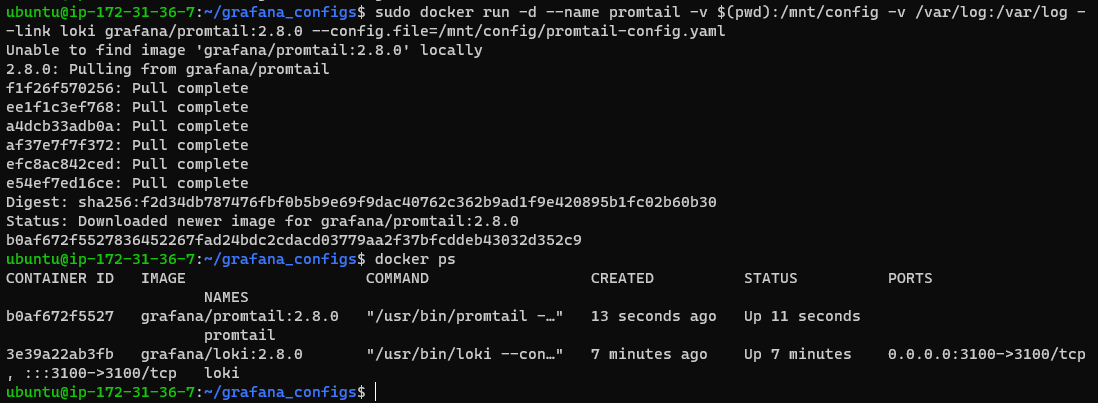
Run the Promtail Docker container with the downloaded configuration file, mounting the host’s log directory:
sudo docker run -d --name promtail -v $(pwd):/mnt/config -v /var/log:/var/log --link loki grafana/promtail:2.8.0 --config.file=/mnt/config/promtail-config.yaml
Add Data source in Grafana
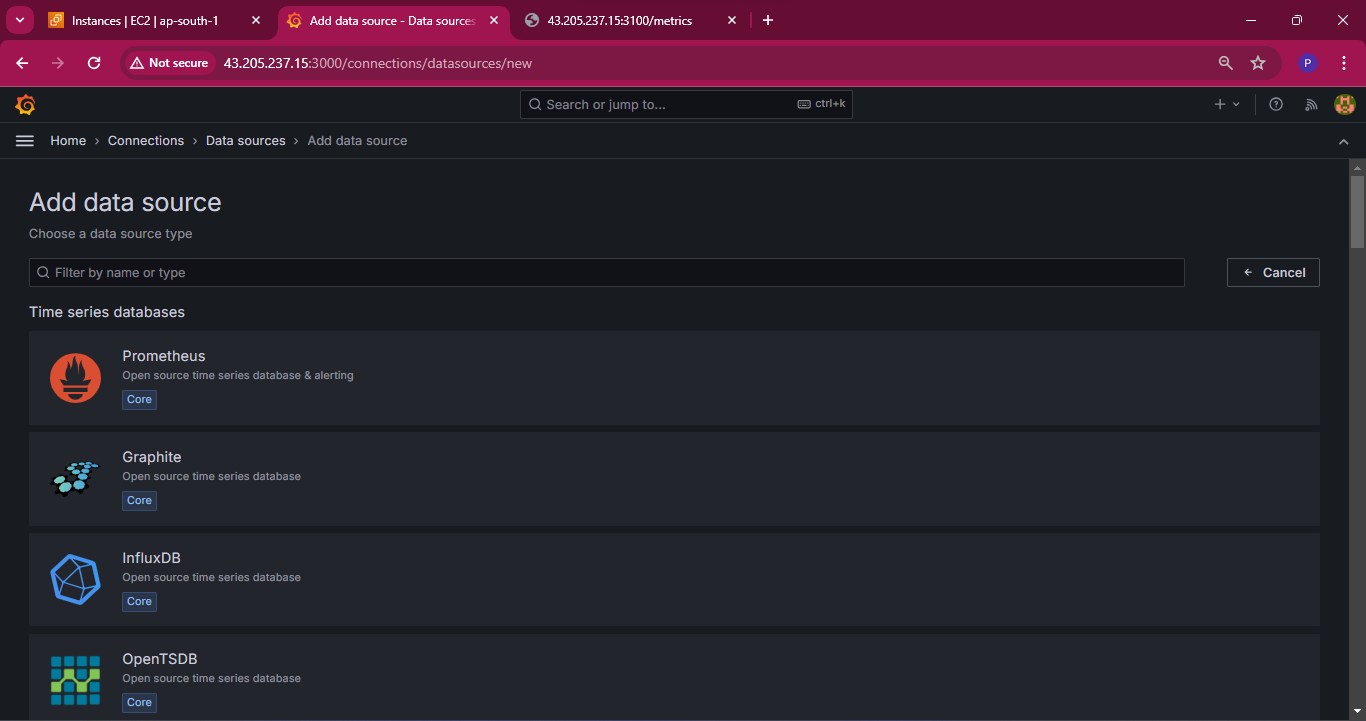
Now, navigate to the Grafana web app and on the homepage choose the add data source option.
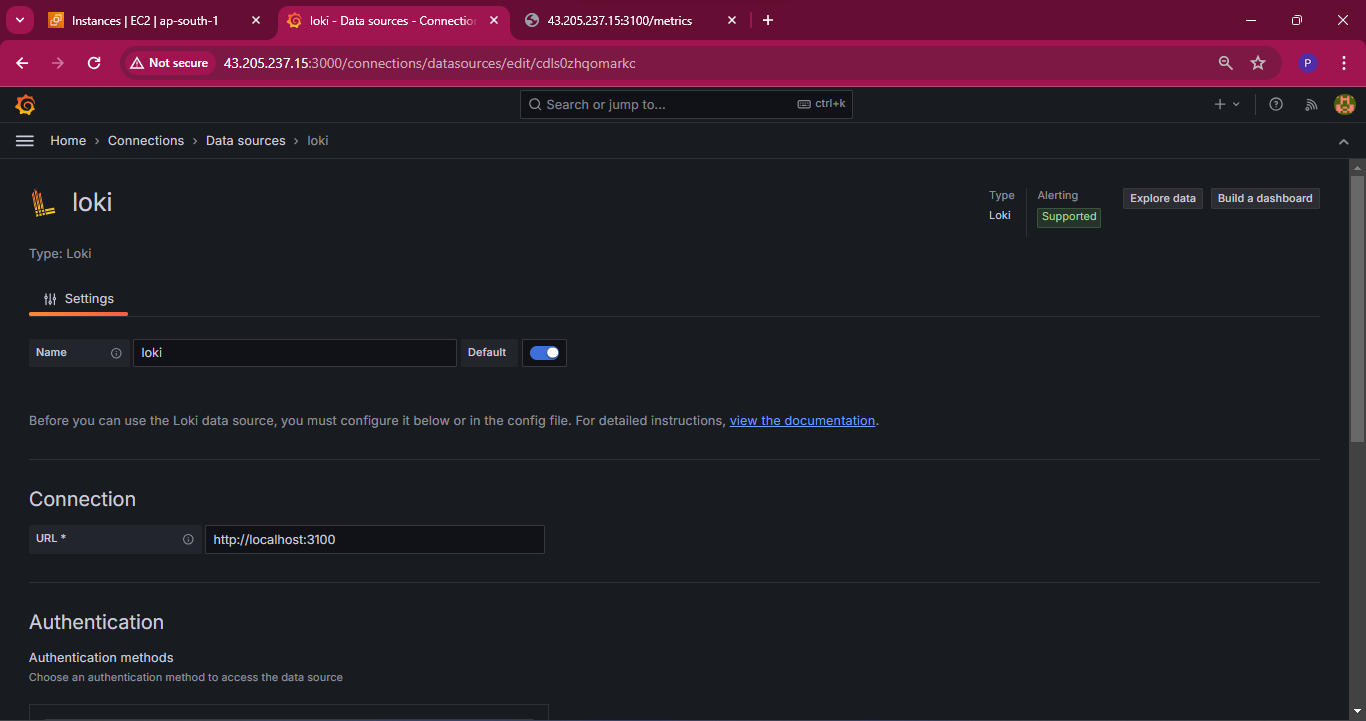
Provide the HTTP URL as below to connect the loki data source to Grafana so that loki will send the logs to grafana.
localhost:3100
Click on save & test to connect the data source.

Checking logs in Loki:
Click on explore in the below screenshot after adding the data source.
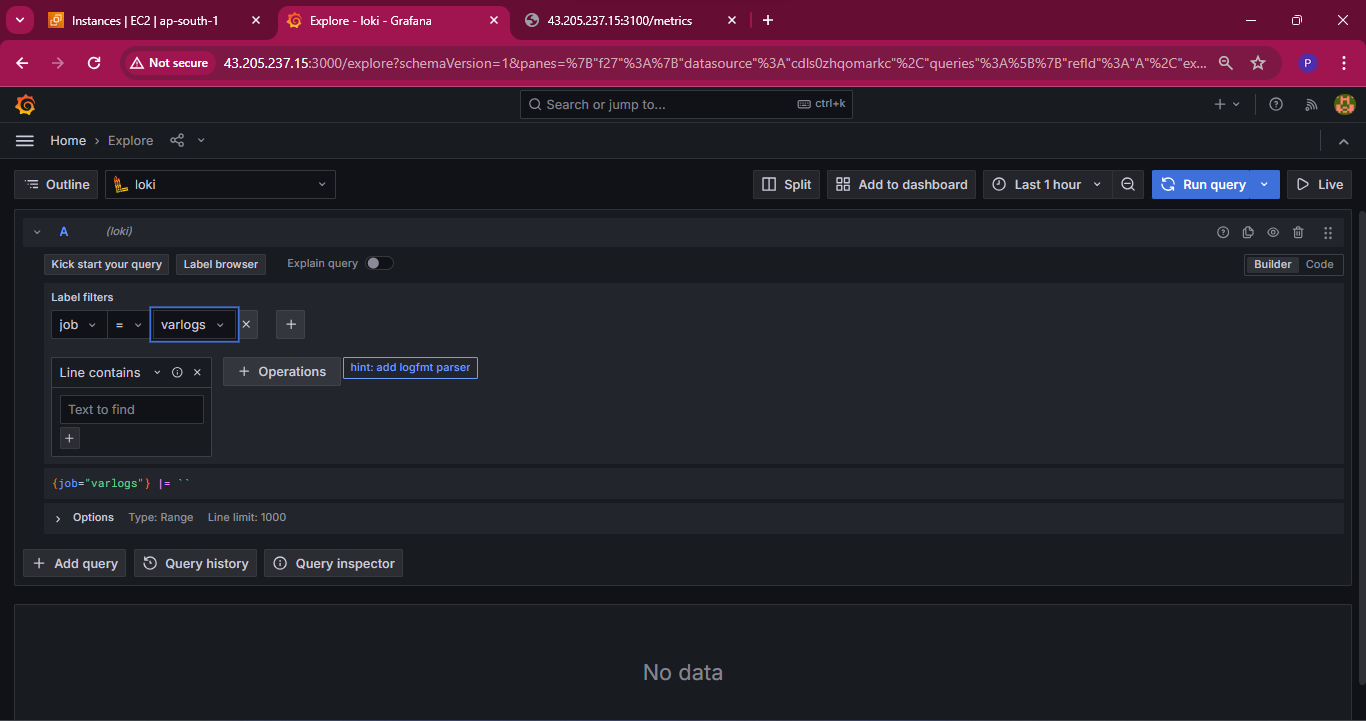
Run Query will display below output
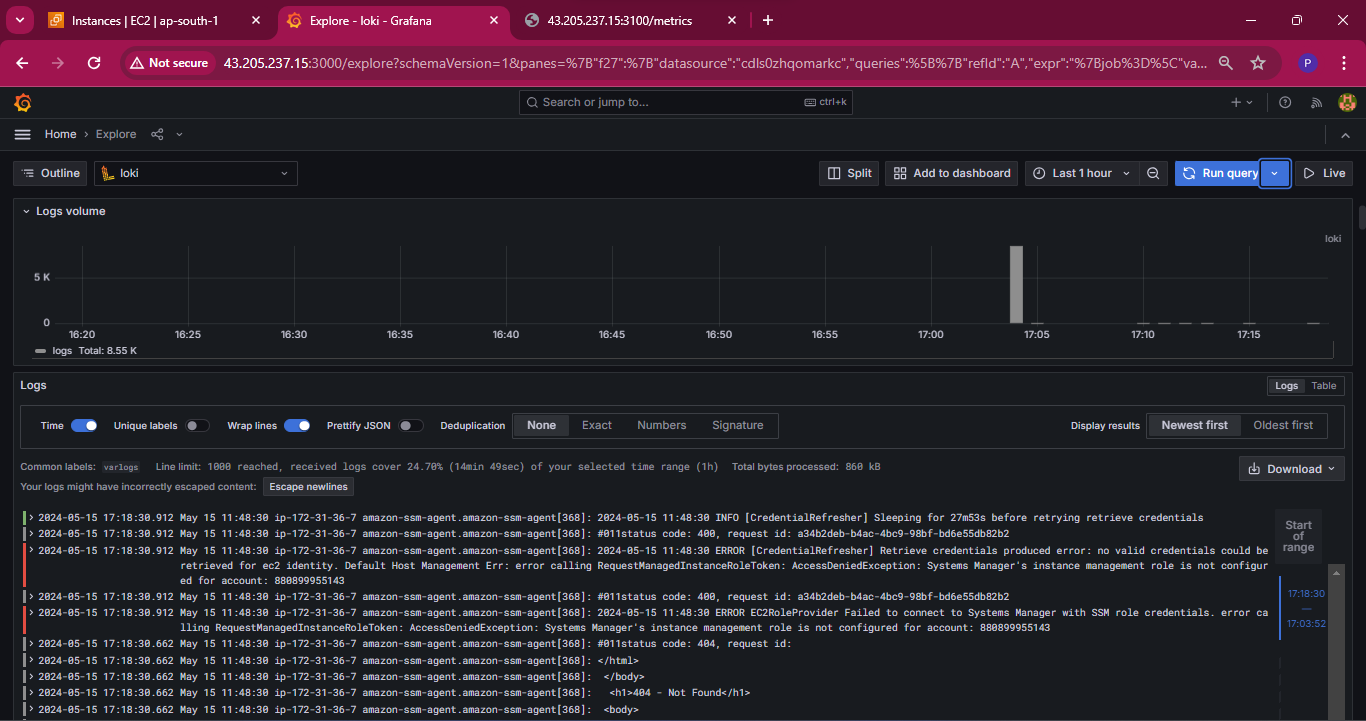
Create Dashboard:
Let’s add the log to the dashboard by choosing the option from the above screenshot location.
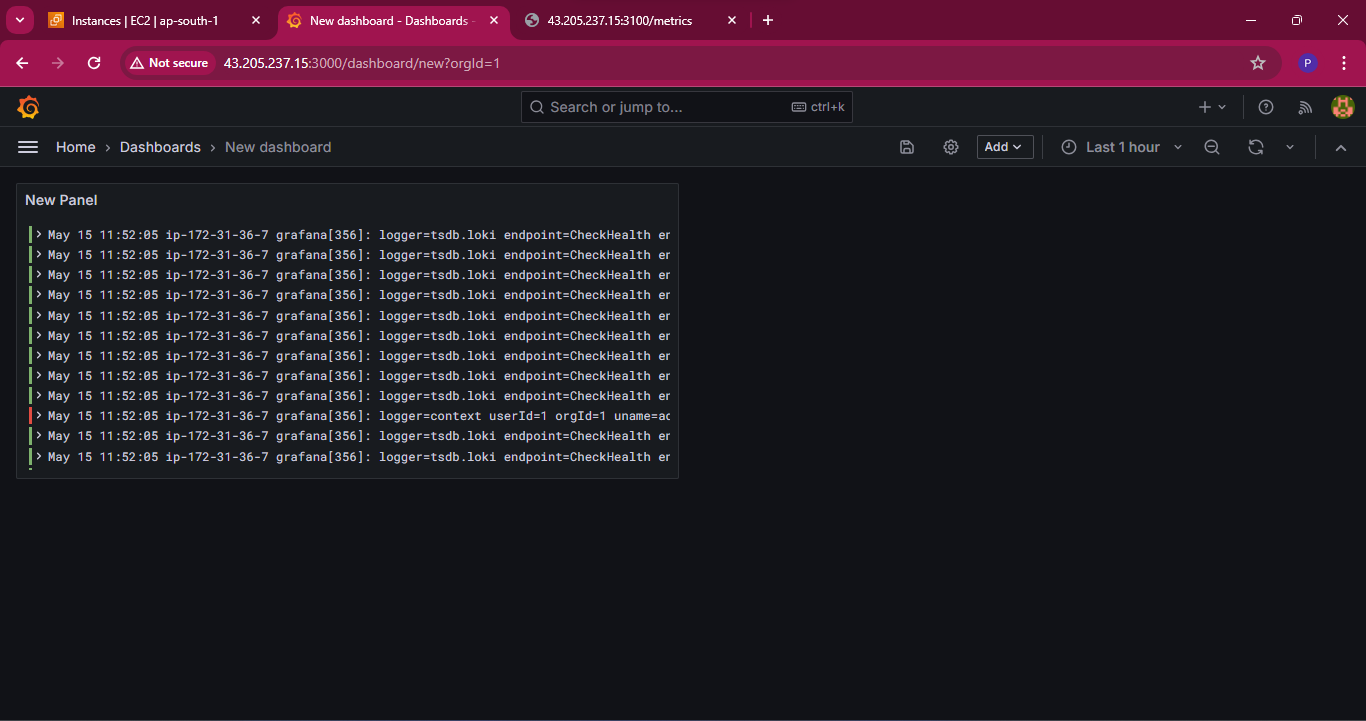
Now the system logs are added to the grafana dashboard. Let’s add some more by clicking on visualization to add some graphs as shown below screenshot.
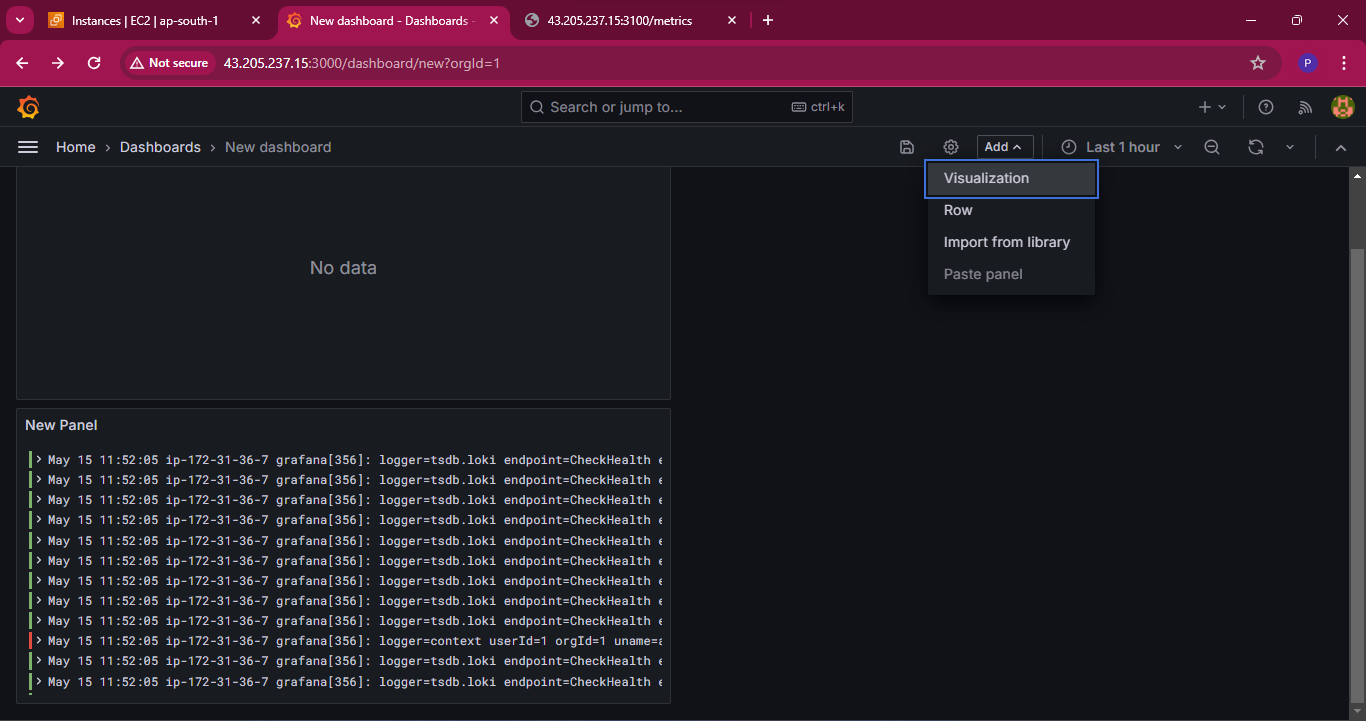
In Label filters choose job and varlogs and line contains to error to show all the lines with error and select the duration to show all the lines with error in the logs.
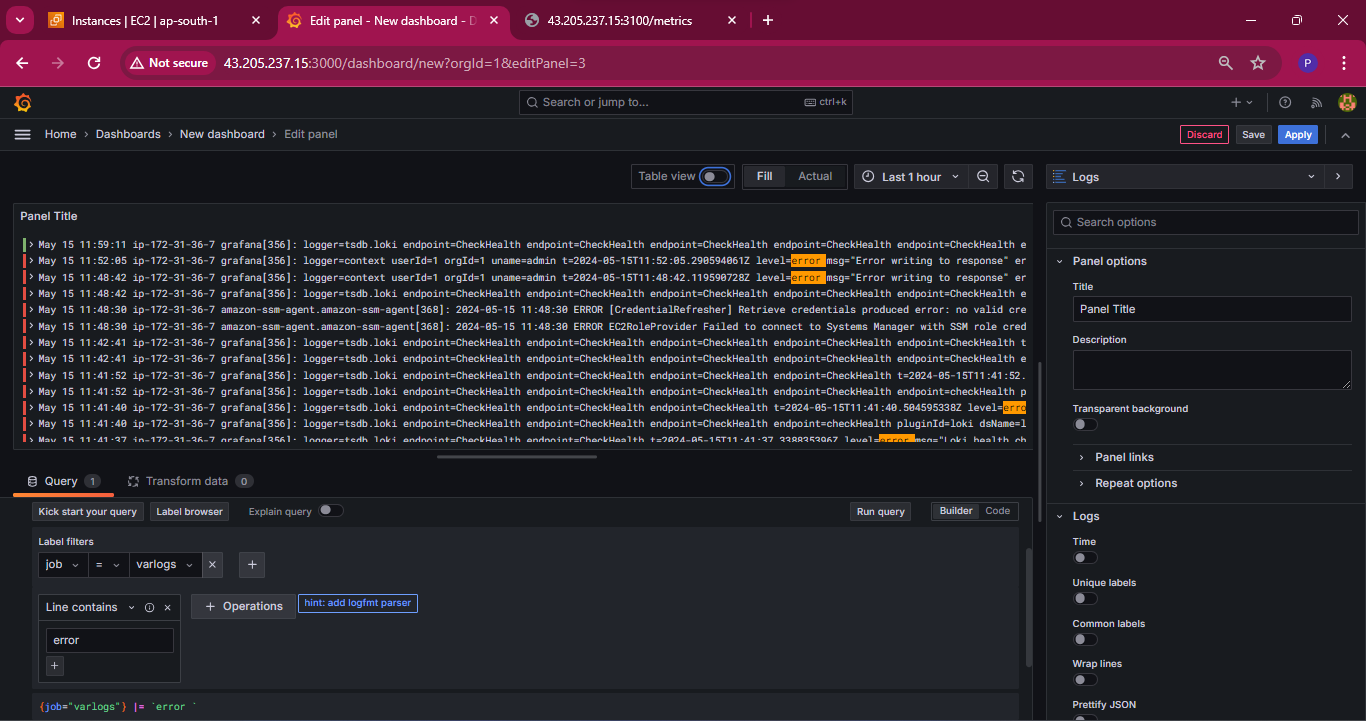
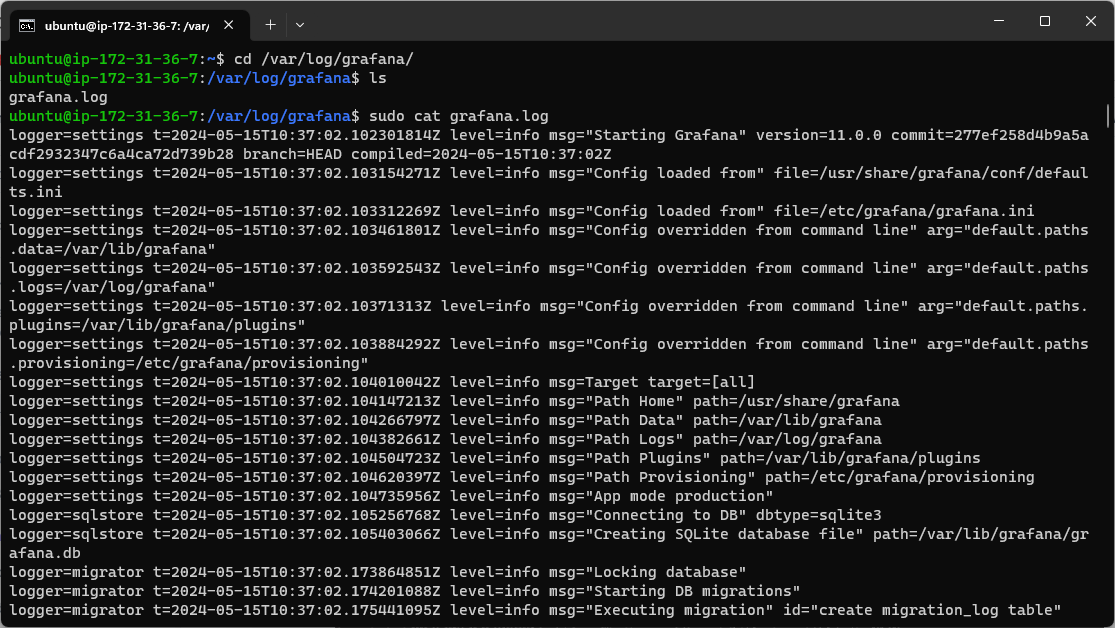
let’s check the error lines in grafana log that is placed in /var/log/grafana/grafana.log
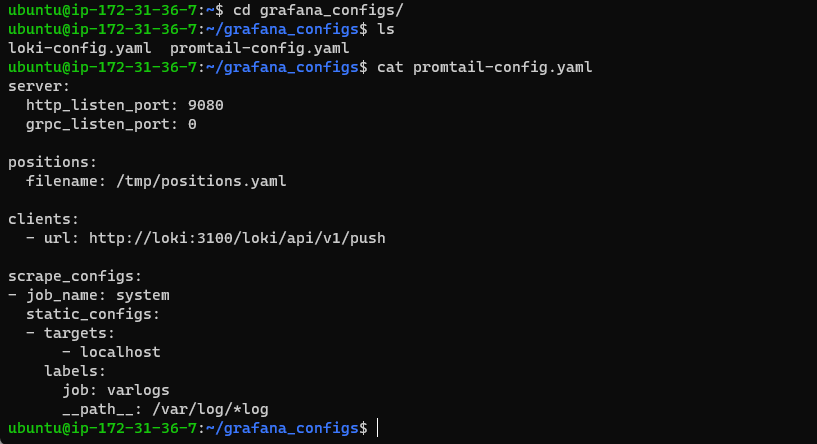
To display the Grafana log, we must specify the Grafana log path in the promtail config YAML file within the target section, as illustrated below.
After editing promtail_config.yaml file we have to restart our promtail docker container

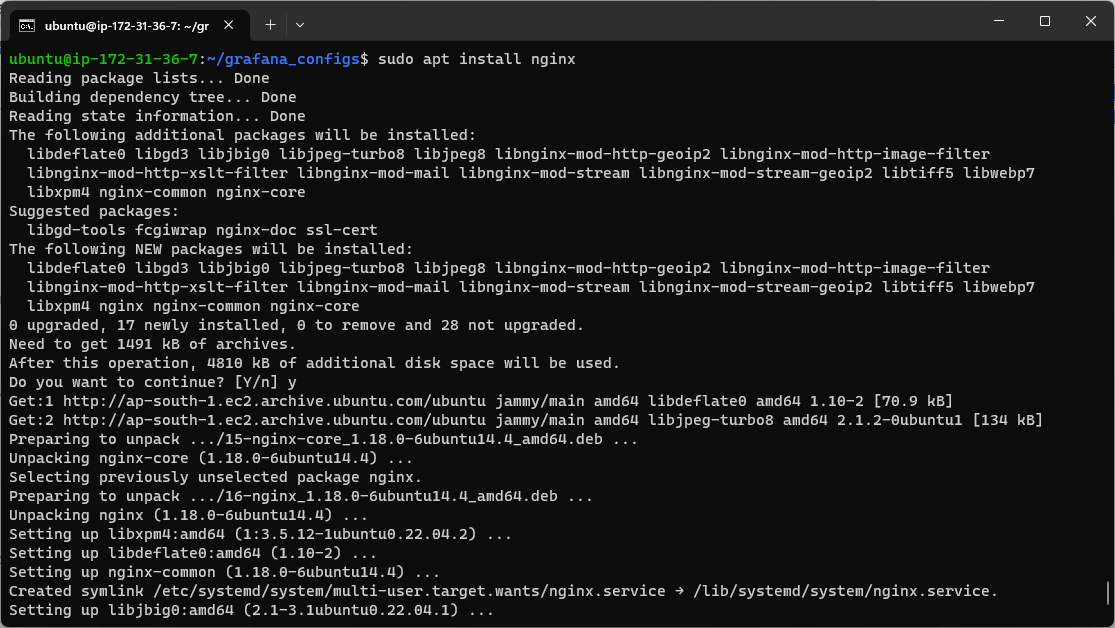
Use the proper label filters to show an aggregate sum of words repeating nginx while installing. This can be achieved by setting the varlogs as label filters.


Conclusion
By integrating EC2 instances with Grafana via Prometheus, you create a powerful monitoring solution that provides insights into your infrastructure's performance and health. This setup helps in proactive management and swift troubleshooting, ensuring your applications run smoothly.
Feel free to customize dashboards and alerts in Grafana to suit your specific needs. Happy monitoring!
I'm confident that this article will prove to be valuable, helping you discover new insights and learn something enriching .
thank you : )
Subscribe to my newsletter
Read articles from Prathmesh Vibhute directly inside your inbox. Subscribe to the newsletter, and don't miss out.
Written by
