Create a CloudWatch Monitoring Dashboard and Alarm that Monitors CPU Utilization in AWS
 Ruchika Patel
This hands-on exercise is a step-by-step guide for creating an EC2 instance and a CloudWatch monitoring dashboard in AWS.
Pre-requisite
• An active AWS account with an EC2 instance running.
• The EC2 instance should be launched in the same region as the CloudWatch dashboard to avoid any latency issues, which in this lab is us-east-1 N.Virginia.
What is Amazon CloudWatch?
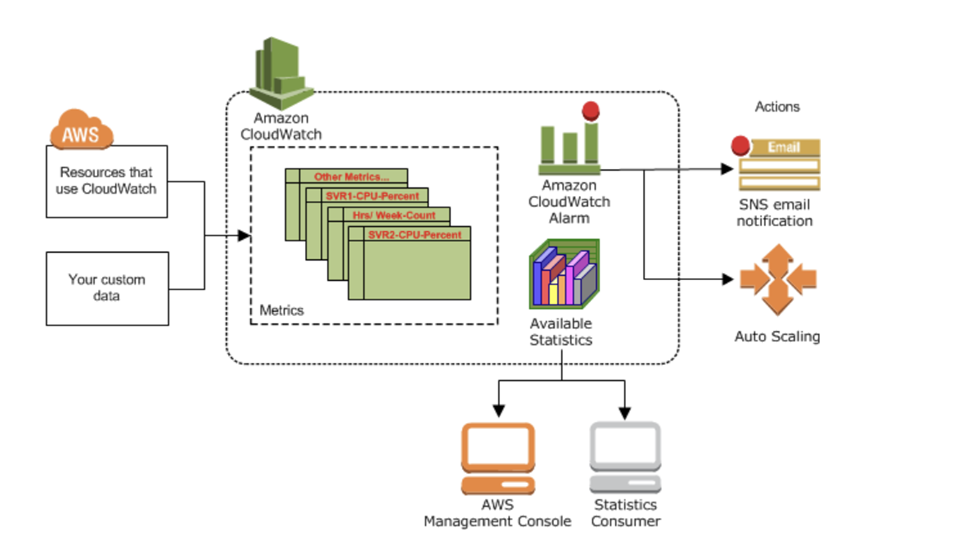
https://docs.aws.amazon.com/AmazonCloudWatch/latest/monitoring/cloudwatch_architecture.html
Amazon CloudWatch is a monitoring service offered by Amazon, which help to monitor AWS resources and client’s application that runs on AWS. It allows users to collect and track metrics, monitor log files, set alarms and react to changes in their AWS resources.
For Example: you can use CloudWatch to monitor the performance of an EC2 Instance, track CPU utilization and set up an alarm to trigger SNS when CPU usage exceeds to 70% for five consecutive minutes.
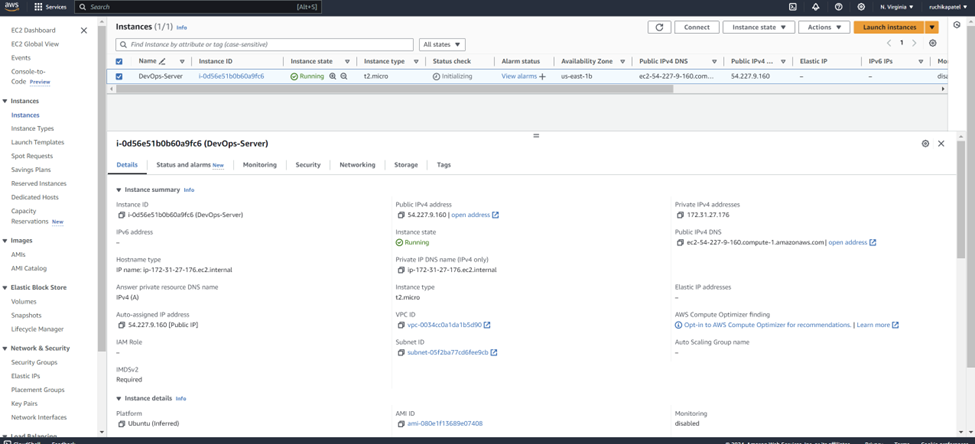
Step 1: Create EC2 Instance
· Select t2.micro type of Instance
· AMI: Ubuntu
· Server name: DevOps-Server
· Create a key pair
Rest of the setting is default
Step 2: Create the CloudWatch Dashboard by logging into the AWS Management Console and navigating to the CloudWatch service to create a new dashboard which will be used to add a widget to display the CPU utilization metric for the EC2 instance.
1. Create a CloudWatch Dashboard
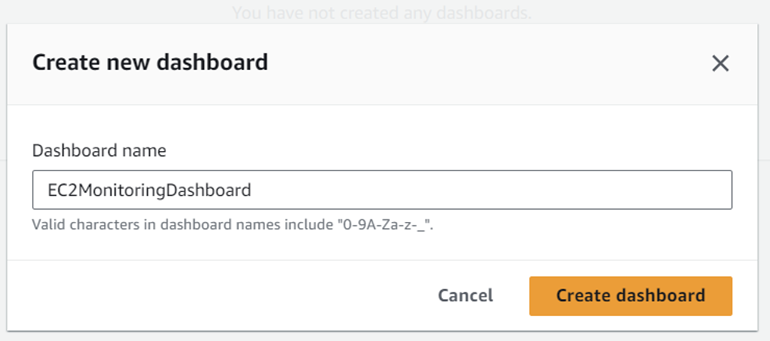
· In the left-hand menu, click on Dashboards and then click on the Create Dashboard button.

· In the Create Dashboard wizard, enter a name for the dashboard EC2MonitoringDashboard and click on Create dashboard.
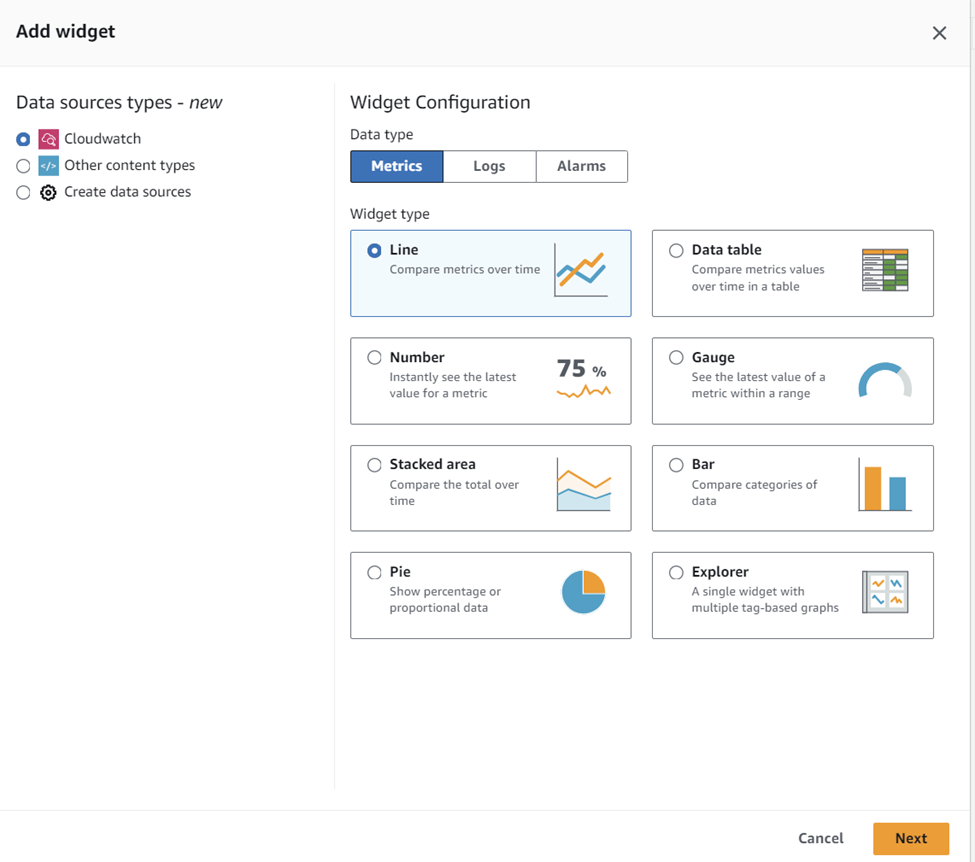
· In the “Add Widget” wizard, select “Line” as the widget type
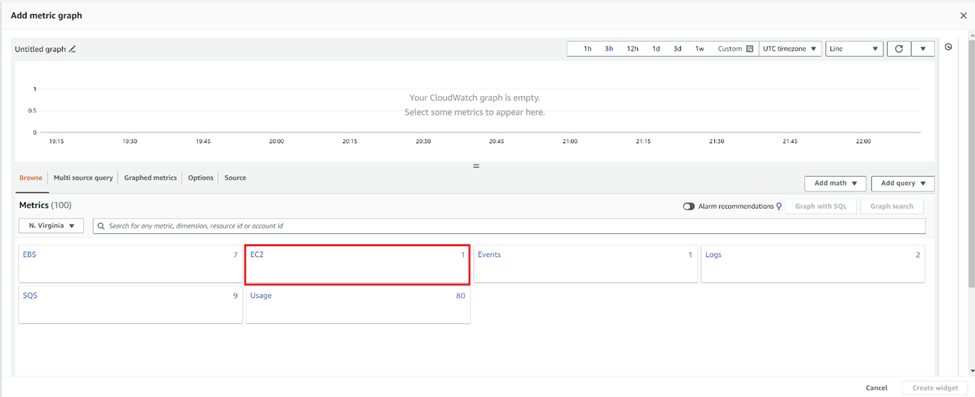
· choose “EC2” as the metrics namespace.
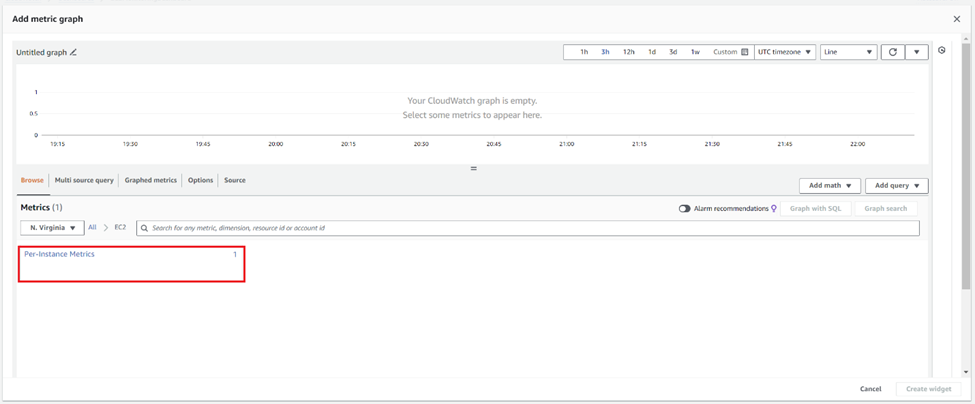
· Choose “Per-Instance metrics”
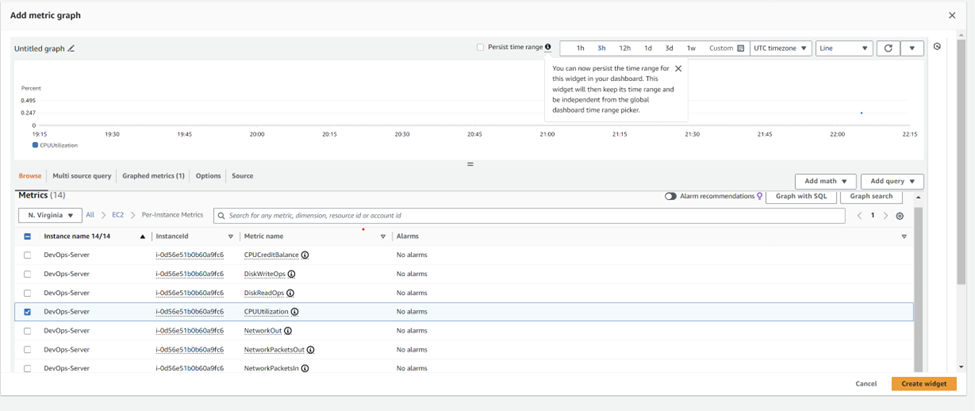
· Select “DevOps-Server” then click “Create widget”\
2. Create CloudWatch Alarm
· Expand “Alarms” Click on “in Alarms” then click Create alarm

· Under Specify metric and conditions and Metric, click “Select metric” under Graph

· Select “EC2”
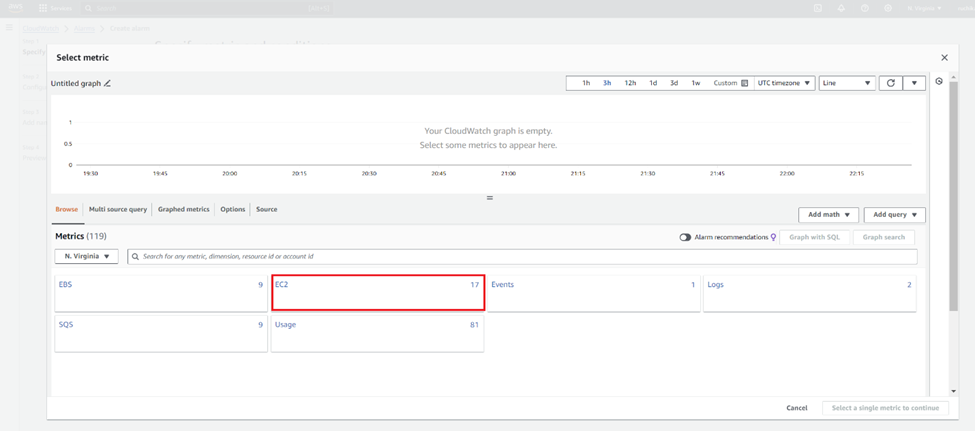
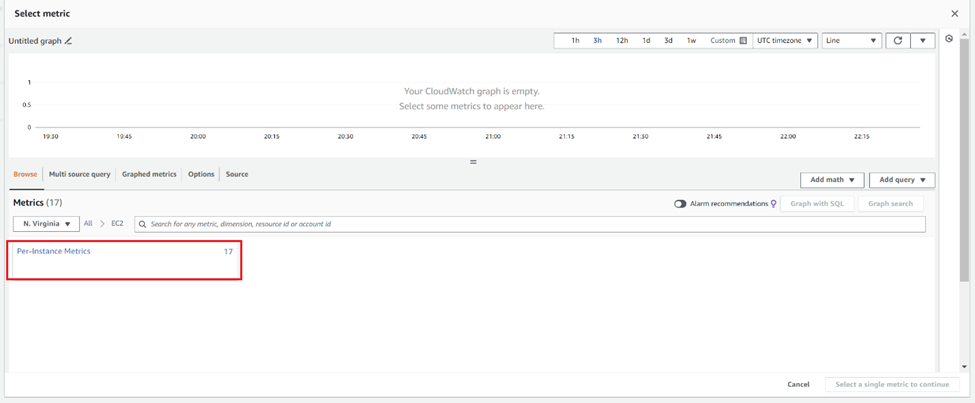
- Under Metric, select “Per-Instance Metrics”
· Select “DevOps-Server” (CPUUtilization) then click Select metric
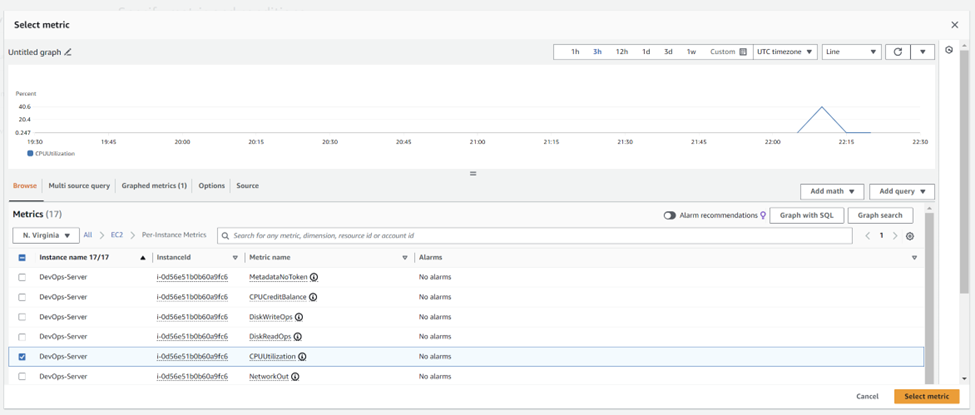
Under Metric, select “Period” as 300 seconds. Leave all other settings in their default state. Click on the Create Widget button to add the widget to the dashboard.
Under Conditions, choose threshold type “Static” and set the threshold value here, that is alarm will trigger if CPUUtilization > 50 and then click on Next.
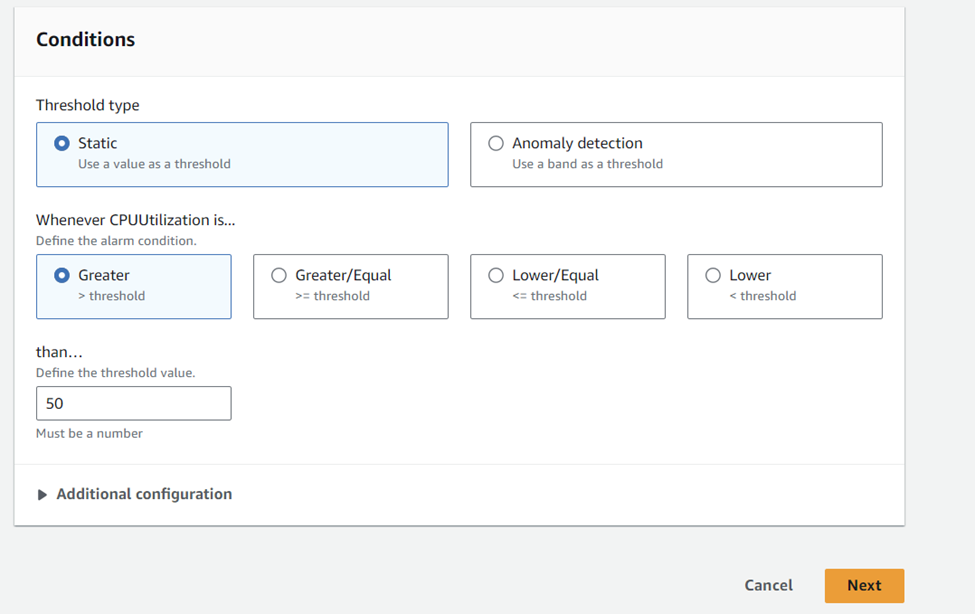
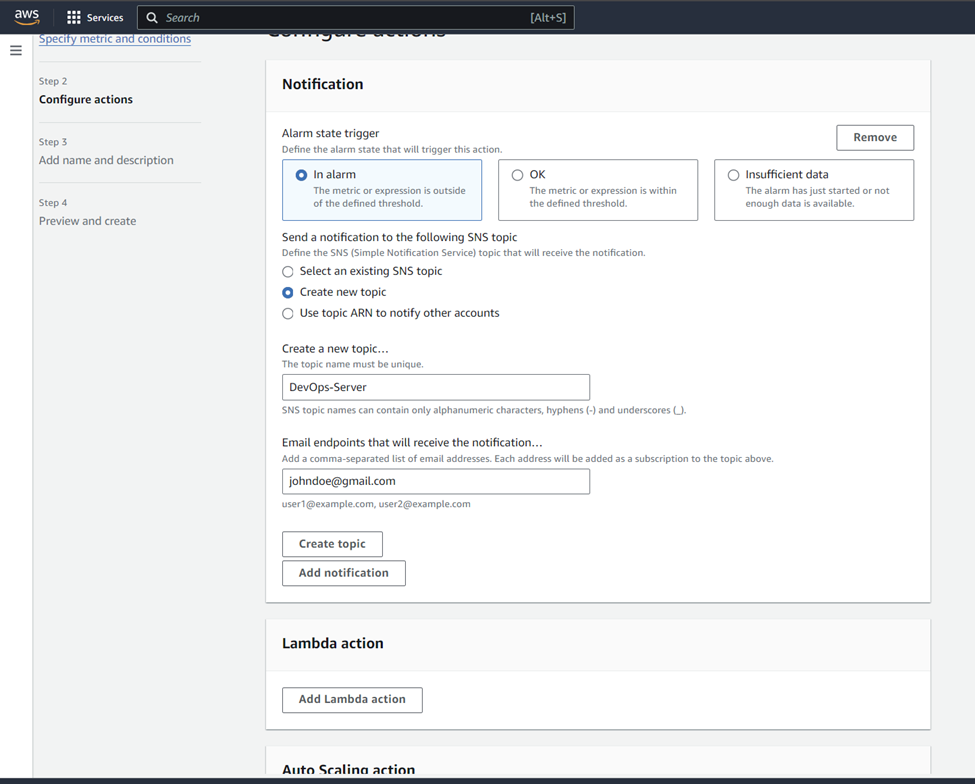
· Under Configure actions, select Alarm state as In alarm, then select a new SNS topic and give email endpoint on which you would like to receive a notification and click on “Create topic”.
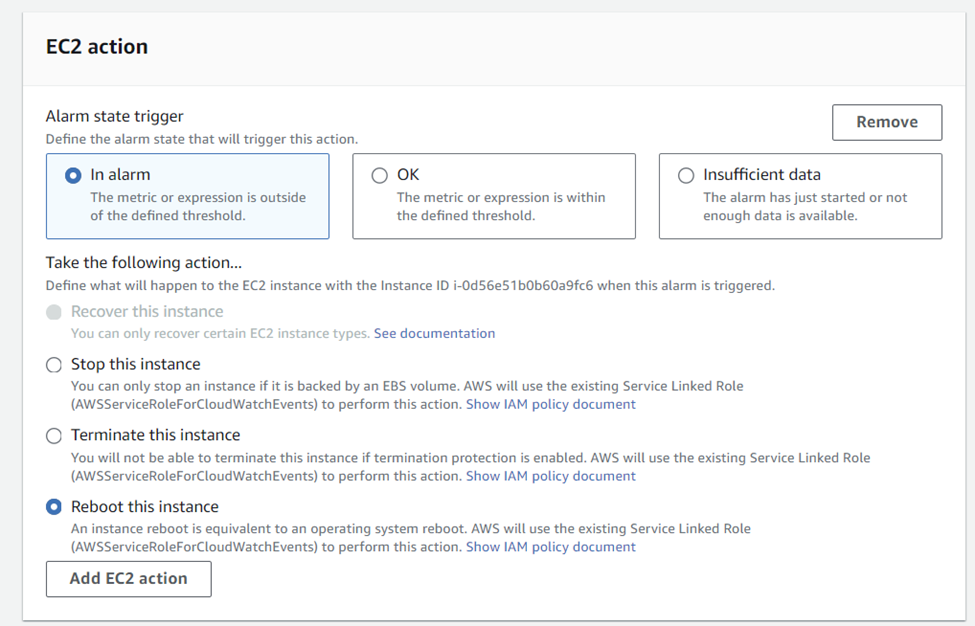
- Click on “Add EC2 action” and select the necessary action that need to be performed in case the alarm triggers. Here we are rebooting our DevOps-servers when alarm will trigger. And then you can click “Next”.
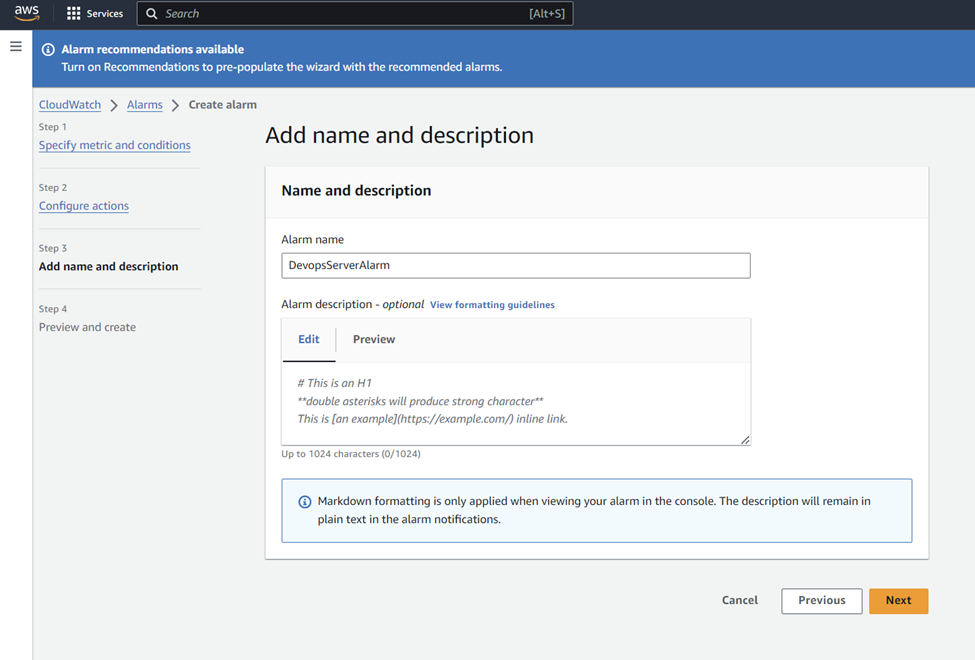
· Give name to alarm and click next
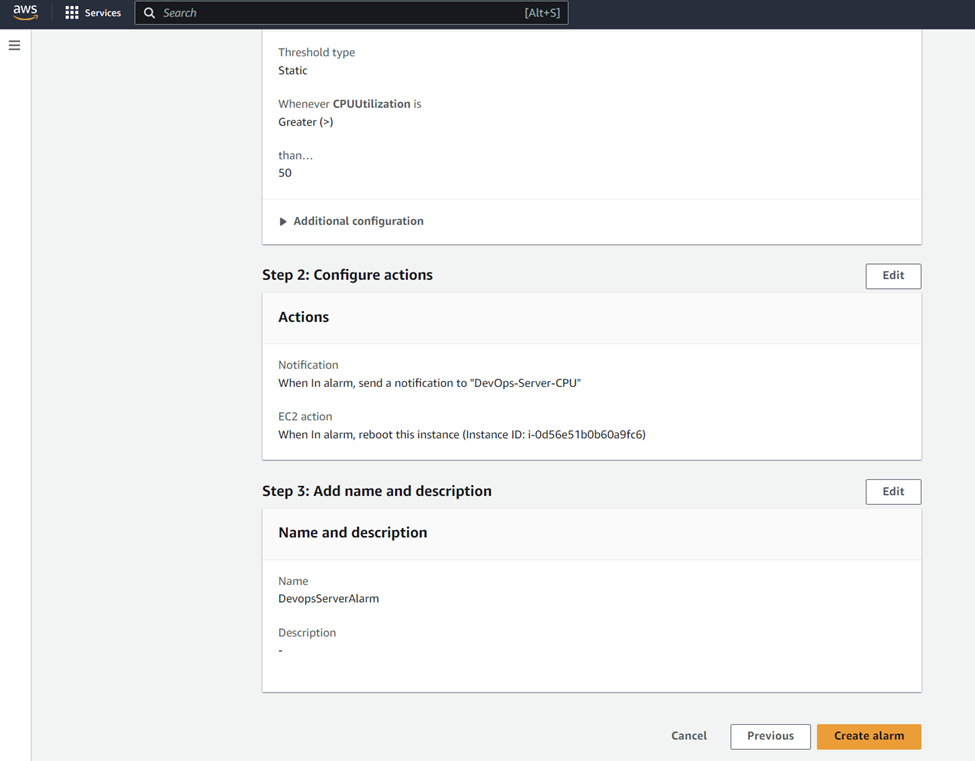
· At “preview and create” after scrolling down Click “Create Alarm”
- Watch the message “Successfully created alarm DevopsServerAlarm.” Then click “View alarm”

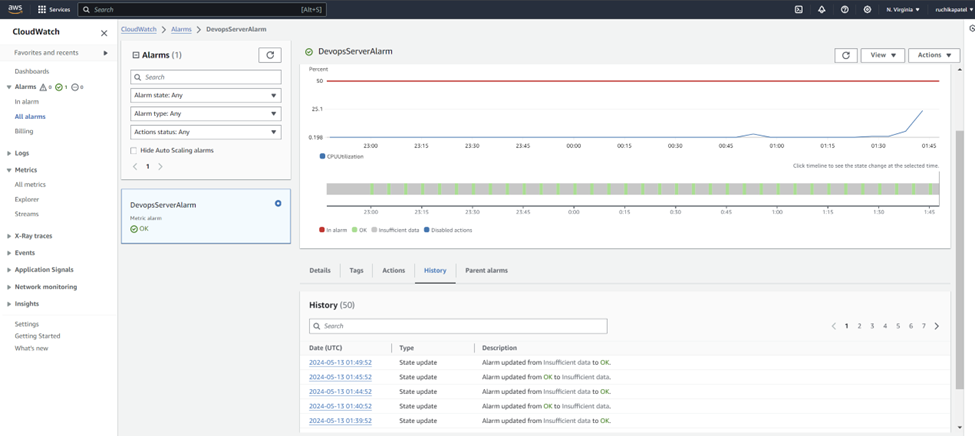
· Watch the Alarm, currently the CPU utilization is lower than the threshold we have set.
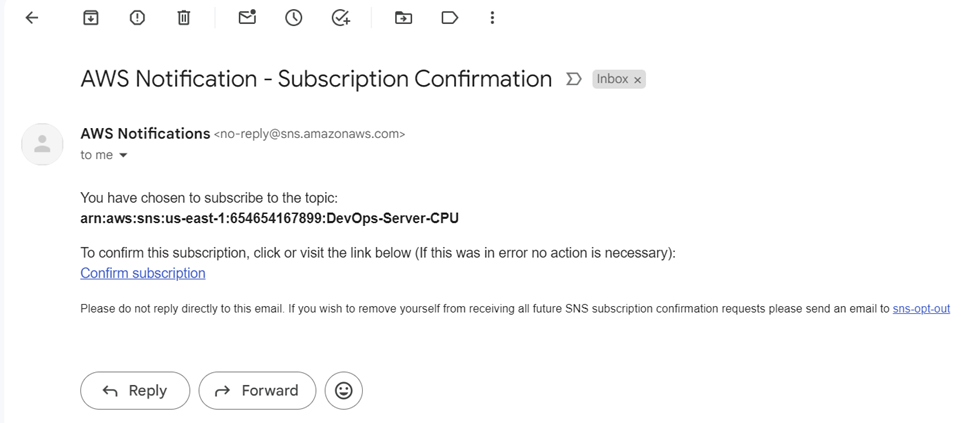
- Also, once you subscribe the topic, you will receive an email to confirm your subscription.
· On successful subscription
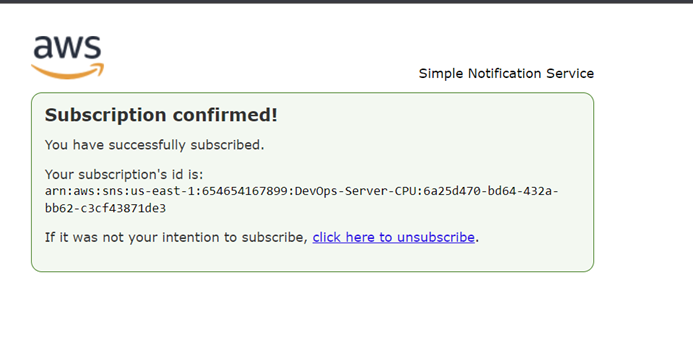
· Also, you can navigate to Amazon SNS service to look at the subscription status:

• Let’s do a stress test: (To check what actions are taken if we exceed our CPU Utilization)
Stress is a simple command-line tool that is used to simulate high CPU and memory usage on a system. This tool can be used to test the stability of a system by stressing the CPU, RAM, and disk I/O. It is commonly used by system administrators to test the stability and reliability of servers and other critical systems.
So, in your EC2 terminal type the following commands:
- Install Stress and S-TUI: sudo apt install stress
- Determine CPU Cores: nproc
- To run the stress test using the Stress tool, run:
stress --cpu 8 --timeout 500
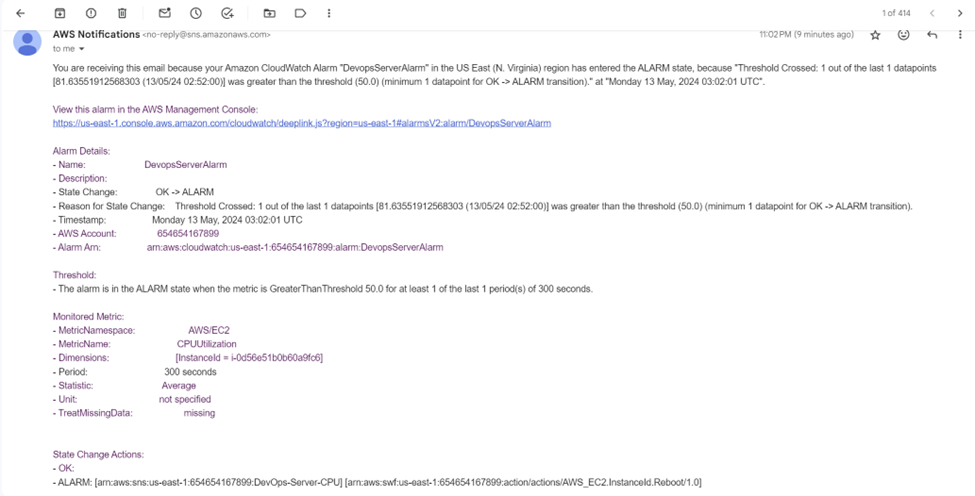
- Alarm went from OK state to in alarm state as threshold reached above 50.
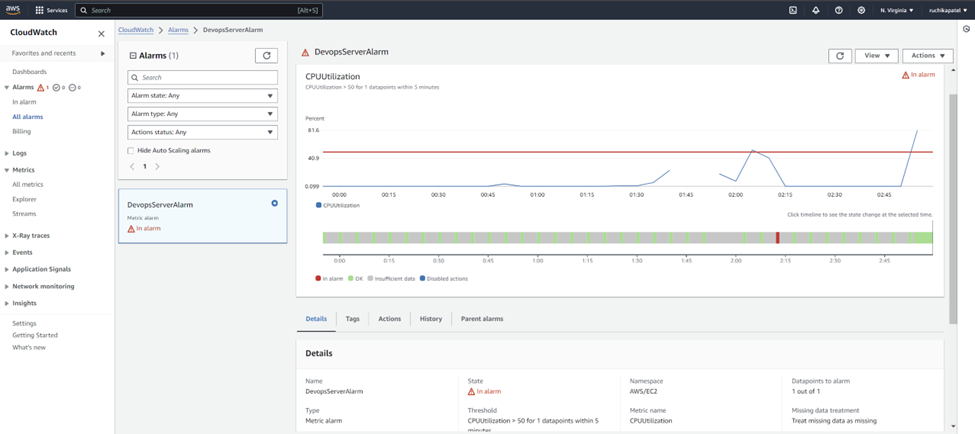
- Also, you will get an email notification through Amazon SNS, when CloudWatch alarm (DevOpsServer Alarm) is triggered.
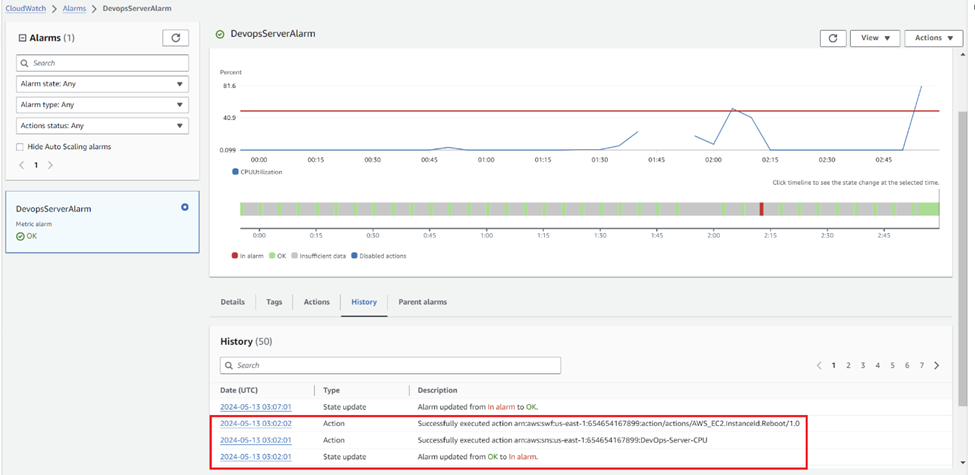
· Also, if we check the what actions were taken when it crossed the threshold value, you can navigate to CloudWatch>Alarms>All alarms and under history you can see. In our case we specified that if the instance crosses the threshold value (> 50), it will reboot the instance.
Once you are done with the lab, make sure to clean up AWS resources to avoid incurring unnecessary charges.
Monitoring your AWS resources is crucial for maintaining their health and performance. The CloudWatch monitoring dashboard is a powerful tool for monitoring various metrics, including CPU utilization and network metrics, for your EC2 instances.
In this lab, we have learned how to create a CloudWatch monitoring dashboard and how to set up a CloudWatch alarm to monitor CPU utilization for an EC2 instance. By completing this lab, we have gained knowledge and skills to create customized dashboards to monitor and optimize our AWS resources effectively. Regular monitoring and optimization of AWS resources using the CloudWatch dashboard can help identify and fix issues early, improving the reliability and performance of your applications. By following the steps outlined in this lab, you can set up your monitoring dashboard and alarms to ensure that your AWS resources are operating at peak performance.
Happy Learning!!
Thank you
Subscribe to my newsletter
Read articles from Ruchika Patel directly inside your inbox. Subscribe to the newsletter, and don't miss out.
Written by
