Elasticsearch Logstash Kibana Filebeat installation and integration
 Anant Saraf
All the components Elasticsearch Logstash Kibana Filebeat have same version 8.13.3
All the components are installed on separate ec2 instances and respective ports are opened to receive traffic (5044 ,5601,9200 etc....)
Elasticsearch Installation :
Reference article : Reference https://www.elastic.co/guide/en/elastic-stack/8.13/installing-stack-demo-self.html#install-stack-self-prereqs
Log in to the host where you’d like to set up your first Elasticsearch node.
Create a working directory for the installation package:
mkdir elastic-install-files
cd elastic-install-files
- Download the Elasticsearch RPM and checksum file from the Elastic Artifact Registry. You can find details about these steps in the section https://www.elastic.co/guide/en/elasticsearch/reference/8.13/rpm.html#install-rpm .
wget https://artifacts.elastic.co/downloads/elasticsearch/elasticsearch-8.13.3-x86_64.rpm
wget https://artifacts.elastic.co/downloads/elasticsearch/elasticsearch-8.13.3-x86_64.rpm.sha512
- Run the Elasticsearch install command:
sudo rpm --install elasticsearch-8.13.3-x86_64.rpm
The Elasticsearch install process enables certain security features by default, including the following:
Authentication and authorization are enabled, including a built-in
elasticsuperuser account.Certificates and keys for TLS are generated for the transport and HTTP layer, and TLS is enabled and configured with these keys and certificates.
sudo systemctl daemon-reload
sudo systemctl enable elasticsearch.service
Configure the first Elasticsearch node for connectivity
In a terminal, run the
ifconfigcommand and copy the value for the host inet IP address (for example,10.128.0.84). You’ll need this value later.Open the Elasticsearch configuration file in a text editor, such as
vim:
sudo vim /etc/elasticsearch/elasticsearch.yml
# Use a descriptive name for your cluster:
#
cluster.name: elasticsearch-demo

# By default Elasticsearch is only accessible on localhost. Set a different
# address here to expose this node on the network:
#
network.host: 172.31.0.29
Elasticsearch needs to be enabled to listen for connections from other, external hosts.
Uncomment the line
#transport.host: 0.0.0.0. The0.0.0.0setting enables Elasticsearch to listen for connections on all available network interfaces. Note that in a production environment you might want to restrict this by setting this value to match the value set fornetwork.host.
# Allow HTTP API connections from anywhere
# Connections are encrypted and require user authentication
http.host: 0.0.0.0
- Now, it’s time to start the Elasticsearch service
sudo systemctl start elasticsearch.service
- Make sure that Elasticsearch is running properly , but before that you will need to get password for elasticsearch
/usr/share/elasticsearch/bin/elasticsearch-reset-password -u elastic
after that run the following command
sudo curl --cacert /etc/elasticsearch/certs/http_ca.crt -u elastic:$ELASTIC_PASSWORD https://localhost:9200
You will get following output
{
  "name" : "Cp9oae6",
  "cluster_name" : "elasticsearch",
  "cluster_uuid" : "AT69_C_DTp-1qgIJlatQqA",
  "version" : {
    "number" : "{version_qualified}",
    "build_type" : "{build_type}",
    "build_hash" : "f27399d",
    "build_flavor" : "default",
    "build_date" : "2016-03-30T09:51:41.449Z",
    "build_snapshot" : false,
    "lucene_version" : "{lucene_version}",
    "minimum_wire_compatibility_version" : "1.2.3",
    "minimum_index_compatibility_version" : "1.2.3"
  },
  "tagline" : "You Know, for Search"
}
Install Kibana
- Log in to the host where you’d like to install Kibana and create a working directory for the installation package:
mkdir kibana-install-files
cd kibana-install-files
- Download the Kibana RPM and checksum file from the Elastic website.
wget https://artifacts.elastic.co/downloads/kibana/kibana-8.13.3-x86_64.rpm
wget https://artifacts.elastic.co/downloads/kibana/kibana-8.13.3-x86_64.rpm.sha512
- Run the Kibana install command:
sudo rpm --install kibana-8.13.3-x86_64.rpm
As with each additional Elasticsearch node that you added, to enable this Kibana instance to connect to the first Elasticsearch node, you need to configure an enrollment token.
Return to your terminal shell into the first Elasticsearch node.
Run the
elasticsearch-create-enrollment-tokencommand with the-s kibanaoption to generate a Kibana enrollment token:
sudo /usr/share/elasticsearch/bin/elasticsearch-create-enrollment-token -s kibana
Copy the generated enrollment token from the command output.
Back on the Kibana host, run the following two commands to enable Kibana to run as a service using
systemd, enabling Kibana to start automatically when the host system reboots.
sudo systemctl daemon-reload
sudo systemctl enable kibana.service
In a terminal, run the
ifconfigcommand and copy the value for the host inet IP address.Open the Kibana configuration file for editing:
sudo vim /etc/kibana/kibana.yml
# Specifies the address to which the Kibana server will bind. IP addresses and host names are both valid values.
# The default is 'localhost', which usually means remote machines will not be able to connect.
# To allow connections from remote users, set this parameter to a non-loopback address.
#server.host: "localhost"
server.host: 172.31.0.139
sudo systemctl status kibana -l
In the
statuscommand output, a URL is shown with:A host address to access Kibana
A six digit verification code
For example:
Kibana has not been configured.
Go to http://10.128.0.28:5601/?code=<code> to get started.
Open a web browser to the external IP address of the Kibana host machine, for example:
http://<kibana-host-address>:5601.It can take a minute or two for Kibana to start up, so refresh the page if you don’t see a prompt right away.
When Kibana starts you’re prompted to provide an enrollment token. Paste in the Kibana enrollment token that you generated earlier.
Click Configure Elastic.
If you’re prompted to provide a verification code, copy and paste in the six digit code that was returned by the
statuscommand. Then, wait for the setup to complete.When you see the Welcome to Elastic page, provide the
elasticas the username and provide the password that you copied in Step 1, from theinstallcommand output when you set up your first Elasticsearch node.Click Log in.
Logstash Installation
- Download and install the public signing key:
sudo rpm --import https://artifacts.elastic.co/GPG-KEY-elasticsearch
- Add the following in your
/etc/yum.repos.d/directory in a file with a.reposuffix, for examplelogstash.repo
[logstash-8.x]
name=Elastic repository for 8.x packages
baseurl=https://artifacts.elastic.co/packages/8.x/yum
gpgcheck=1
gpgkey=https://artifacts.elastic.co/GPG-KEY-elasticsearch
enabled=1
autorefresh=1
type=rpm-md
sudo yum install logstash
Filebeat Installation :
Install Filebeat on all the servers you want to monitor.
- To download and install Filebeat, use the commands that work with your system:
curl -L -O https://artifacts.elastic.co/downloads/beats/filebeat/filebeat-8.13.3-x86_64.rpm
sudo rpm -vi filebeat-8.13.3-x86_64.rpm
filebeat modules list
- Now we want to transfer the logs from filebeat to logstash
sudo service filebeat start
- Check if logstash is reachable from filebeat
[root@ip-172-31-0-57 ~]# telnet 172.31.0.196 5044
Trying 172.31.0.196...
Connected to 172.31.0.196.
Escape character is '^]'.
- Setup following configuration in filebeat in /etc/filebeat/filebeat.yml
# ============================== Filebeat inputs ===============================

filebeat.inputs:

# Each - is an input. Most options can be set at the input level, so
# you can use different inputs for various configurations.
# Below are the input-specific configurations.

# filestream is an input for collecting log messages from files.
- type: filestream

  # Unique ID among all inputs, an ID is required.
  id: my-filestream-id

  # Change to true to enable this input configuration.
  enabled: true

  # Paths that should be crawled and fetched. Glob based paths.
  paths:
    - /var/log/*.log
    #- c:\programdata\elasticsearch\logs\*
and this one as well
# ---------------------------- Elasticsearch Output ----------------------------
#output.elasticsearch:
  # Array of hosts to connect to.
  # hosts: ["3.89.91.147:9200"]

  # Performance preset - one of "balanced", "throughput", "scale",
  # "latency", or "custom".
  # preset: balanced

  # Protocol - either `http` (default) or `https`.
  # protocol: "http"

  # Authentication credentials - either API key or username/password.
  #api_key: "id:api_key"
  # username: "elastic"
  # password: "LZX6TyiRu6IiLPS5D8c4"

# ------------------------------ Logstash Output -------------------------------
output.logstash:
  # The Logstash hosts
  hosts: ["172.31.0.196:5044"]

  # Optional SSL. By default is off.
  # List of root certificates for HTTPS server verifications
  #ssl.certificate_authorities: ["/etc/pki/root/ca.pem"]

  # Certificate for SSL client authentication
  #ssl.certificate: "/etc/pki/client/cert.pem"

  # Client Certificate Key
  #ssl.key: "/etc/pki/client/cert.key"
The logs are moving from filebeat to logstash on port 5044 so elasticsearch will be commented
check errors in /var/log/filebeat or in /var/log/messages
As refered in point 4 you must check connectivity
Now once the filebeat is setup the logstash server must be setup to accept logs from filebeat server
On logstash server check do the following changes in /etc/logstash/conf.d/logstash.conf file as follows
input {
  beats {
    port => 5044
  }
}

output {
  if [@metadata][pipeline] {
    elasticsearch {
      hosts => ["https://172.31.0.29:9200"]
      index => "%{[@metadata][beat]}-%{[@metadata][version]}"
      user => "elastic"
      password => "LZX6TyiRu6IiLPS5D8c4"
      ssl_certificate_verification => false
    }
  } else {
    elasticsearch {
      hosts => ["https://172.31.0.29:9200"]
      index => "%{[@metadata][beat]}-%{[@metadata][version]}"
      user => "elastic"
      password => "LZX6TyiRu6IiLPS5D8c4"
      ssl_certificate_verification => false
    }
  }
}
While doing these changes and restarting the logstash server you me face following errors in file /var/log/messages
If
systemctl restart logstashcommand is stuck then get the logstash process id and kill the processIn /var/log/messages you me see following error
  {"log.level":"error","@timestamp":"2024-05-03T08:31:43.922Z","log.logger":"esclientleg","log.origin":{"function":"github.com/elastic/beats/v7/libbeat/esleg/eslegclient.NewConnectedClient","file.name":"eslegclient/connection.go","file.line":252},"message":"error connecting to Elasticsearch at https://44.204.25.156:9200: Get \"https://44.204.25.156:9200\": x509: certificate signed by unknown authority","service.name":"filebeat","ecs.version":"1.6.0"}
  {"log.level":"error","@timestamp":"2024-05-03T08:31:43.922Z","log.origin":{"function":"github.com/elastic/beats/v7/libbeat/cmd/instance.handleError","file.name":"instance/beat.go","file.line":1340},"message":"Exiting: couldn't connect to any of the configured Elasticsearch hosts. Errors: [error connecting to Elasticsearch at https://44.204.25.156:9200: Get \"https://44.204.25.156:9200\": x509: certificate signed by unknown authority]","service.name":"filebeat","ecs.version":"1.6.0"}
After setting proper parameters in /etc/logstash/conf.d/logstash.conf
- Due to version mismatch between components like Logstash Kibana Filebeat installation you me get following error
[2024-05-03T09:37:32,917][INFO ][org.logstash.beats.Server][main][8c5f2ea2816e38114261fe0663fd260f47d161ea67b786d5cb59066fc193a38e] Starting server on port: 5044
[2024-05-03T09:52:32,751][INFO ][org.logstash.beats.BeatsHandler][main][8c5f2ea2816e38114261fe0663fd260f47d161ea67b786d5cb59066fc193a38e] [local: 172.31.0.150:5044, remote: 3.87.62.81:52812] Handling exception: io.netty.handler.codec.DecoderException: org.logstash.beats.InvalidFrameProtocolException: Invalid version of beats protocol: -1 (caused by: org.logstash.beats.InvalidFrameProtocolException: Invalid version of beats protocol: -1)
[2024-05-03T09:52:32,753][WARN ][io.netty.channel.DefaultChannelPipeline][main][8c5f2ea2816e38114261fe0663fd260f47d161ea67b786d5cb59066fc193a38e] An exceptionCaught() event was fired, and it reached at the tail of the pipeline. It usually means the last handler in the pipeline did not handle the exception.
io.netty.handler.codec.DecoderException: org.logstash.beats.InvalidFrameProtocolException: Invalid version of beats protocol: -1
        at io.netty.handler.codec.ByteToMessageDecoder.callDecode(ByteToMessageDecoder.java:500) ~[netty-codec-4.1.109.Final.jar:4.1.109.Final]
        at io.netty.handler.codec.ByteToMessageDecoder.channelRead(ByteToMessageDecoder.java:290) ~[netty-codec-4.1.109.Final.jar:4.1.109.Final]
        at io.netty.channel.AbstractChannelHandlerContext.invokeChannelRead(AbstractChannelHandlerContext.java:444) ~[netty-transport-4.1.109.Final.jar:4.1.109.Final]
- Once we resolve all errors we will get following messages
less /var/log/messages
May  5 14:06:03 ip-172-31-0-196 logstash: [2024-05-05T14:06:03,859][INFO ][logstash.javapipeline    ][main] Starting pipeline {:pipeline_id=>"main", "pipeline.workers"=>2, "pipeline.batch.size"=>125, "pipeline.batch.delay"=>50, "pipeline.max_inflight"=>250, "pipeline.sources"=>["/etc/logstash/conf.d/logstash.conf"], :thread=>"#<Thread:0x2b7ab562 /usr/share/logstash/logstash-core/lib/logstash/java_pipeline.rb:134 run>"}
May  5 14:06:04 ip-172-31-0-196 logstash: [2024-05-05T14:06:04,599][INFO ][logstash.javapipeline    ][main] Pipeline Java execution initialization time {"seconds"=>0.74}
May  5 14:06:04 ip-172-31-0-196 logstash: [2024-05-05T14:06:04,607][INFO ][logstash.inputs.beats    ][main] Starting input listener {:address=>"0.0.0.0:5044"}
May  5 14:06:04 ip-172-31-0-196 logstash: [2024-05-05T14:06:04,618][INFO ][logstash.javapipeline    ][main] Pipeline started {"pipeline.id"=>"main"}
May  5 14:06:04 ip-172-31-0-196 logstash: [2024-05-05T14:06:04,641][INFO ][logstash.agent           ] Pipelines running {:count=>1, :running_pipelines=>[:main], :non_running_pipelines=>[]}
May  5 14:06:04 ip-172-31-0-196 logstash: [2024-05-05T14:06:04,708][INFO ][org.logstash.beats.Server][main][dd54c7549f35fae436fe9a95be572022d18819c0edd32ee7226d4a24089587d2] Starting server on port: 5044
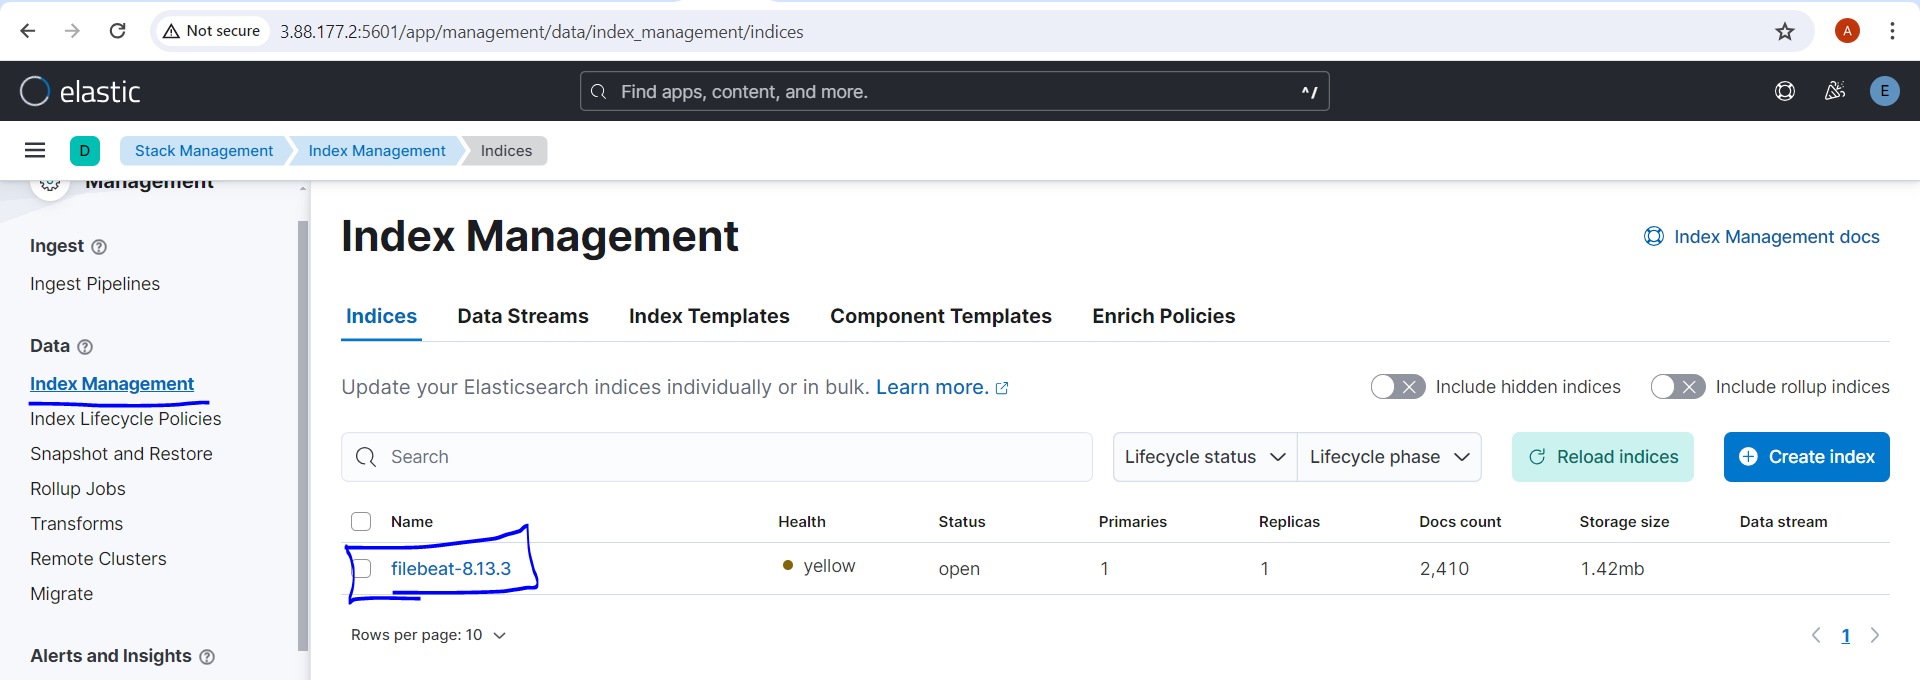
Under "Stack Management" ---> "Index Management" we will get our index

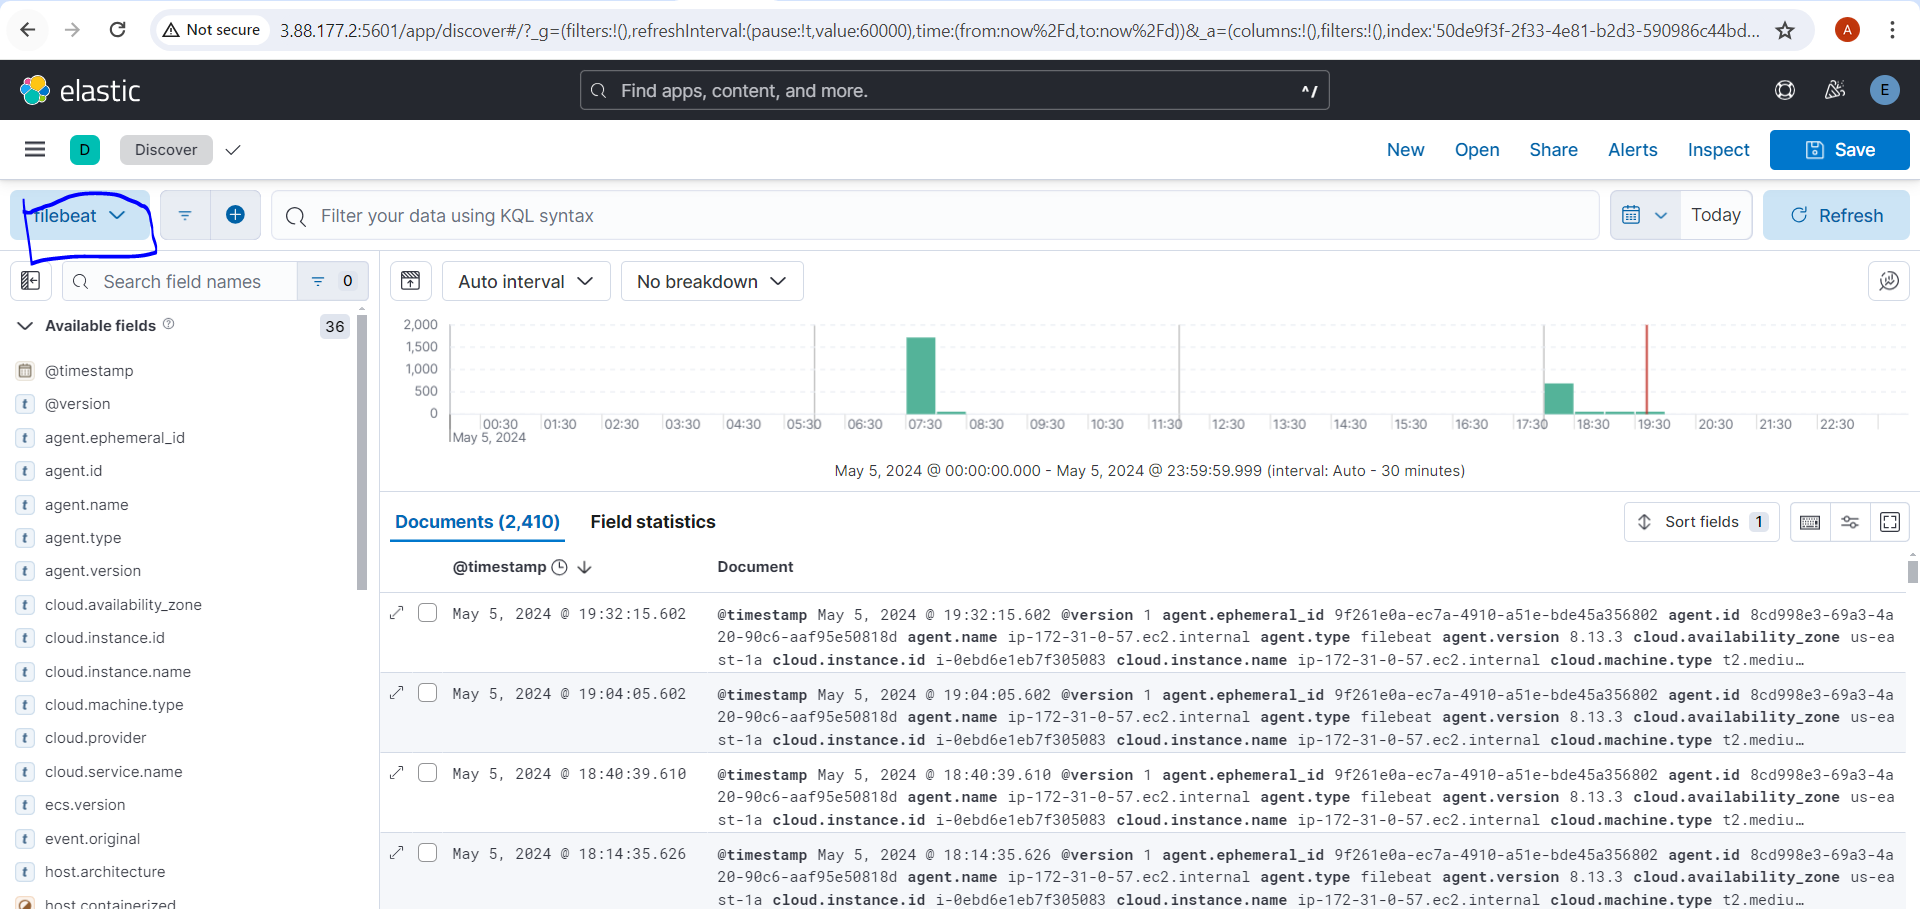
Now setup the index and we will get following in kibana

Subscribe to my newsletter
Read articles from Anant Saraf directly inside your inbox. Subscribe to the newsletter, and don't miss out.
Written by
