Add code snippet in RubyMine and Visual Studio Code to binding.break
 Lucian Ghinda
Here is a quick way to add a manual breakpoint in the code using code snippets.
The code
What I usually want to see directly when I debug Ruby code and I cannot (or don't have time to set up the RDBG) is the variables and methods of the current object and the values of all instance variables and local variables at the breakpoint.
For this, I moved to use the debug gem, and I wrote:
binding.break(pre: 'ls ;; i')
Where (source):
ls- "Show you available methods, constants, local variables, and instance variables in the current scope"i- "Show information about current frame (local/instance variables and defined constants)"
RubyMine
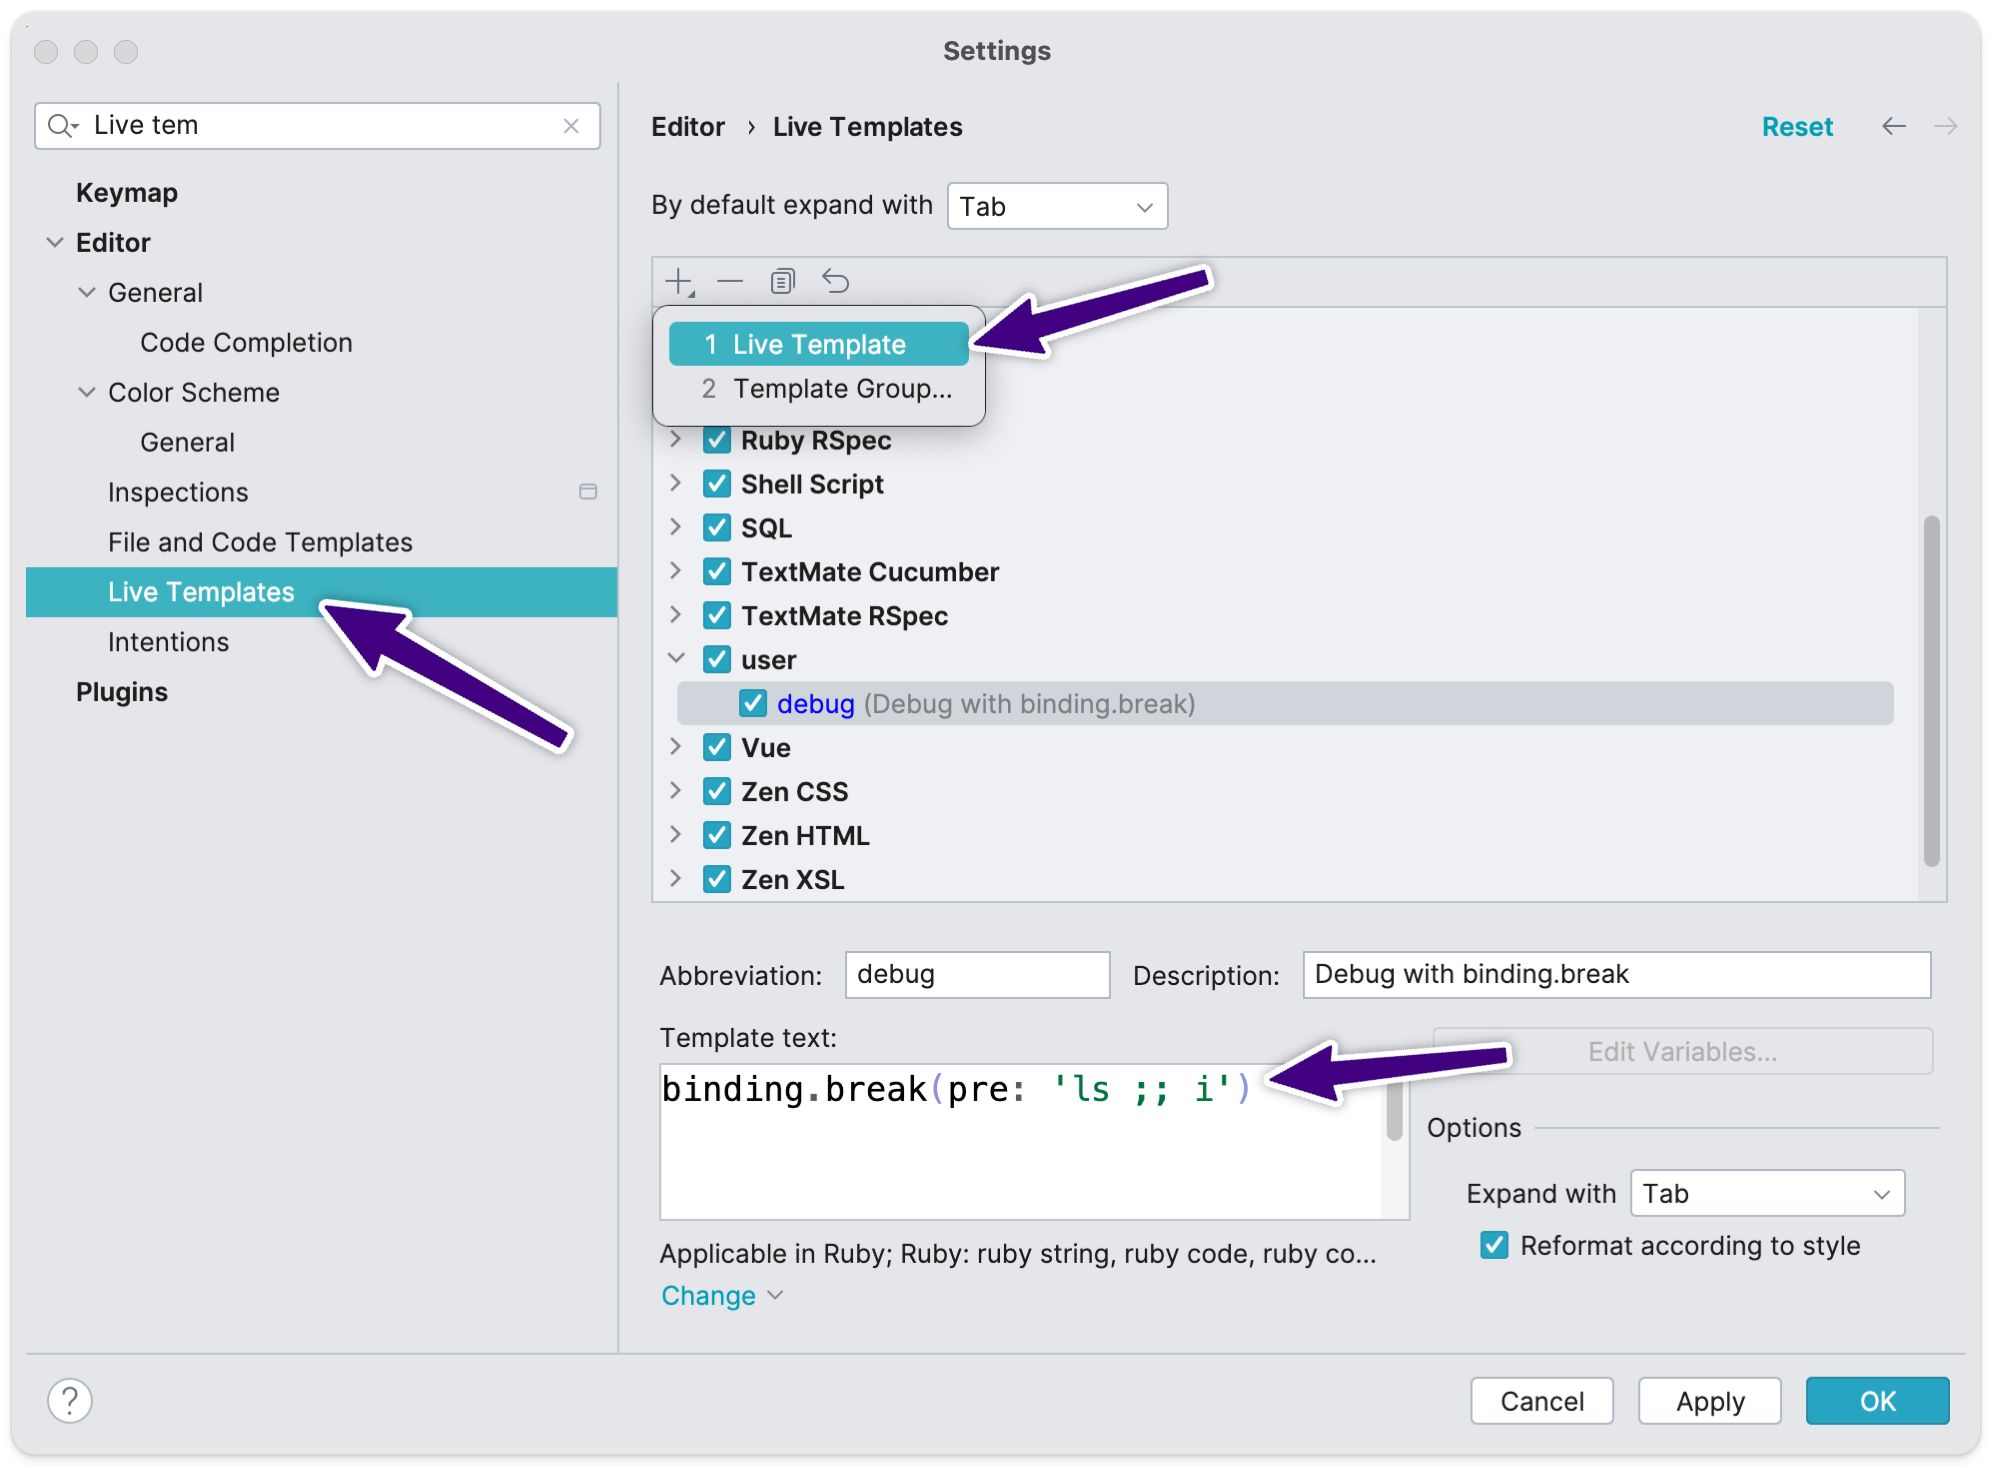
In RubyMine, code snippets are called Live Templates; you can find them in Settings.

The steps to add a code snippet are:
Search for
Live TemplatesOpen Live Templates and click on the
+sign to add a new Live TemplateFill in the
Abbreviationwithdebug(or if you prefer a shorter char choose something else)Fill in the
Template Textwithbinding.break(pre: 'ls ;; i')Choose the expand action - I use
Tabfor itWrite a meaningful description for you. I wrote here:
Debug with binding.breakClick
Apply
Here is what it looks like when run:
Visual Studio Code
To add the same snippet to Visual Studio Code you have to do the following steps:
Go to Settings -> Configure User Snippets
Choose "New Global Snippets File" and give it a name like
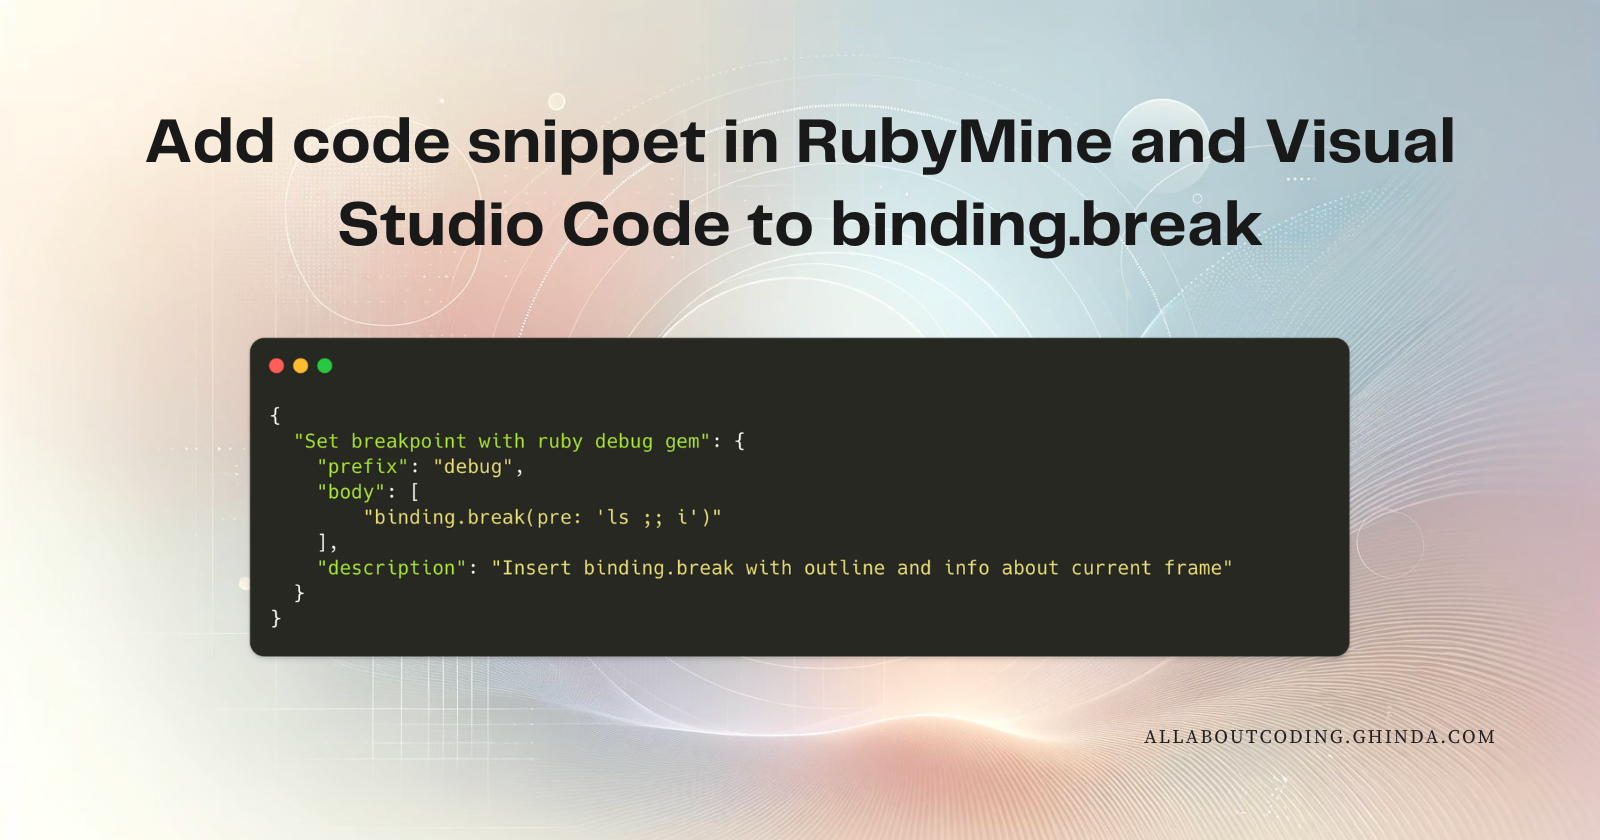
Ruby SnippetsAnd then add the following inside that file:
{
  "Set breakpoint with ruby debug gem": {
    "prefix": "debug",
    "body": [
        "binding.break(pre: 'ls ;; i')"
    ],
    "description": "Insert binding.break with outline and info about current frame"
  }
}
Save it and it will just work.
Here is how it looks like when you are using it:
And that's it.
A better alternative
A better alternative for debugging is to use in RubyMine the integrated debugger or to use the VSCode rdbg Ruby Debugger in Visual Studio Code.
I am using the code snippet when I want a quick jump in to execute some custom code and the project is not configured to work with any of those debuggers. I sometimes take a look at open source Ruby on Rails projects and I want the fastest way to look at what's happening in some specific points in code.
Subscribe to my newsletter
Read articles from Lucian Ghinda directly inside your inbox. Subscribe to the newsletter, and don't miss out.
Written by

Lucian Ghinda
Lucian Ghinda
Senior Product Engineer, working in Ruby and Rails. Passionate about idea generation, creativity, and programming. I curate the Short Ruby Newsletter.