Day 75 : Sending Docker Log to Grafana
 Prathmesh Vibhute
Monitoring is the backbone of any modern software infrastructure, ensuring that everything runs smoothly and issues are promptly addressed. With tools like Grafana and Docker, you can take your monitoring game to the next level by seamlessly integrating real-time logs from Docker containers into Grafana. In this blog post, we'll guide you through the process of setting up Docker, running containers with basic applications, and sending their logs to Grafana for insightful visualization.
Task-01: Install Docker and start docker service on a Linux EC2 through USER_DATA.
#!/bin/bash

sudo apt update
sudo apt install -y apt-transport-https ca-certificates curl software-properties-common
curl -fsSL https://download.docker.com/linux/ubuntu/gpg | sudo gpg --dearmor -o /usr/share/keyrings/docker-archive-keyring.gpg
echo "deb [arch=amd64 signed-by=/usr/share/keyrings/docker-archive-keyring.gpg] https://download.docker.com/linux/ubuntu $(lsb_release -cs) stable" | sudo tee /etc/apt/sources.list.d/docker.list > /dev/null
sudo apt update
sudo apt install -y docker-ce docker-ce-cli containerd.io
sudo systemctl start docker
sudo systemctl enable docker
sudo usermod -aG docker $USER
sudo reboot
Task-02: Create 2 Docker containers and run any basic application on those containers (A simple todo app will work).
First we have to install Grafana-server for monitoring purpose. You can follow this official installation guide here.
Follow this blog to run the simple node.js docker container app CLICK HERE..
Follow below steps to run 2nd container application.
we are going to run apache2 server on same ec2 instance.
#Create a new file called "Dockerfile" in a directory of your choice.
$ touch Dockerfile
#Open the Dockerfile using a text editor of your choice.
$ nano Dockerfile
#Add the following content to the Dockerfile:
FROM httpd:2.4
COPY index.html /usr/local/apache2/htdocs/
EXPOSE 80
#Save and exit the Dockerfile.
#Create a new file called "index.html" in the same directory as the Dockerfile.
$ touch index.html
#Open the index.html file using a text editor.
$ nano index.html
#Add the following content to the index.html file:
<!DOCTYPE html>
<html>
<head>
    <title>Hello, World!</title>
</head>
<body>
    <h1>Hello, World!</h1>
</body>
</html>
#Save and exit the index.html file.
#Build the Docker image using the following command:
$ docker build -t my-apache-image .
#Run the Docker container using the following command:
$ docker run -d -p 8080:80 my-apache-image
I have installed above mentioned all tools here is Screeen shot.

Run Prometheus monitoring tool using docker container. Follow below steps
Create file prometheus.yaml write below mentioned configuration code of promethues in that file.
#create file
sudo vi prometheus.yaml
#write configuations in this file
global:
  scrape_interval:     15s # By default, scrape targets every 15 seconds.

  # Attach these labels to any time series or alerts when communicating with
  # external systems (federation, remote storage, Alertmanager).
  external_labels:
    monitor: 'codelab-monitor'

# A scrape configuration containing exactly one endpoint to scrape:
# Here it's Prometheus itself.
scrape_configs:
  # The job name is added as a label `job=<job_name>` to any timeseries scraped from this config.
  - job_name: 'prometheus'

    # Override global default and scrape targets from this job every 5 seconds.
    scrape_interval: 5s

    static_configs:
      - targets: ['localhost:9090']
#save this file

After successfully edit the prometheus.yaml file you have to run docker container for above configurations.
Run folllowing command:
sudo docker run -d --name prometheus -v $(pwd):/etc/config -p 9090:9090 prom/prometheus --config.file=/etc/config/prometheus.yaml
Let’s break down the command and explain each part:
docker run: This is the command to run a Docker container.-d: It runs the container in the background (detached mode), allowing it to continue running even after the terminal session is closed.--name prometheus: It assigns the name "prometheus" to the container.-v $(pwd):/etc/config: It mounts the current working directory ($(pwd)) as a volume inside the container at the path/etc/config. This allows the container to access the Prometheus configuration file located in the current directory.-p 9090:9090: It maps port 9090 of the host machine to port 9090 of the container. This is necessary to access the Prometheus web interface running inside the container.prom/prometheus: It specifies the Docker image to use for creating the container. In this case, it uses the official Prometheus image from the Docker Hub.--config.file=/etc/config/prometheus.yaml: It sets the configuration file for Prometheus inside the container to/etc/config/prometheus.yaml. This assumes that aprometheus.yamlconfiguration file is present in the current directory and mounted as a volume.Run Command
sudo docker ps

All container are up and running.
Now you have allow inbound rules ports in instance security group in aws console.
Allow following inbound port rules.
Port 9090 for prometheus, Port 49160 for node.js app server, Port 8080 for apache-server, Port 3000 for Grafana, Port 9323 for docker logs.

- After all steps completion you can get prometheus dashboard like this on http://<public-ip>:9090
Now integrate the docker containers and share the real time logs with Grafana.
First we have to edit config file of docker daemon.json in etc/docker/daemon.json directory
If you don’t have any file in this directory then create daemon.json file and add following code to it.
{
        "metrics-addr" : "0.0.0.0:9323",
        "experimental" : true
}

#if this code not working then you can try following code

{
        "metrics-addr" : "127.0.0.1:9323",
        "experimental" : true
}

For apply this change you have to restart docker service '
sudo systemctl restart docker'Now wait some time and then check logs on http://<public-ip>:9323
You should get docker logs on webpage like following.

Now we have to add new target in prometheus.yaml file as follows.
Add Docker job in prometheus.yaml file.
- job_name: 'docker'
  scrape_interval: 5s
  static_configs:
    - targets: ['13.126.86.158:9323']

After above step you have to restart Prometheus docker container
docker restart <container id>`The Target of docker will added in prometheus targets section.
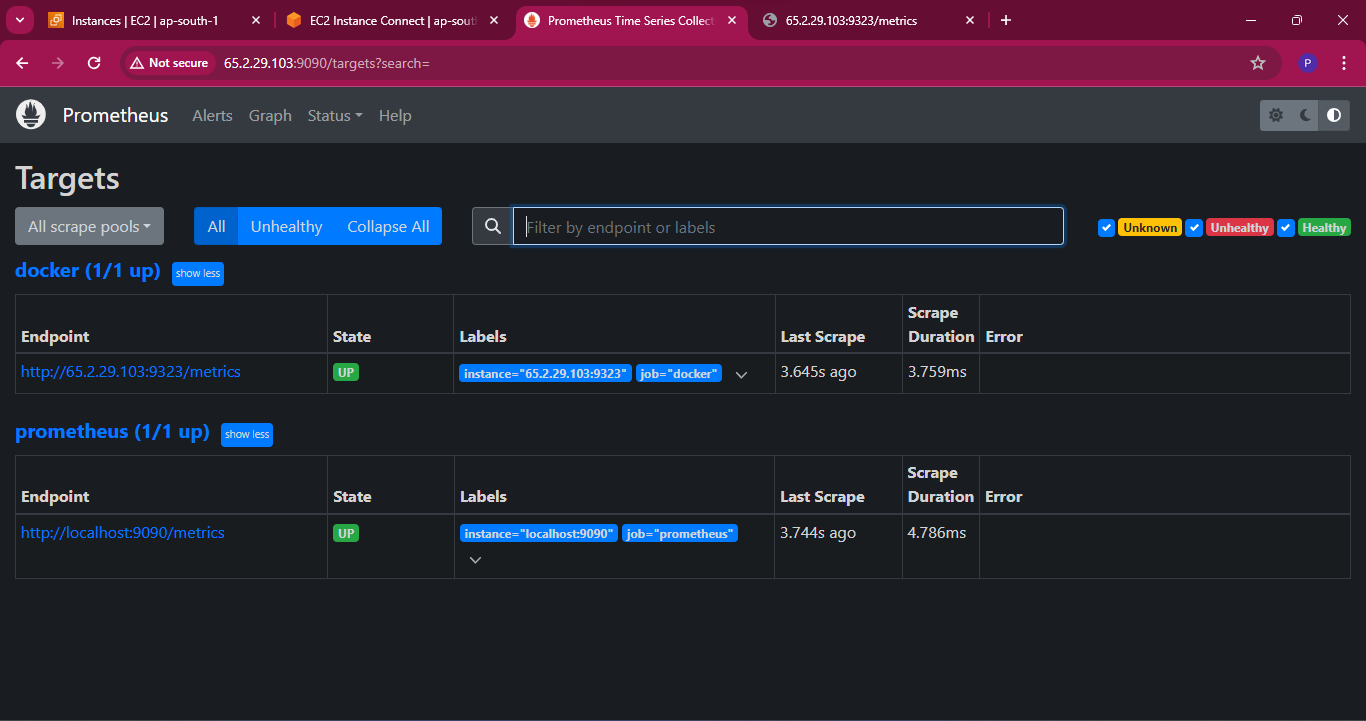
Check the logs and create docker dashboard on Grafana UI.
- To create Dashboard in Grafana you have to login with admin admin user and password on http://<public-ip>:3000
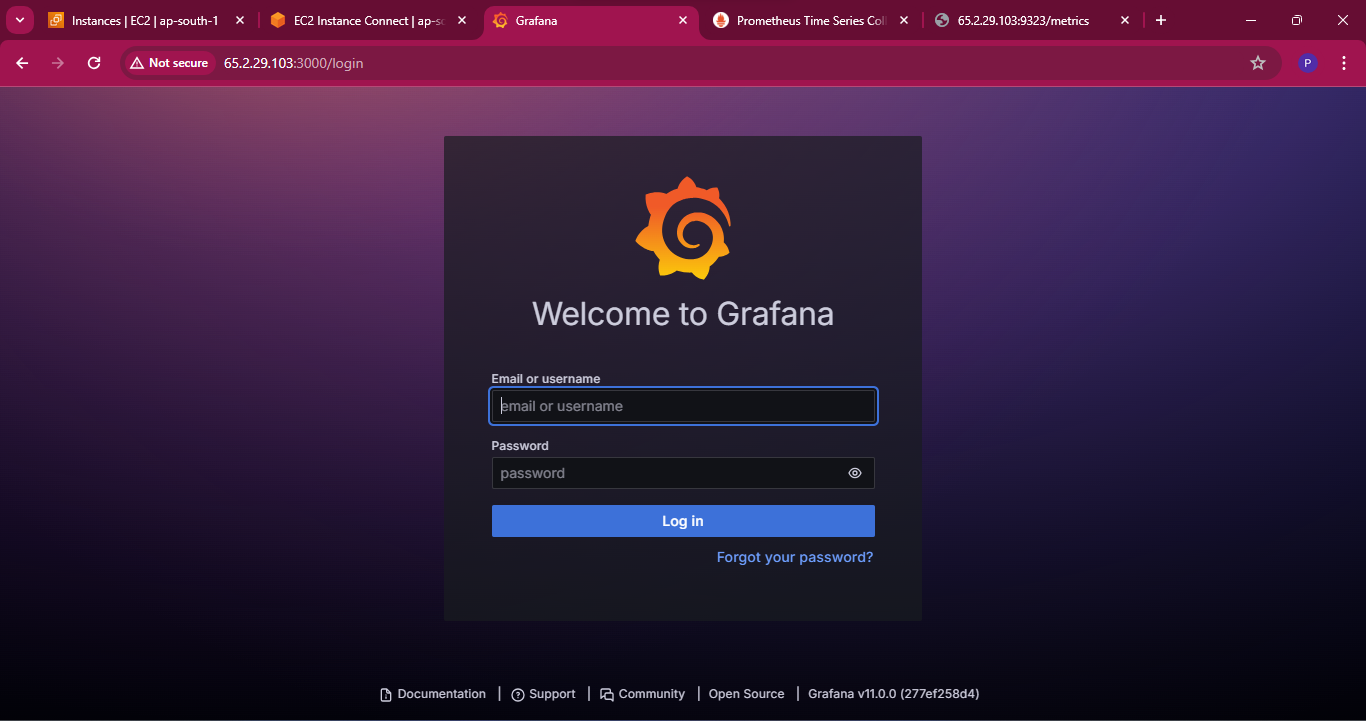
- After login click on Add your first data source.
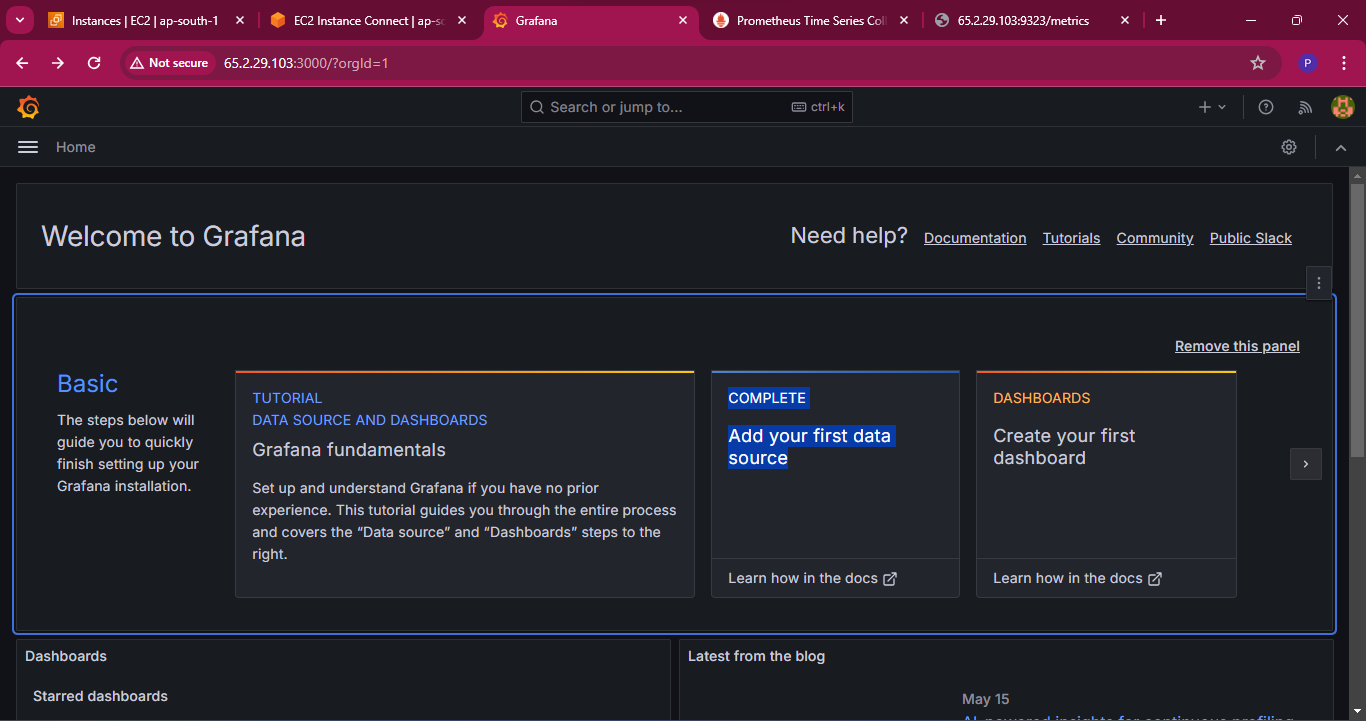
Then select Prometheus as Data source.
Now you have to put prometheus server url like as shown below.

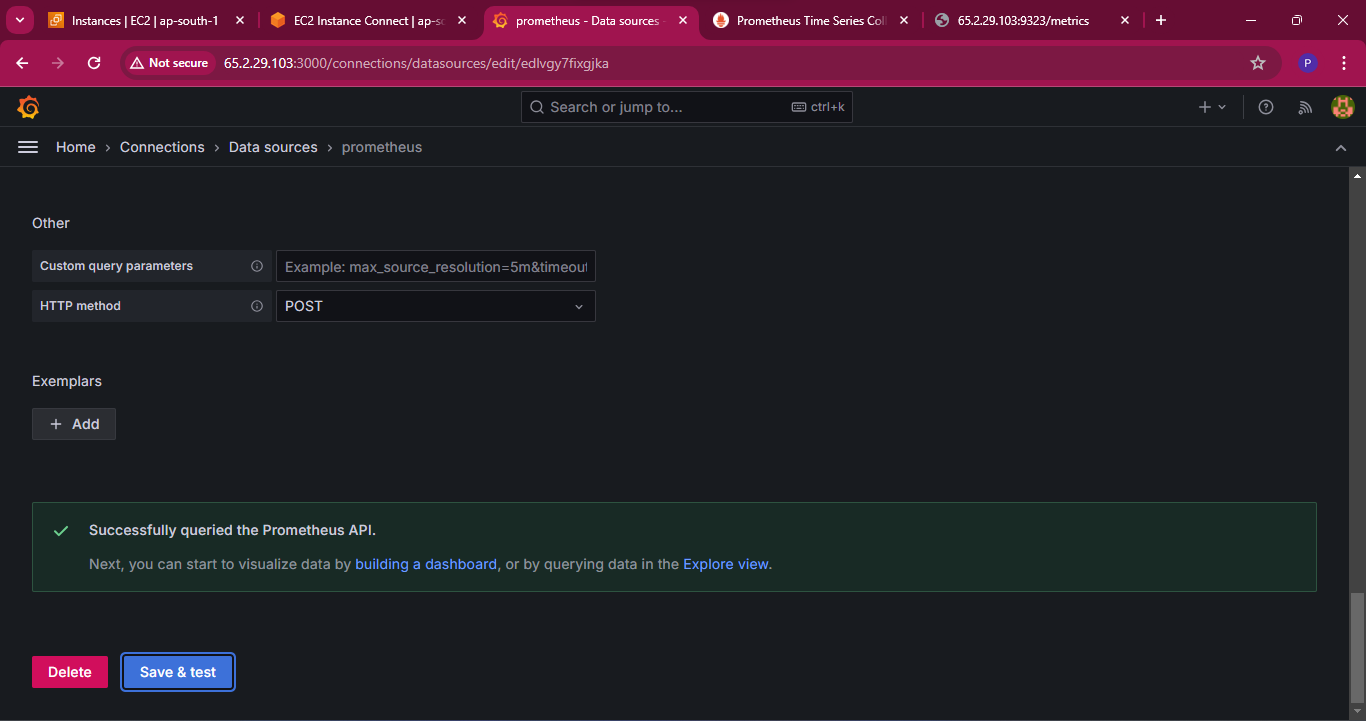
Now Click on save & test. Successfully done Message dialog will come.
In Grafana we can create various kinds of dashboards as per our need.
So, for this tutorial we will create a dashboard with 4panels.
First panel will display the number of Engine CPU, Second panel will display the numbers of Running Containers, Third panel will display the Paused Containers and the last panel will display the number of Stopped containers.
Click on Build Dashboard and then select new panel.
In the Metrics browser selection select
engine_daemmon_engine_cpus_cpus` then select job and job name is docker. Then click Run queries will fetch the number of Engine CPU.

Click on Add Panel to add second panel
In the Metrics browser selection select
engine_daemmon_container_states_containers` then select State filter and state is running. Then click Run queries will fetch the number of Running Container as shown below.

Click on Add Panel to add third panel.
In the Metrics browser selection select
engine_daemmon_container_states_containers` then select State filter and state is Pause. Then click Run queries will fetch the number of Paused Container as shown below.
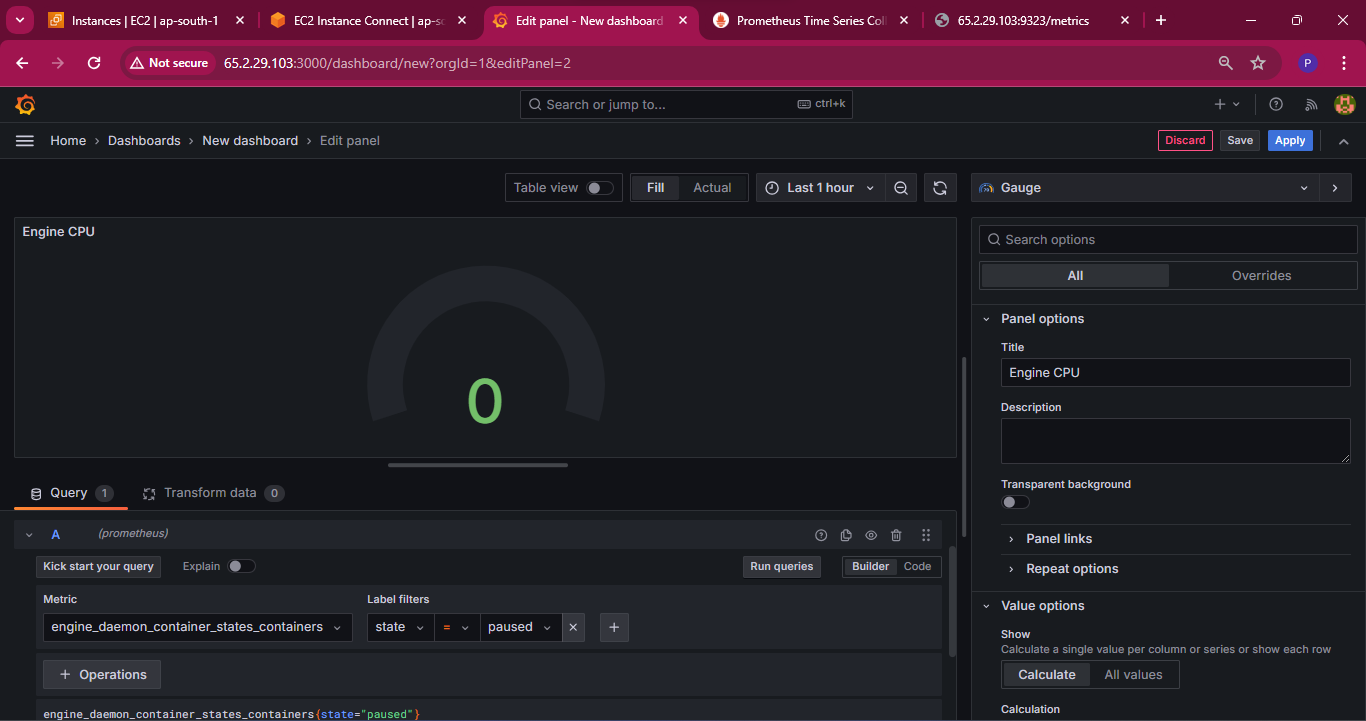
Click on Add Panel to add fourth panel.
In the Metrics browser selection select
engine_daemmon_container_states_containers` then select State filter and state is stopped . Then click Run queries will fetch the number of Stopped Container as shown below.

Click on save dashboard button to save the dashboard & give it a name of your choice.
if there is failure or any container goes down you can see here in real time.
The end result of a dashboard will look like:
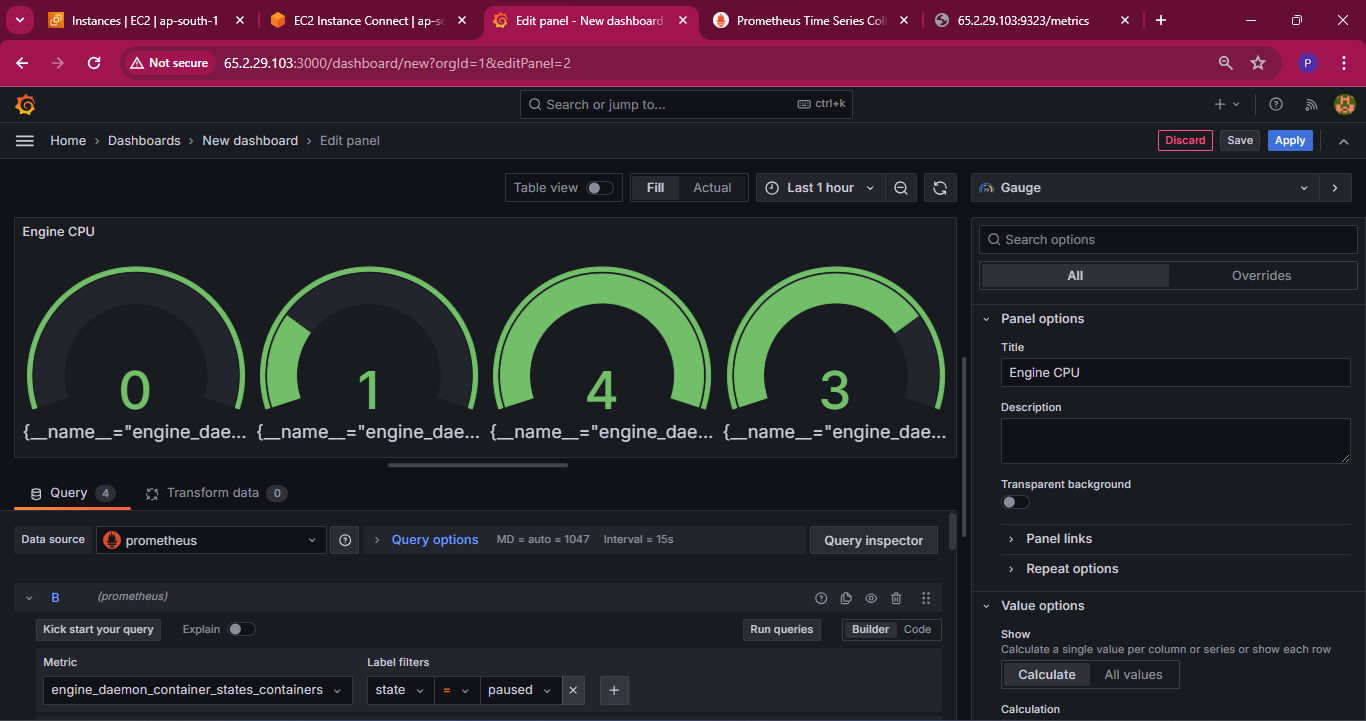
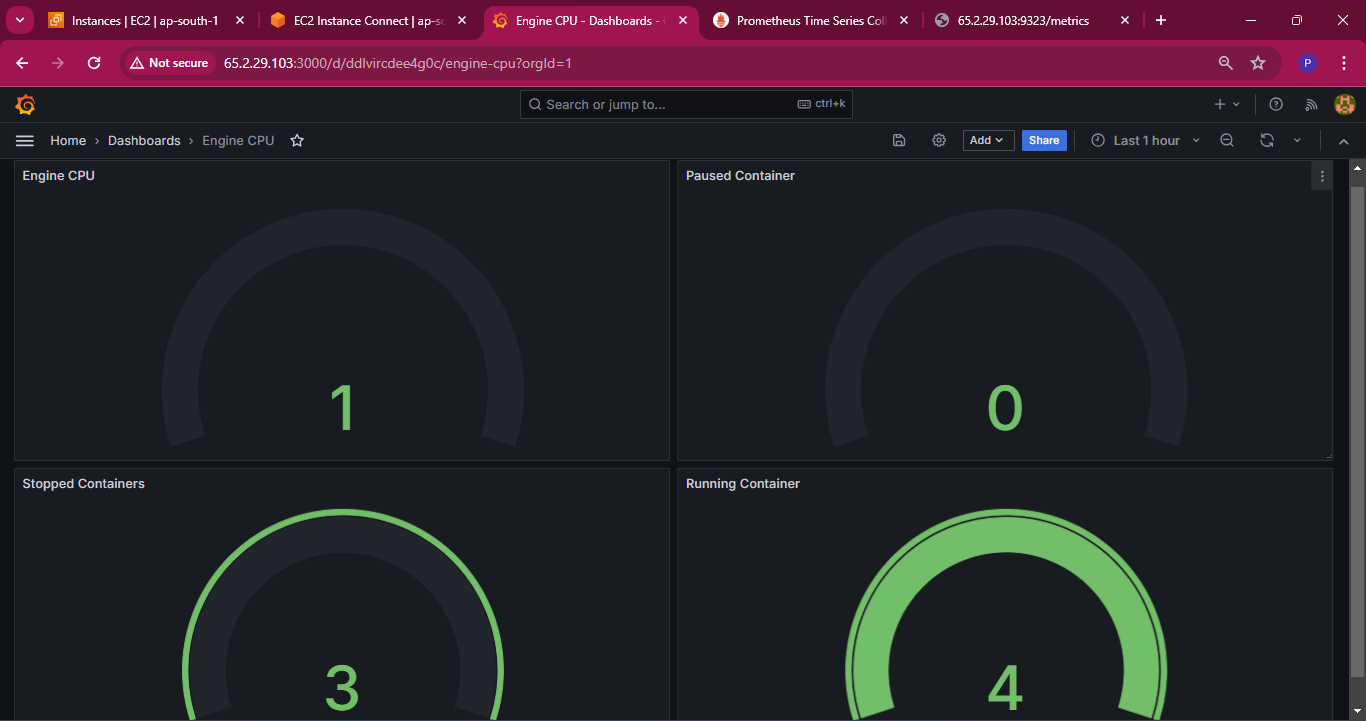
Conclusion
By following these steps, you've enhanced your monitoring infrastructure by integrating Docker logs into Grafana. This setup provides a centralized platform to monitor and analyze containerized applications, improving visibility and enabling proactive management.
Monitoring isn't just about keeping an eye on things; it's about gaining actionable insights and optimizing performance. With Grafana and Docker, you're equipped to take on the complexities of modern IT environments and ensure a smooth, efficient operation.
Keep exploring new tools, techniques, and integrations to stay ahead in the monitoring game. Happy monitoring! 😊🚀
I'm confident that this article will prove to be valuable, helping you discover new insights and learn something enriching .
thank you : )
Subscribe to my newsletter
Read articles from Prathmesh Vibhute directly inside your inbox. Subscribe to the newsletter, and don't miss out.
Written by
