Day 76 : Build a Grafana dashboard
 Prathmesh Vibhute
A Grafana dashboard provides an at-a-glance view of your data, enabling you to track key metrics through various visualizations. These dashboards are composed of panels, each depicting a different aspect of the story your data tells. Each panel is driven by a query that fetches the relevant data and a visualization that presents it in a user-friendly format. In this blog post, we'll walk you through the process of creating a Grafana dashboard, adding panels, and customizing your visualizations.
Task 01
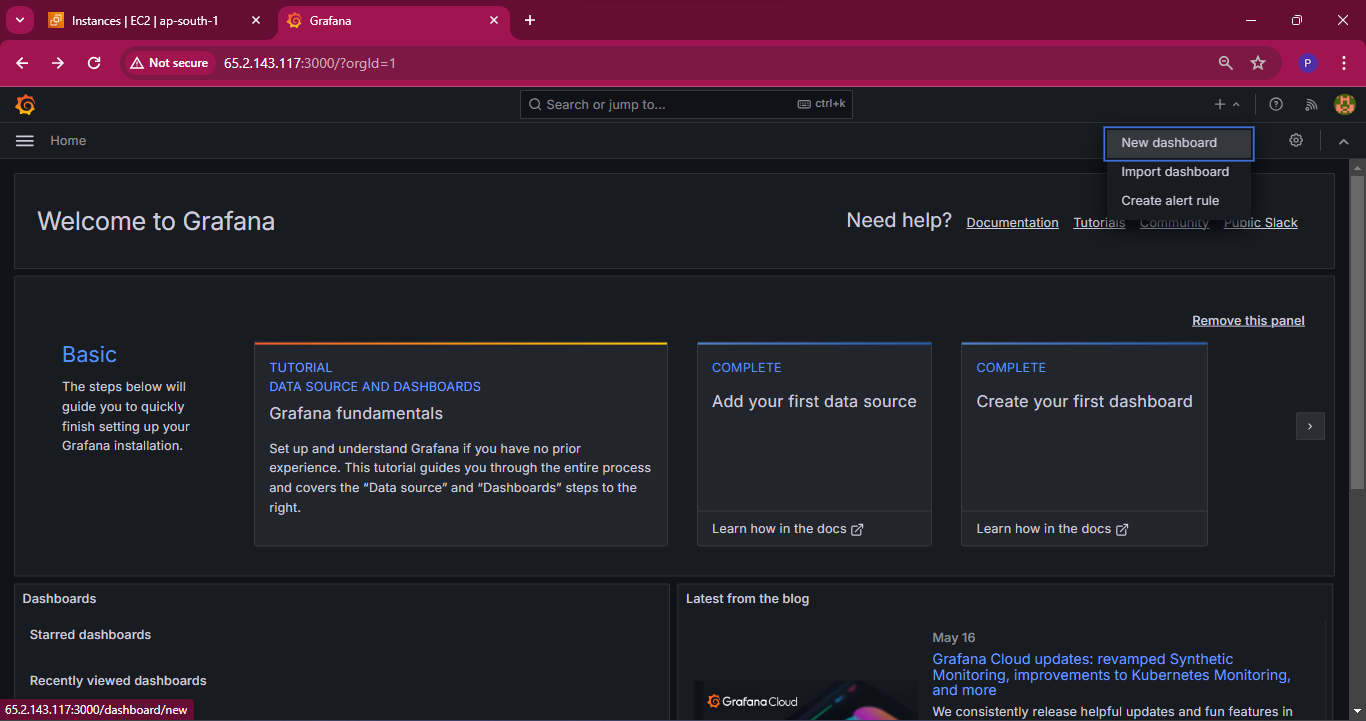
In the sidebar, hover your cursor over the Create (plus sign) icon and then click “New Dashboard”.
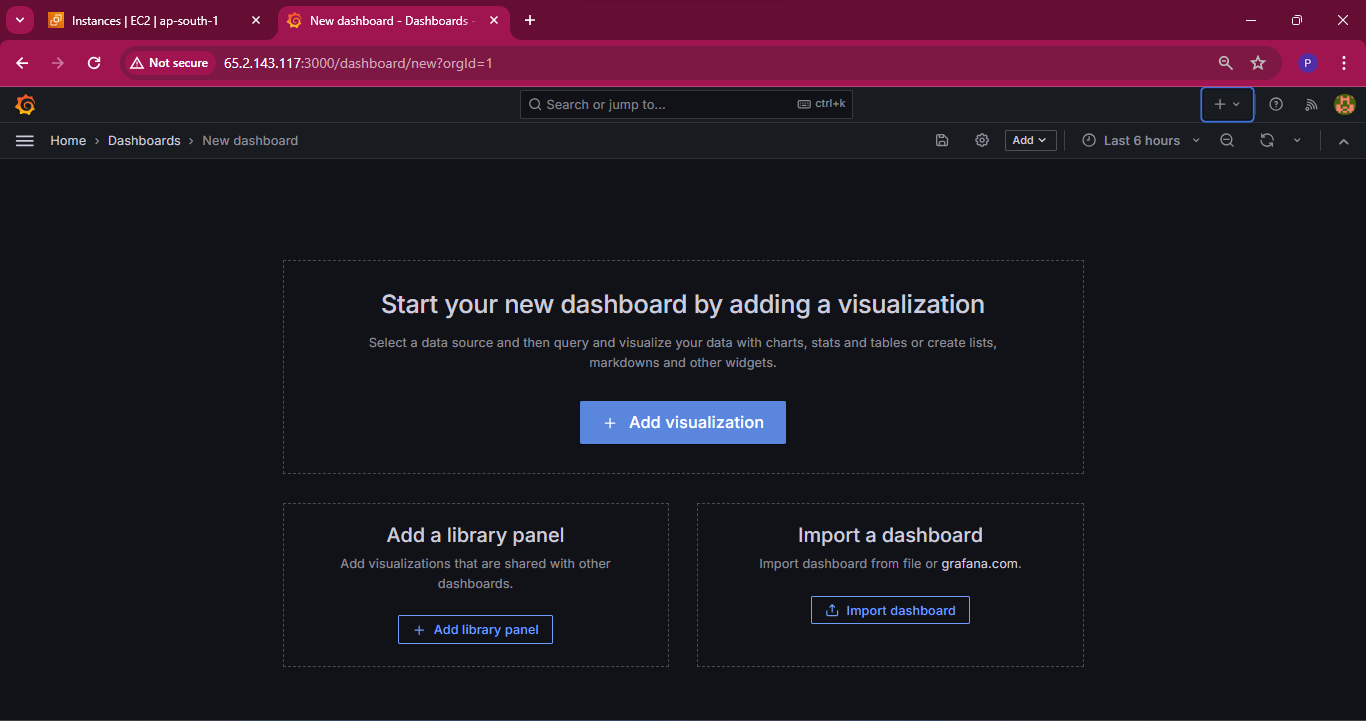
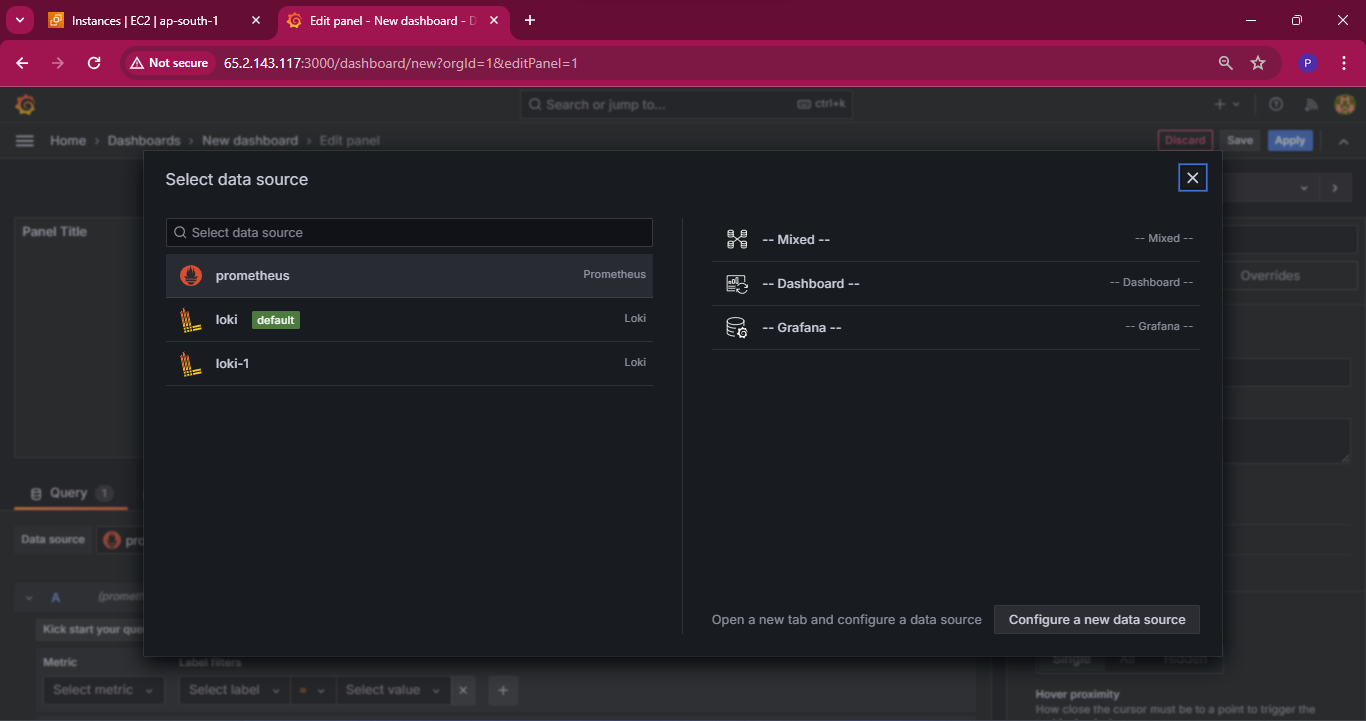
Click “Add visualization” and select Prometheus as your data source.
In the Query editor below the graph, enter the below query and then press Shift + Enter:
100 - (avg by(instance) (irate(node_cpu_seconds_total{mode="idle"}[5m])) * 100)
This query calculates the CPU usage percentage by subtracting the average idle CPU time (node_cpu_seconds_total) from 100.

In the Panel editor on the right, under Settings, change the panel title to “CPU Usage Percentage”.
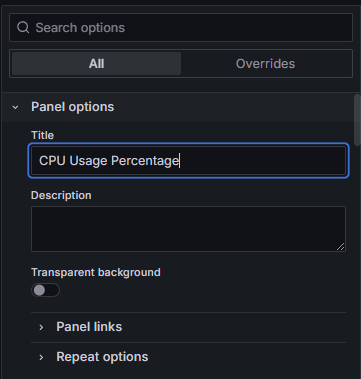
Click “Apply” in the top-right corner to save the panel and go back to the dashboard view.

Click the “Save dashboard” (disk) icon at the top of the dashboard to save your dashboard.

Enter a name in the Dashboard name field and then click Save.
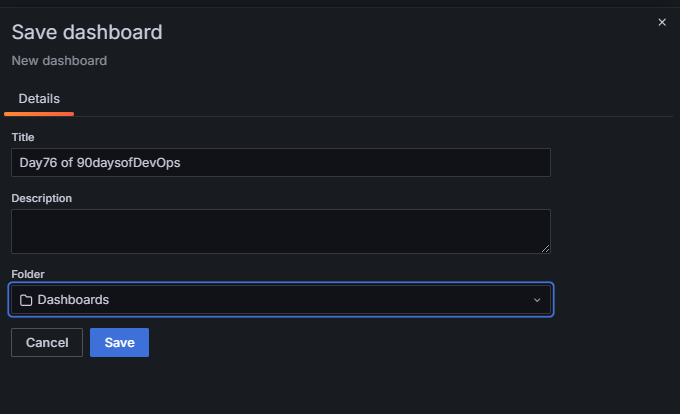
By following these steps, you've successfully created a Grafana dashboard with a panel that visualizes traffic metrics. This process can be repeated to add more panels, each with different queries and visualizations, allowing you to build a comprehensive view of your data. Grafana's flexible and powerful features make it an excellent tool for monitoring and analyzing your metrics, helping you make data-driven decisions with ease.
Explore further customization options in Grafana, such as different visualization types, alerting, and advanced query techniques, to make the most out of your dashboards. Happy dashboarding!
I'm confident that this article will prove to be valuable, helping you discover new insights and learn something enriching .
thank you : )
Subscribe to my newsletter
Read articles from Prathmesh Vibhute directly inside your inbox. Subscribe to the newsletter, and don't miss out.
Written by
