Day 77 : Grafana Cloud Alerting
 Prathmesh Vibhute
In the fast-paced world of modern IT, timely issue detection and resolution can make or break your operations. Grafana Cloud Alerting is a powerful tool designed to keep your systems running smoothly by notifying you of problems the moment they occur. This post will walk you through the basics of Grafana Cloud Alerting, including setting it up and creating a sample alert.
What is Grafana Cloud Alerting?
Grafana Cloud Alerting allows you to create, manage, and respond to alerts in a consolidated view, significantly enhancing your team’s ability to detect and resolve issues swiftly. It supports Grafana OSS, Grafana Enterprise, and Grafana Cloud, making it a versatile solution for various environments.
One of the standout features of Grafana Alerting is its integration with Mimir and Loki. These integrations allow you to run alert expressions closer to your data sources at a massive scale, all within the familiar Grafana UI. This proximity to data reduces latency and increases the efficiency of your alerting system.
Why Use Grafana Cloud Alerting?
1. Centralized Management
Grafana Cloud Alerting consolidates all your alerts into a single interface, making it easier to monitor and manage them. This centralized approach helps reduce the cognitive load on your team and ensures no alert goes unnoticed.
2. Scalability
With support for Mimir and Loki, Grafana Cloud Alerting can handle vast amounts of data and numerous alert rules. This scalability is crucial for large organizations that need to monitor extensive infrastructure.
3. Familiar Interface
If you are already using Grafana, you’ll find the alerting interface intuitive and easy to navigate. This familiarity reduces the learning curve and allows you to leverage the full potential of Grafana Alerting without significant additional training.
Setting Up Grafana Cloud Alerting
Let’s dive into the practical steps of setting up Grafana Cloud and configuring a sample alert.
Go to the link https://www.grafana.com/ and create an account.
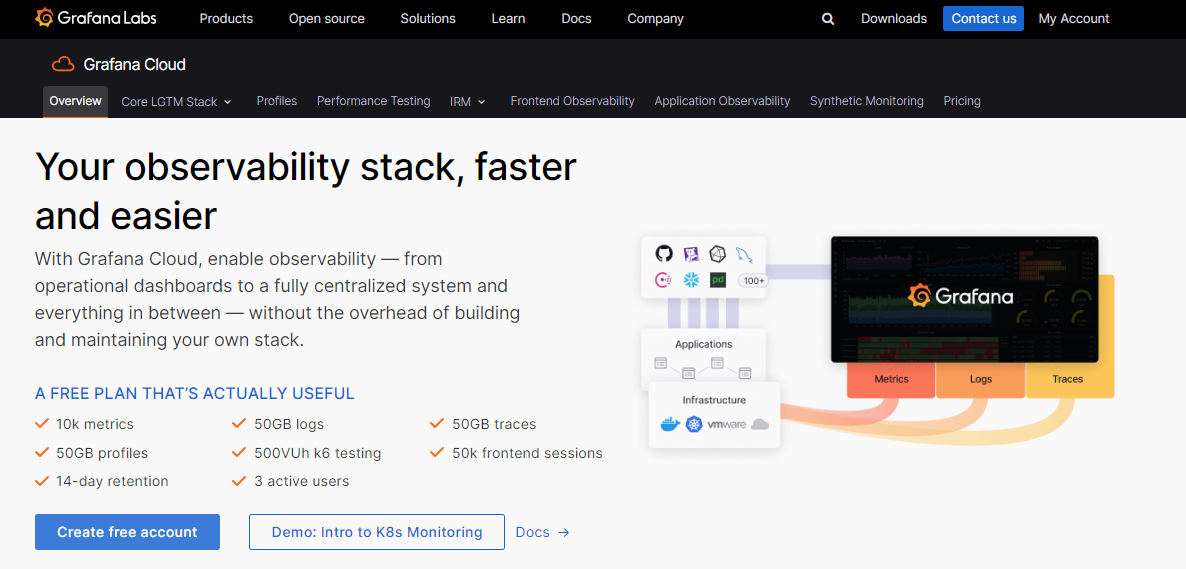
Follow the on-screen instructions to set up your Grafana Cloud account, including providing the necessary details and configuring preferences.
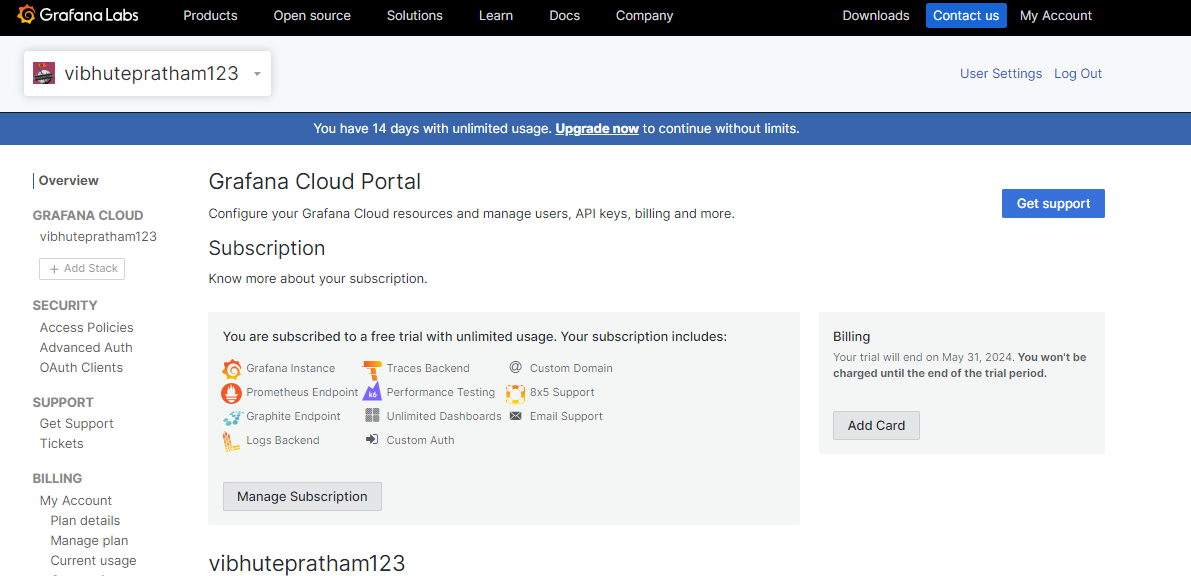
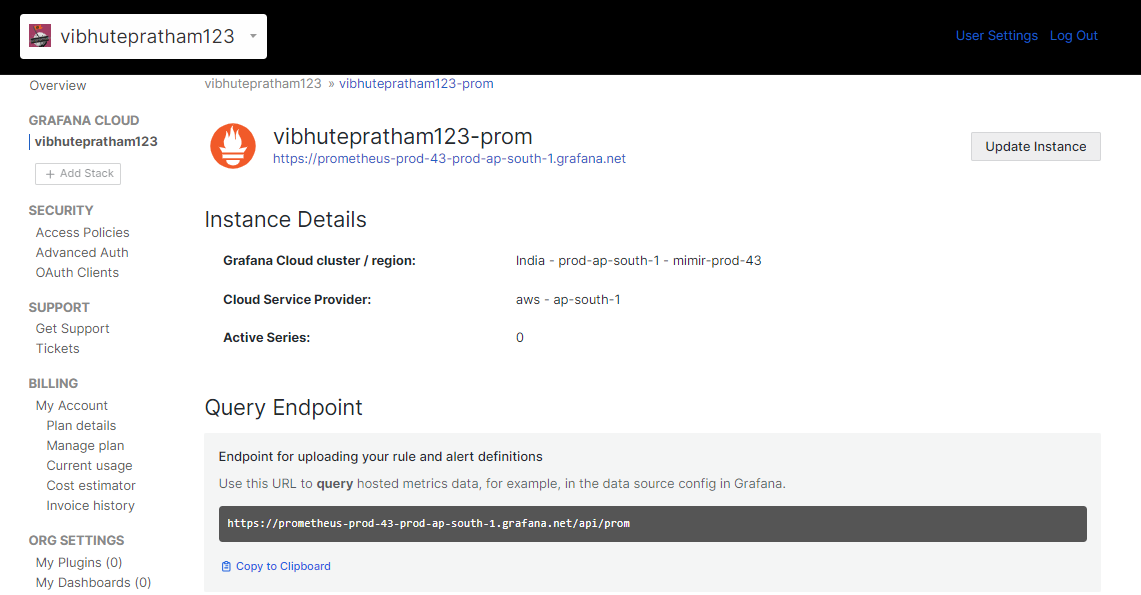
Scroll down until you see the Prometheus option and hit the ‘Send Metrics’ button.
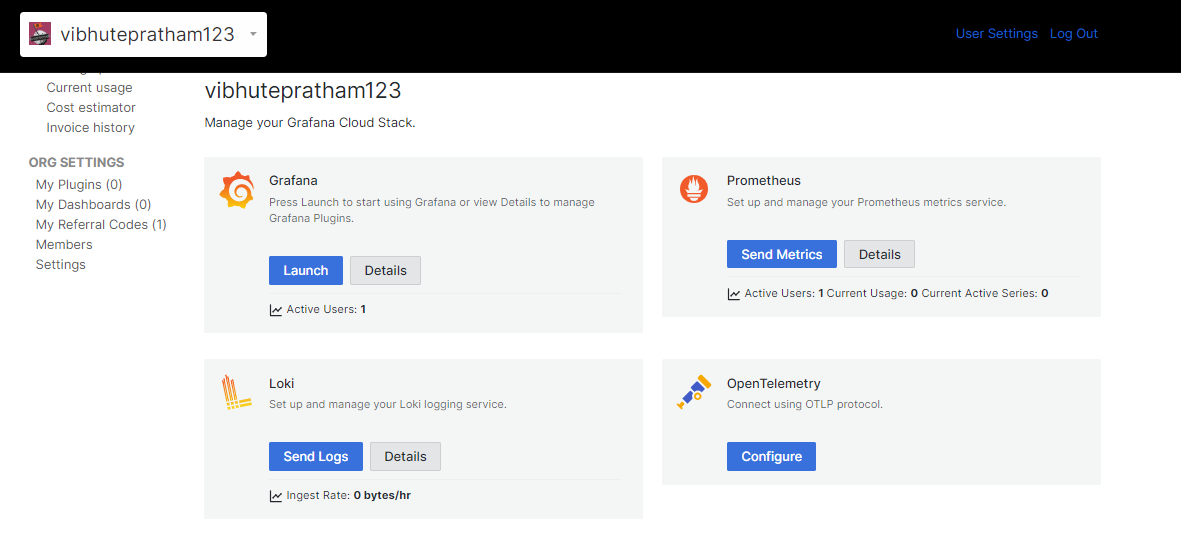
Follow the instructions on the screen to integrate your Prometheus Server with Grafana Cloud.
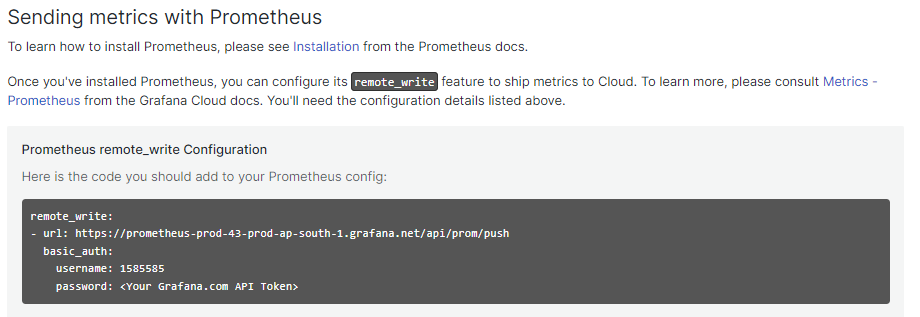
You will have to add the remote_write module to your existing prometheus.yml config file.
Once this is set up, we can import our preferred Grafana dashboard or create our own one and start monitoring our infrastructure.
Setup Sample Alerting
This step will be completed in Grafana OSS.
Log in to your Grafana dashboard.
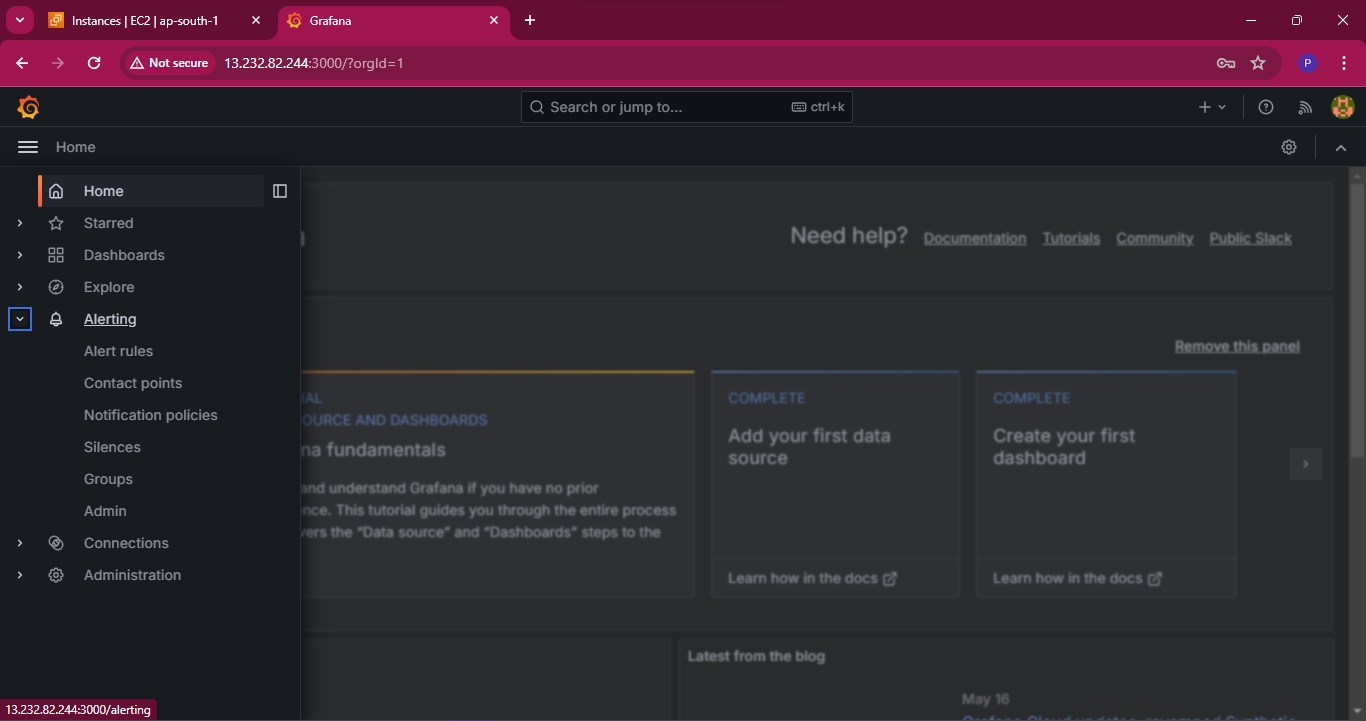
Click on “Alerting” in the left-hand sidebar to access the Alerting configuration.
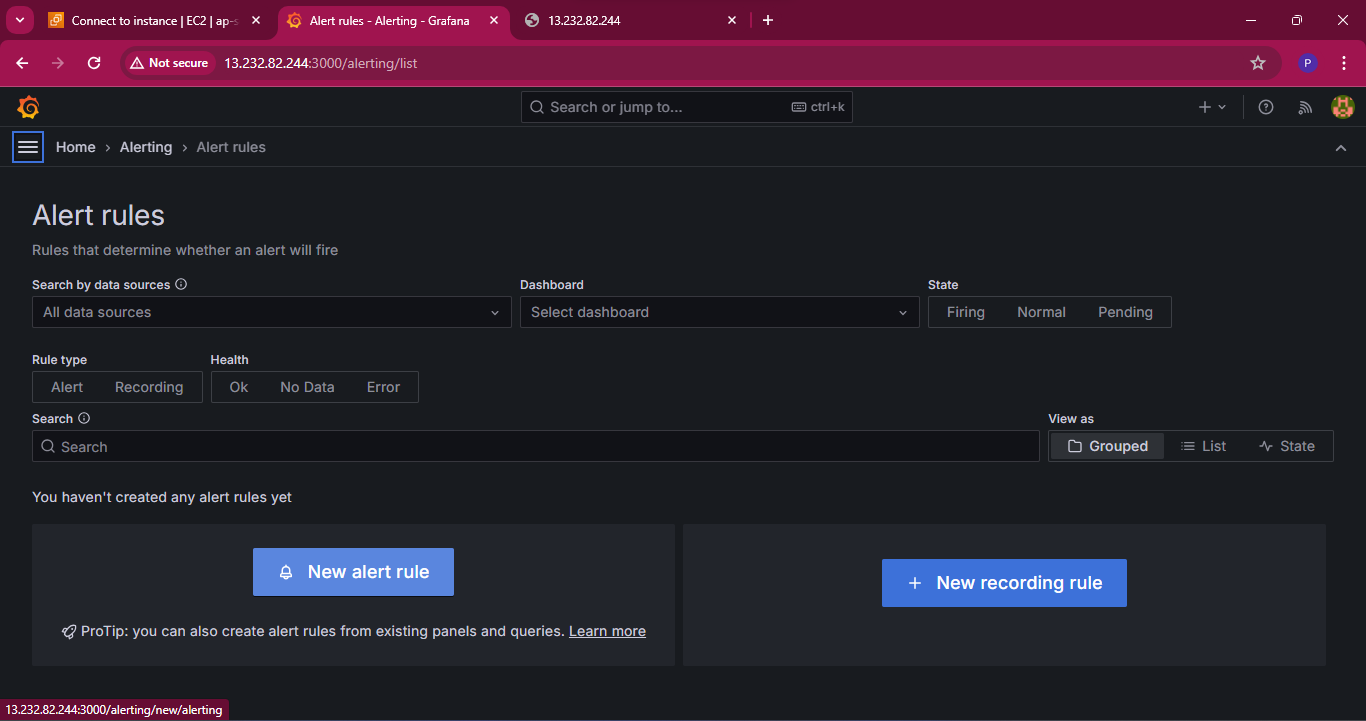
Click on “New alert Rule” to set up a new alerting rule.
Define the conditions for the alerting rule based on your data and requirements. Once done, save the Alert Rule.
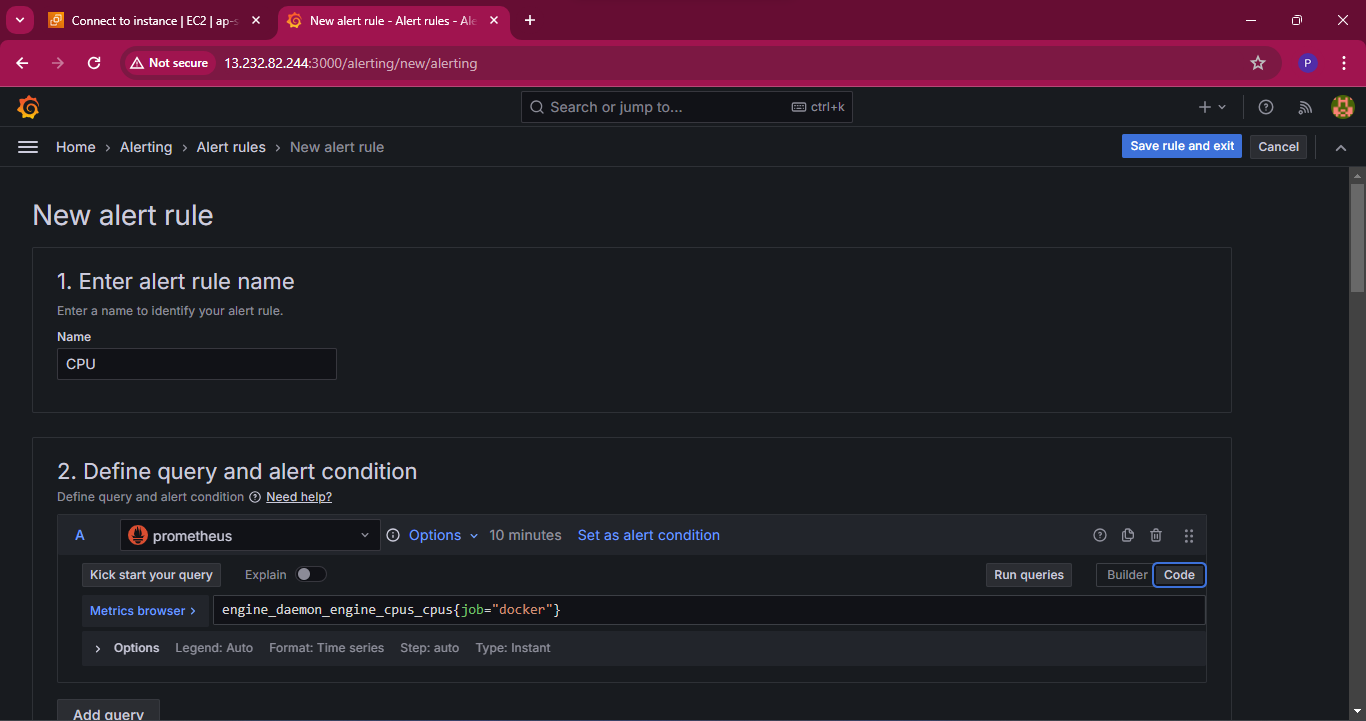
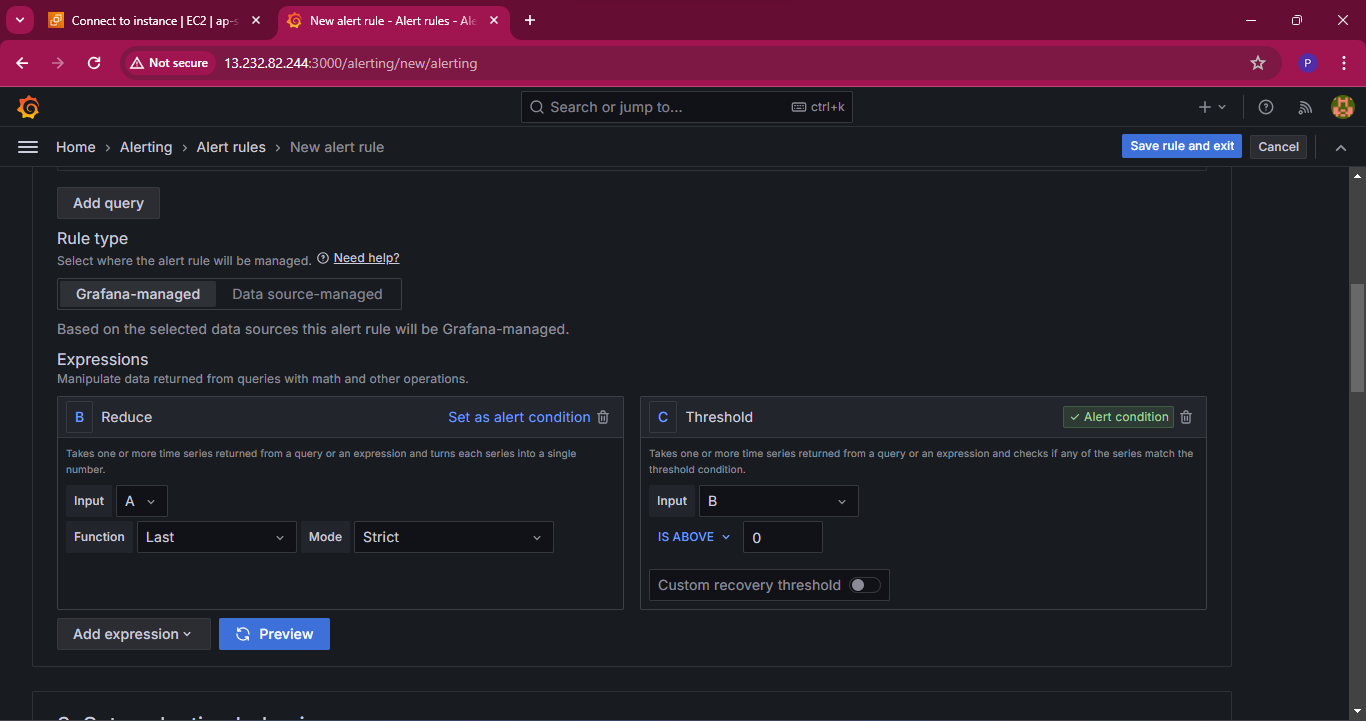
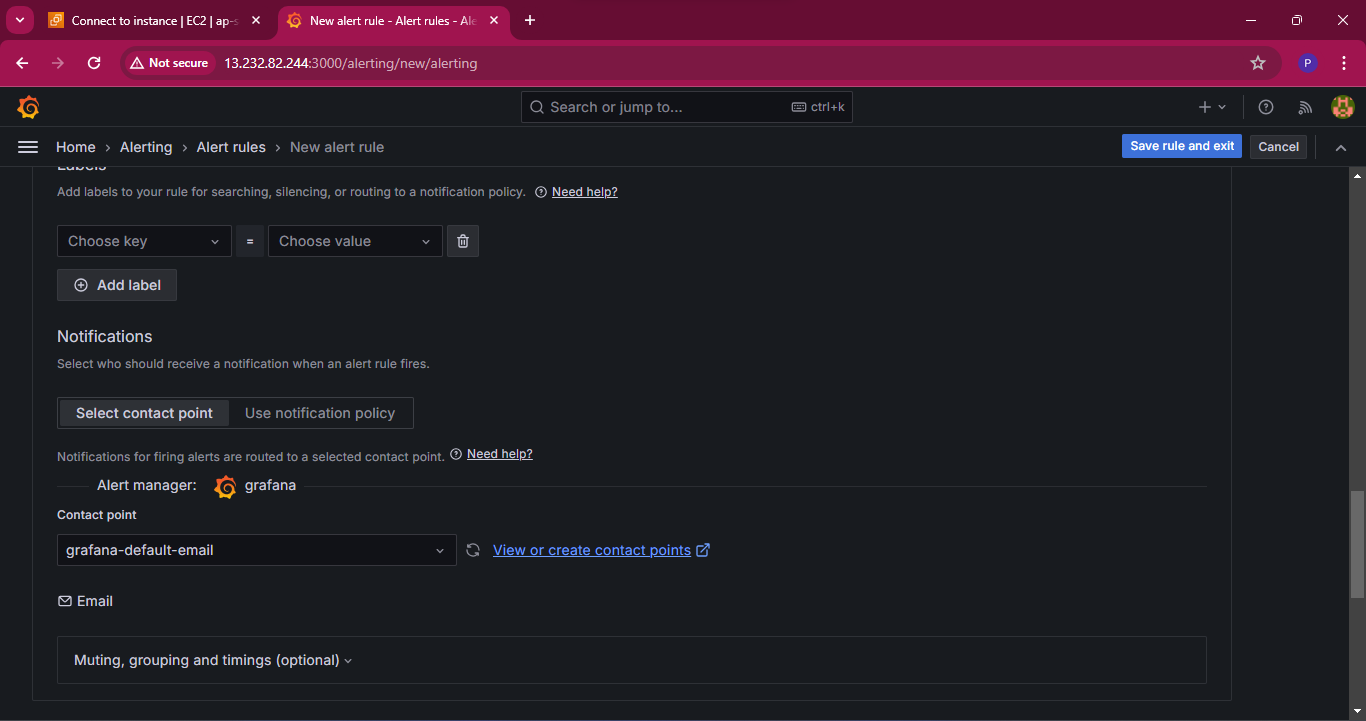
Select Contact Points to specify the notification channels, such as email, Slack, or other integrations, where alerts will be sent when triggered. In this case, I will use Slack. You can follow the steps from the Slack Official Documentation to send messages using Incoming Webhooks.
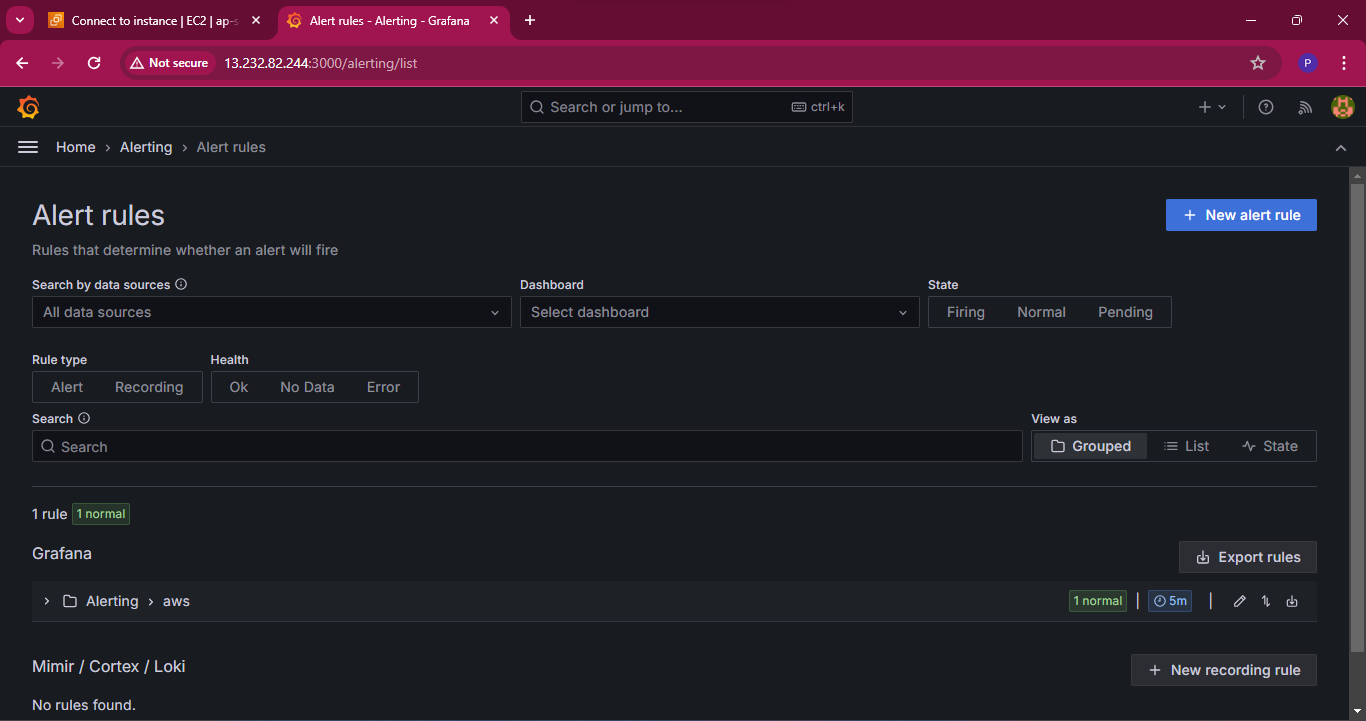
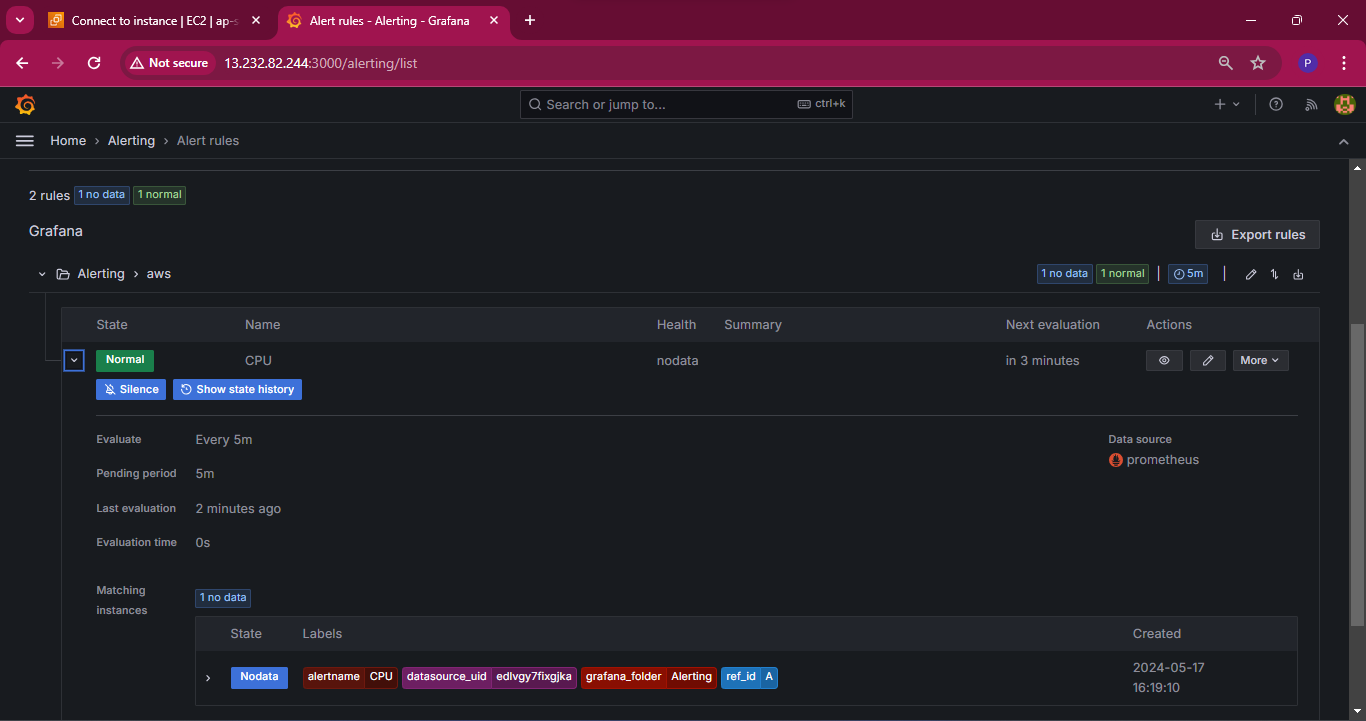
Our alert is now in a normal state as the CPU usage is not higher than 2% at the moment.
Let’s stress our system using the below commands and see if the alerting system works as expected.
sudo apt install stress stress --cpu 4
We can see how our alert rule is now on ‘Firing’ mode and has triggered and slack alert.
Conclusion
Grafana Cloud Alerting is a robust solution for proactive system monitoring and incident management. By setting up Grafana Cloud and configuring alerts, you can significantly enhance your team’s ability to detect and resolve issues promptly. Whether you are managing a small project or a large-scale enterprise infrastructure, Grafana Cloud Alerting scales to meet your needs, providing a familiar and powerful interface for all your monitoring needs.
Start leveraging the power of Grafana Cloud Alerting today to keep your systems running smoothly and your operations efficient.
I'm confident that this article will prove to be valuable, helping you discover new insights and learn something enriching .
thank you : )
Subscribe to my newsletter
Read articles from Prathmesh Vibhute directly inside your inbox. Subscribe to the newsletter, and don't miss out.
Written by
