Kubernetes Troubleshooting: Disk Pressure Taint
 Maxat Akbanov
In Kubernetes, a "taint" is a way to mark a node with a specific attribute that repels pods from being scheduled on it, unless those pods have a matching "toleration" for the taint. The term "disk pressure taint" refers to a specific condition where a node is experiencing low disk space. This taint is automatically added by Kubernetes to nodes that are nearing their storage capacity limits to prevent new pods from being scheduled on them, which helps in maintaining the node's performance and stability by avoiding additional strain on its disk resources.
This mechanism ensures that pods are scheduled on nodes with sufficient disk space, maintaining overall cluster health and performance. When disk space is freed or increased, the disk pressure condition may be resolved, and the taint can be removed, allowing pods to be scheduled on the node again.
Reasons
The disk pressure warning in Kubernetes signals that a node is running low on disk space or inode capacity. This condition can arise due to various factors, often related to resource usage and management within the cluster. Here are some common reasons for a disk pressure warning:
High Container Log Volume: Containers can generate substantial log output, especially if verbose logging is enabled. If not managed properly, these logs can fill up the node’s disk space.
Unused or Dangling Docker Images: Over time, Docker images and containers that are no longer in use can accumulate, especially if images are frequently updated. These unused images take up significant disk space.
Persistent Volume Claims (PVCs): Persistent volumes associated with PVCs can consume a large amount of disk space, particularly if many stateful applications are running within the cluster.
Evicted Pods: When pods are evicted due to resource constraints, their data might still reside on the node, consuming space. This is especially relevant if the pods were using ephemeral volumes or if the logs of these evicted pods are not cleaned up.
Node-Level Application Data: Applications might write data directly to the node’s filesystem, outside of what Kubernetes manages, which can accumulate over time.
Temporary Files: Applications or systems processes may create temporary files that aren’t cleaned up properly, leading to gradual space consumption.
System Logs and Backups: System operations, diagnostics, backups, and logs can take up significant space. These often grow over time unless log rotation and cleanup policies are in place.
Improper Resource Quotas: If resource quotas and limits aren’t set properly, a single namespace or application can end up using an undue portion of disk resources, leading to disk pressure.
To manage and mitigate these issues, administrators should implement monitoring and alerting for disk usage, enforce appropriate resource quotas, manage log lifecycles, and periodically clean up unused images and volumes. This proactive management helps maintain node health and prevents disruptions due to disk pressure.
Collecting Information About Disk Pressure
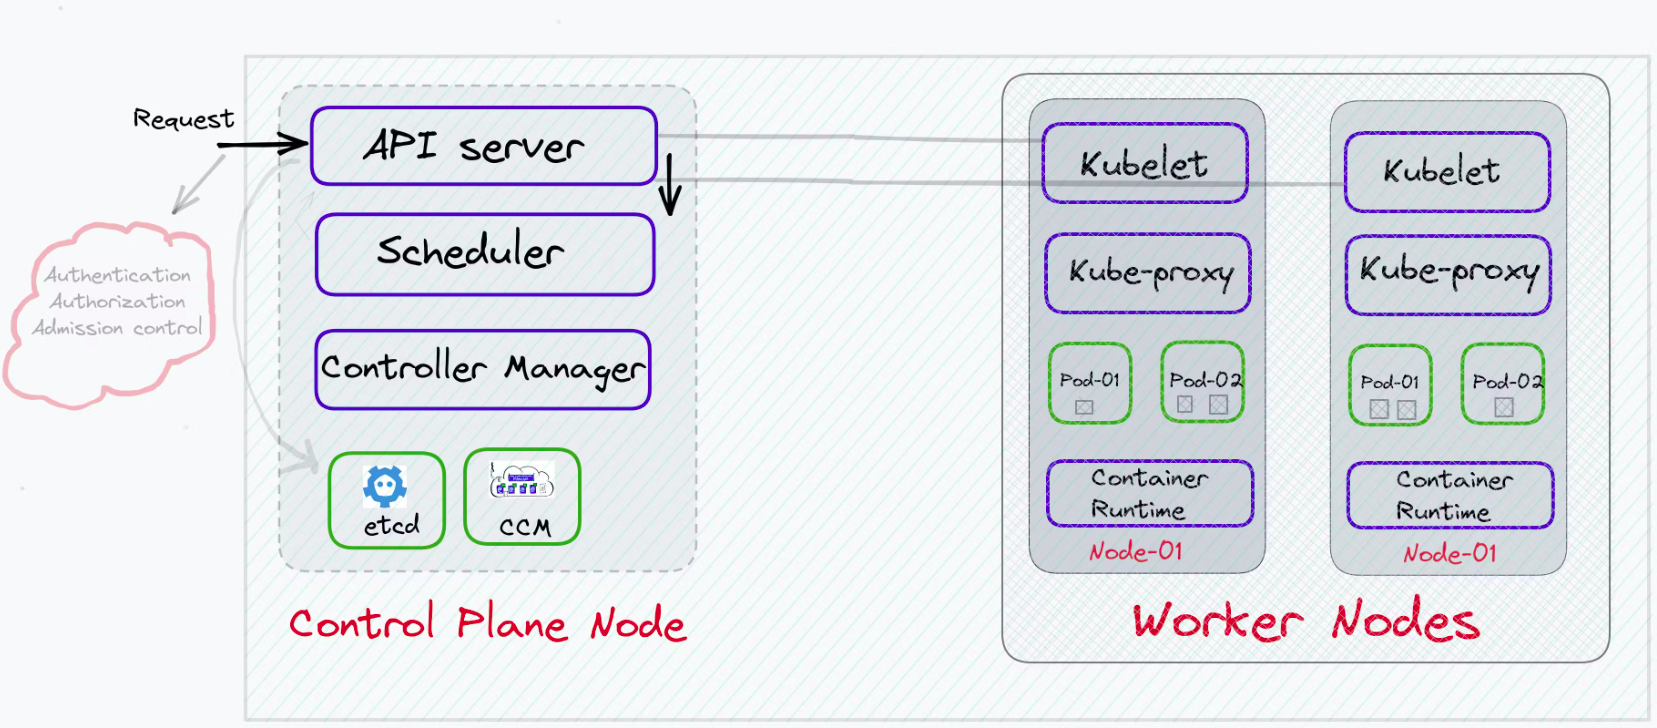
Kubernetes monitors and manages the state of nodes through a component called the kubelet, which runs on each node in the cluster. The kubelet is responsible for a variety of node management tasks, including monitoring the health and resource status of the node it runs on.

Image credits: kubesimplify
Here’s how kubelet specifically handles disk space and detects disk pressure:
Resource Metrics: The kubelet collects metrics about the node's resources, including CPU, memory, and disk utilization. For disk resources, it monitors the filesystem that houses the node's Docker images and container writable layers, as well as the filesystem used for the node’s main processes.
Thresholds and Conditions: Administrators can set thresholds for what constitutes disk pressure in terms of available disk space and inode counts. These thresholds are part of the kubelet's configuration. When the disk usage exceeds these thresholds, the kubelet identifies this as a disk pressure condition.
Node Status: If the kubelet detects that disk usage exceeds the configured thresholds, it updates the node's status to reflect that it is under disk pressure. This status update includes adding a taint to the node that prevents new pods from being scheduled unless they tolerate this taint.
Reporting: The kubelet regularly reports the node status, including any resource pressure conditions, back to the Kubernetes API server. This information is then used by the scheduler and other control plane components to make decisions about pod placement and cluster management.
Automatic Eviction: In some cases, if the disk pressure persists, the kubelet may start to evict pods to free up disk space, prioritizing the eviction based on factors such as the quality of service (QoS) class of the pods.
This proactive monitoring and management help maintain the stability and performance of the Kubernetes cluster by ensuring nodes operate within their resource limits.
Get Information about Disk Pressure
To find out which node in a Kubernetes cluster is affected by disk pressure, you can use the kubectl command-line tool to inspect the nodes' status. Here's how you can identify nodes with disk pressure:
List Node Conditions: You can list all nodes along with their conditions by running:
kubectl get nodes -o wideHowever, for more detailed information about the conditions affecting each node, including disk pressure, you can use:
kubectl get nodes -o jsonpath="{.items[*].status.conditions}"This command displays all conditions for each node. Look for conditions where the
typeisDiskPressureand thestatusisTrue.Specifically Check for Disk Pressure: To filter and show only nodes under disk pressure, you can use a more refined command:
kubectl get nodes -o jsonpath="{.items[?(@.status.conditions[?(@.type=='DiskPressure' && @.status=='True')])].metadata.name}"This command will output the names of nodes where the disk pressure condition is currently
True.Describe Nodes: For a more verbose and comprehensive look at a particular node’s status, including events and conditions like disk pressure, you can use the describe command:
kubectl describe node <node-name>Replace
<node-name>with the name of the node you want to inspect. The output will include all conditions, events, and other details specific to that node, helping you understand why disk pressure is being reported.
These commands help you identify and diagnose nodes experiencing disk pressure, allowing you to take appropriate actions such as cleaning up disk space or adjusting resource allocations.
Clean-up Disk Space on the Node
Cleaning up disk space on a Kubernetes node involves several strategies, depending on what's consuming the space. Here are some common approaches:
Prune Unused Docker Images and Containers: Over time, Docker can accumulate unused images and containers, which can consume considerable disk space. Use the following Docker commands to clean them up:
docker system prune -aThis command removes all unused containers, networks, images (both dangling and unreferenced), and optionally, volumes.
❗It's a good practice to ensure that you do not need the data in these containers or images before running this command.Clear Kubernetes Evicted Pods: Sometimes, when a node is under resource pressure, Kubernetes may evict pods but their metadata might still remain. You can clear evicted pods with:
kubectl get pods --all-namespaces -o json | jq '.items[] | select(.status.phase == "Failed") | "kubectl delete pods \(.metadata.name) --namespace \(.metadata.namespace)"' | xargs -n 1 bash -cClean Up Node Filesystem:
Logs: System and application logs can consume significant disk space. You might want to clean or rotate logs managed under
/var/log/, or set up a log rotation policy if not already in place.Temporary Files: The
/tmpdirectory often contains temporary files which might not be necessary. Consider deleting older or unnecessary files.Orphaned Volumes: Check for any orphaned volumes in
/var/lib/kubelet/pods/and remove them if they are no longer linked to existing pods.
Manage Persistent Volume Claims (PVCs): Review persistent volume claims and their associated volumes. Sometimes, unused or old PVCs can be deleted to free up space. Use:
kubectl get pvc --all-namespacesto list all PVCs. Review and delete any that are unnecessary.
Use a Resource Quota: To avoid future disk space issues, consider setting resource quotas and limits for namespaces to better manage the space used by each project or team.
Node Monitoring and Alerts: Implement monitoring and alerting for disk usage to proactively manage disk space and prevent nodes from hitting disk pressure.
How to Check the Log File Sizes for Docker and Podman on Nodes
When investigating disk pressure in a Kubernetes cluster and you suspect that logs from container runtimes like Docker and Podman are consuming a significant amount of disk space, you can check the log sizes directly on the nodes. Here’s how to do it for both Docker and Podman:
For Docker
Docker typically stores its logs in the container's directory under /var/lib/docker/containers/. Each container has its own directory here, containing log files. To find out the size of these logs:
SSH into the Node: Log into the node where Docker is running.
Run a Command to Summarize Log Sizes: Use the following command to find the total size of all log files:
sudo du -sh /var/lib/docker/containers/*/*-json.logThis command sums up the sizes of all Docker log files. It can be helpful to run this on each node to determine where the largest log files are.
For Podman
Podman stores its logs under /var/lib/containers/storage/overlay-containers/ in each container's directory. Similar to Docker, you can inspect the sizes of these logs:
SSH into the Node: Access the node where Podman containers are running.
Run a Command to Summarize Log Sizes: Execute the following to find out how much space the log files are using:
sudo du -sh /var/lib/containers/storage/overlay-containers/*/userdata/ctr.logThis will display the sizes of all Podman container log files.
References:
Subscribe to my newsletter
Read articles from Maxat Akbanov directly inside your inbox. Subscribe to the newsletter, and don't miss out.
Written by

Maxat Akbanov
Maxat Akbanov
Hey, I'm a postgraduate in Cyber Security with practical experience in Software Engineering and DevOps Operations. The top player on TryHackMe platform, multilingual speaker (Kazakh, Russian, English, Spanish, and Turkish), curios person, bookworm, geek, sports lover, and just a good guy to speak with!