DevSecOps :- Project of Netflix Clone with CI/CD Jenkins Pipeline on Docker Container with Monitoring..
 Shesh Dhar
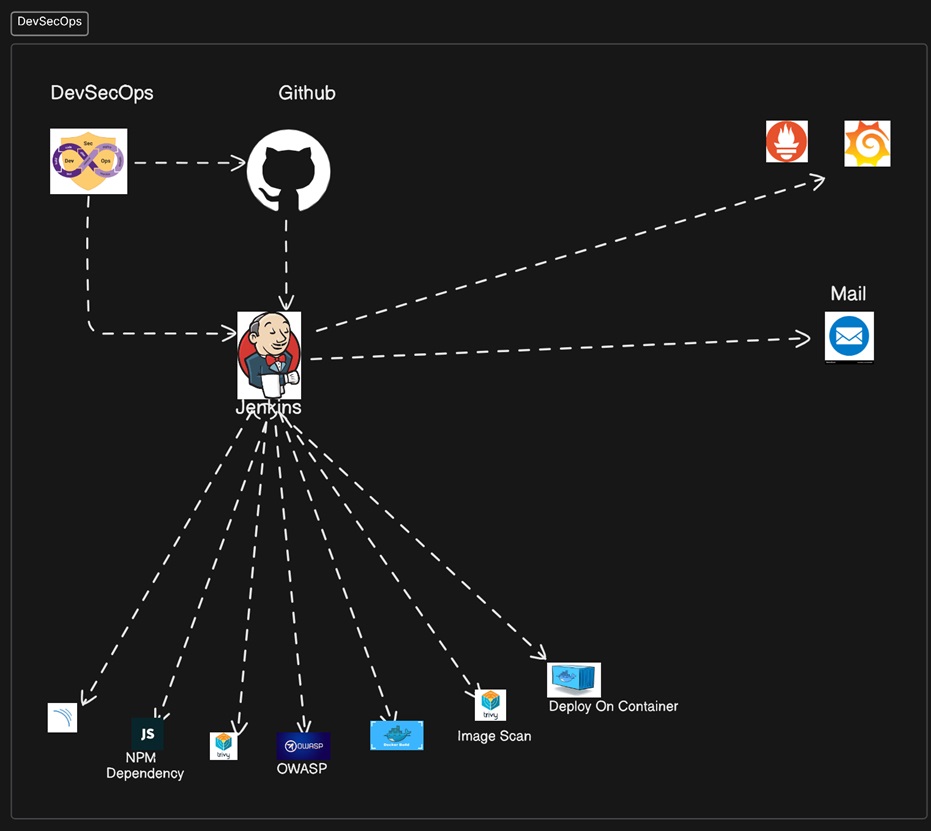
Project Synopsis:
Here we will be using Jenkins as CI/CD Pipeline tool and deploying our applications on a Docker container and would be monitor Jenkins pipeline with Prometheus, Grafana and Node exporter tool.
Project Footsteps.
Create an Ubuntu OS machine.
Install Docker, Jenkins, Trivy and Sonarqube with the help of Docker container.
Create API key on https://www.themoviedb.org/
Create another Ubuntu machine and install Prometheus an Grafana on this server.
Install the Plugins on Prometheus server and integrate it with the Prometheus server.
Configure the email integration with Jenkins.
Install other required plugins link Sonarqube Scanner, JDK, NodeJS, and OWASP Dependency check.
Go to Jenkins server and create a Pipeline project in Jenkins.
Configure OWASP Dependency installation.
Build and Push Docker image.
Deploy the image using Docker.
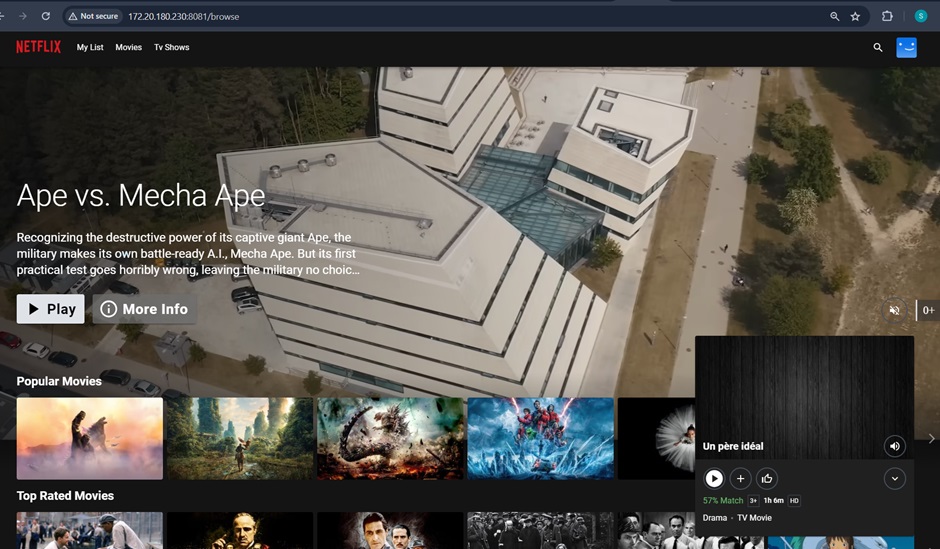
Access the Deployed app Netflix on the browser with port no. 8081.
After access done, Terminate the AWS EC2 Instances if you have deployed the App on AWS.
Step:-1
Create a shell script file name Jenkins.sh on Jenkins server to install the Jenkins.
#!/bin/bash
/sudo apt update -y
sudo apt upgrade -y
wget -O - https://packages.adoptium.net/artifactory/api/gpg/key/public | tee /etc/apt/keyrings/adoptium.asc
echo "deb [signed-by=/etc/apt/keyrings/adoptium.asc] https://packages.adoptium.net/artifactory/deb $(awk -F= '/^VERSION_CODENAME/{print$2}' /etc/os-release) main" | tee /etc/apt/sources.list.d/adoptium.list
sudo apt update -y
sudo apt install temurin-17-jdk -y /usr/bin/java --version
sudo url -fsSL https://pkg.jenkins.io/debian-stable/jenkins.io-2023.key | sudo tee \ /usr/share/keyrings/jenkins-keyring.asc > /dev/null
sudo echo deb [signed-by=/usr/share/keyrings/jenkins-keyring.asc] \ https://pkg.jenkins.io/debian-stable binary/ | sudo tee \ /etc/apt/sources.list.d/jenkins.list > /dev/null
sudo apt-get update -y
sudo apt-get install jenkins -y
sudo systemctl start jenkins
sudo systemctl status Jenkins
Step :-2 Assign the Permission to the Jenkin.sh file : ( sudo chmod 777 jenkins.sh )
Step3:- Run the Jenkins file ./Jenkins.sh
Step4:- Now Open the Jenkins server IP address with port number 8080 on any browser and unlock the Jenkins server with the given instruction on the screen.
Step:-5 Now we need to install the Docker on Jenkins server with the command given below.
sudo apt-get update
sudo apt-get install docker.io -y
sudo usermod -aG docker $USER
newgrp docker
sudo chmod 777 /var/run/docker.sock #Provide the access of docker.sock to the user.
Step:-6 Now we need to install the sonarqube
Run the Docker command.
docker run -d --name sonar -p 9000:9000 sonarqube:lts-community
Step:-7 Now Open the Jenkins server IP address with port number 9000 on any browser and you will get SonarQube is running. Use the user id and password admin to login first time.
Step:-8 Now we have to create the token in SonarQube. Go to Administration>>Security>>User and click on token 3 dot and generate token. Please copy that token and keep safe.
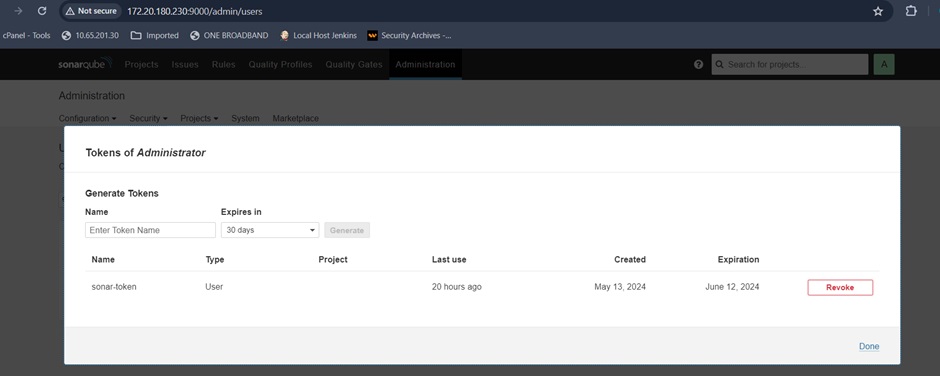
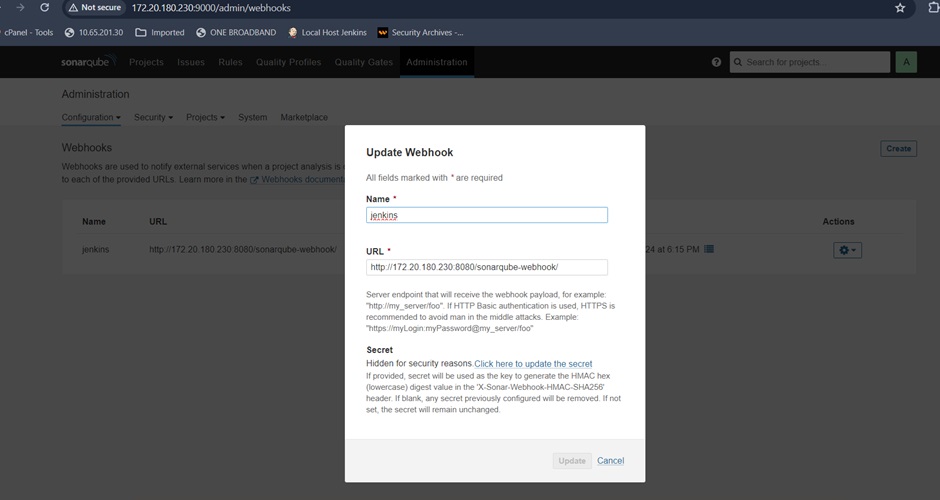
Step:-9 Create the Webhook in SonarQube to communicate with Jenkins server.
Go to Administration>>Configuration>>webhooks. Here in name enter the jenkins and in URL enter the Jenkins server URL.
Step:-10. Now go-to https://www.themoviedb.org/ and go to user profile settings>>API>>create API.
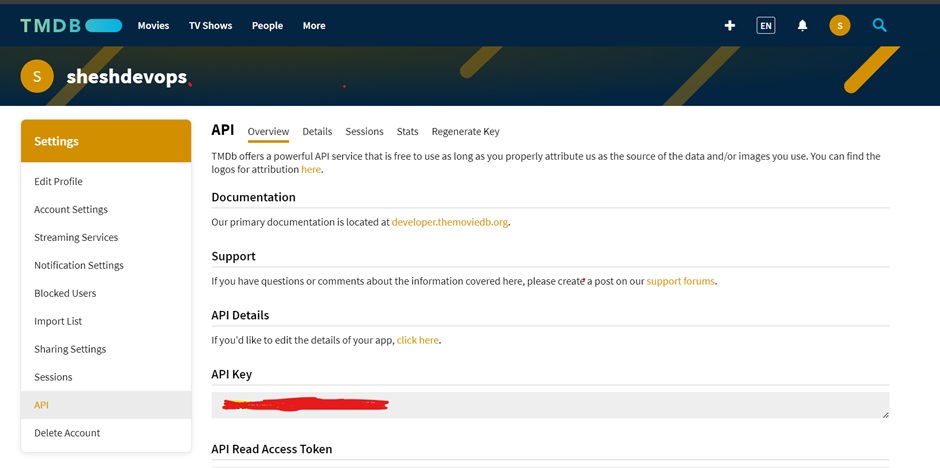
Keep the API key safe.
Step:-11 Now create another Ubuntu Machine for Prometheus & Grafana server purpose.
And Install the Prometheus and Grafana tools.
sudo apt-get update
Download the prometheus config file
wget https://raw.githubusercontent.com/prometheus/prometheus/main/documentation/examples/prometheus.yml
Now create a .yml file to run the docker-compose
sudo vim docker-compose.yml
Add the below mentioned shell script in docker.compose.yml file.
version: '3.2'
services:
prometheus:
image: prom/prometheus:latest
container_name: prometheus
ports:
9090:9090
command:
--config.file=/etc/prometheus/prometheus.yml
volumes:
./prometheus.yml:/etc/prometheus/prometheus.yml:ro
depends_on:
cadvisor
cadvisor:
image: gcr.io/cadvisor/cadvisor:latest
container_name: cadvisor
ports:
8080:8080
volumes:
/:/rootfs:ro
/var/run:/var/run:rw
/sys:/sys:ro
/var/lib/docker/:/var/lib/docker:ro
depends_on:
- redis
redis:
image: redis:latest
container_name: redis
ports:
- 6379:6379
Now Run the below mentioned command
docker-compose up -d
docker-compose ps
Step:-12. Copy the Prometheus server IP and open on browser with port No. 9090.

Now we will Install Grafana…
sudo apt-get install -y apt-transport-https
sudo apt-get install -y software-properties-common wget
sudo wget -q -O /usr/share/keyrings/grafana.key https://apt.grafana.com/gpg.key
sudo echo "deb [signed-by=/usr/share/keyrings/grafana.key]
https://apt.grafana.com stable main" | sudo tee -a
/etc/apt/sources.list.d/grafana.list
Sudo apt-get update
Sudo apt-get install Grafana
Sudo systemctl status Grafana-server
Sudo systemctl start Grafana-server
Now Copy the Prometheus server IP and open on browser with port no. 3000 to open the Grafana.

Step:-13 -Download Node exporter.
Now extract the Node exporter file from below command.
tar -xvf node_exporter-1.8.0.linux-amd64.tar.gz
Step:-14- Move the node exporter file
sudo mv \ node_exporter-1.8.0.linux-amd64/node_exporter \ /usr/local/bin/
Now after moving the node exporter file delete the tar file.
rm -rf node_exporter*
Step:-15 Create a systemd unit configuration file for Node Exporter:
sudo vim /etc/systemd/system/node_exporter.service
Add the following content to the node_exporter.service file:
[Unit]
Description=Node Exporter
Wants=network-online.target
After=network-online.target
StartLimitIntervalSec=500
StartLimitBurst=5
[Service]
User=node_exporter
Group=node_exporter
Type=simple
Restart=on-failure
RestartSec=5s
ExecStart=/usr/local/bin/node_exporter --collector.logind
[Install]
WantedBy=multi-user.target
Step 16 :- Start the node exporter service
sudo systemctl enable node_exporter
sudo systemctl start node_exporter
Step 17 :- Now Add the node exporter job in Prometheus.yml file
sudo vim /etc/prometheus/prometheus.yml
Step:-18. Add the node exporter job with port no. 9100 in Prometheus.yaml file.
- job_name: node_export
static_configs:
- targets: ["localhost:9100"]
Step:-19. Start and reload the service now.
promtool check config /etc/prometheus/prometheus.yml
curl -X POST http://localhost:9090/-/reload
Step:-20 Go to Prometheus then click targets you will see the node exporter job is up.
Step 21:- Open the Prometheus server IP with Port No.3000 you will get Grafana page. And go to data sources add data source.

Step 22 :- And Click on Prometheus and add the Prometheus URL and click on save test.
Step 23 :- Click on new and click on Import dashboard.
Step 24 :- Enter dashboard ID1860 and click on load. Now you will get the monitoring page of node exporter.
Step 25 :- Go to Jenkins and download Prometheus plugins.
Step 26 : -Add the Jenkins job in Prometheus.yaml file.
sudo vim /etc/prometheus/prometheus.yml #on Prometheus server
Add below mentioned job details in Prometheus.yml file
- job_name: 'jenkins'
metrics_path: '/prometheus'
static_configs:
- targets: ['<jenkins-ip>:8080']
Step 27 -: Go to Prometheus server and navigate Prometheus/Status/target you will get Jenkins up.
Step 28 :- Click on Import dashboard and enter dashboard ID 9964 and click load.
Step 29 -: Now you can see the dashboard of Jenkins on Grafana dashboard.
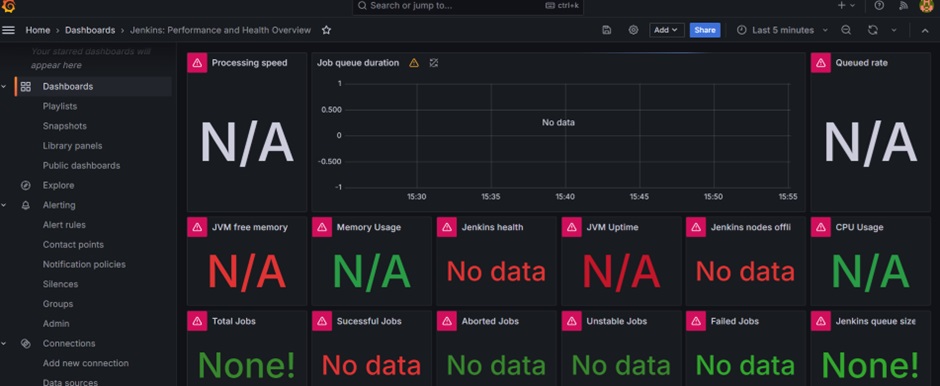
Step 30:- Download the email plugin in Jenkins.
Click to Manage Jenkins>>Available plugins install Email plugin –
Step 31:- Now Go to Manage Jenkins>>System and configure email notification as per Below.
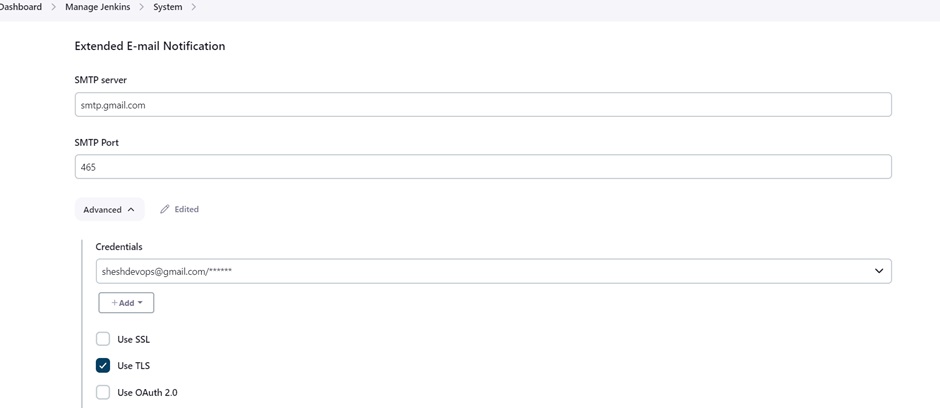
Step 32-: Download plugins like Eclipse Temurin Installer, Sonarqube scanner, Nodejs, OWASP Dependency check and Docker all plugins.
Step 33:- Add the sonar server info in Jenkins tools.

Step:-34 Add the Jdk Installation details in Jenkins tool.
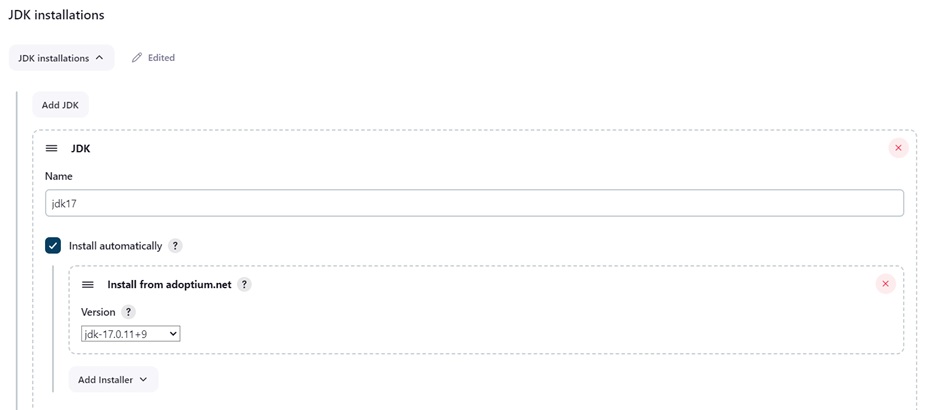
Step:-35 Add the nodejs Installation details in Jenkins tool.
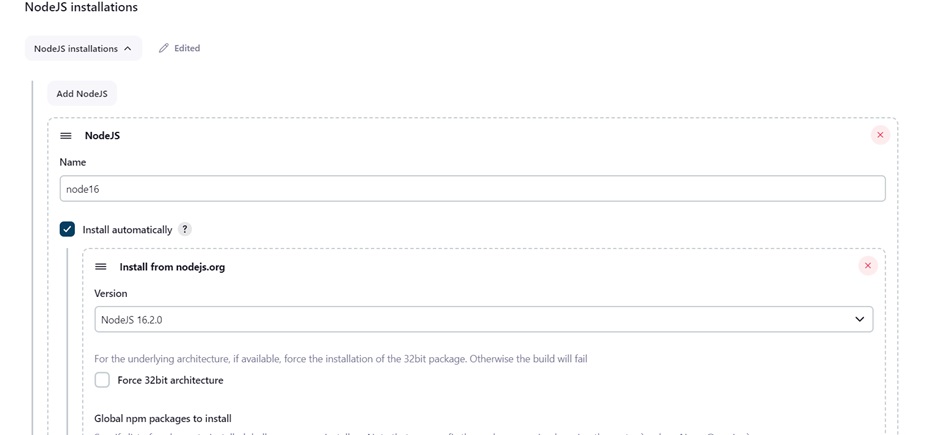
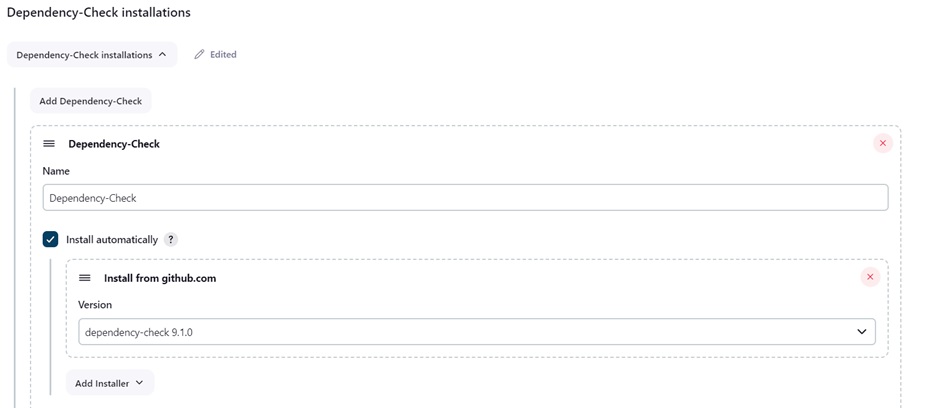
Step:- 36 Add the Dependency check Installation details in Jenkins tool.
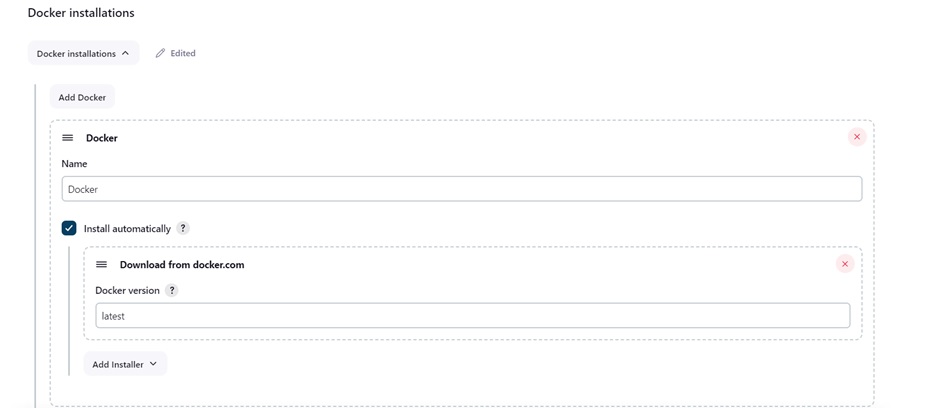
Step:- 37 Add the Docker Installation details in Jenkins tool.
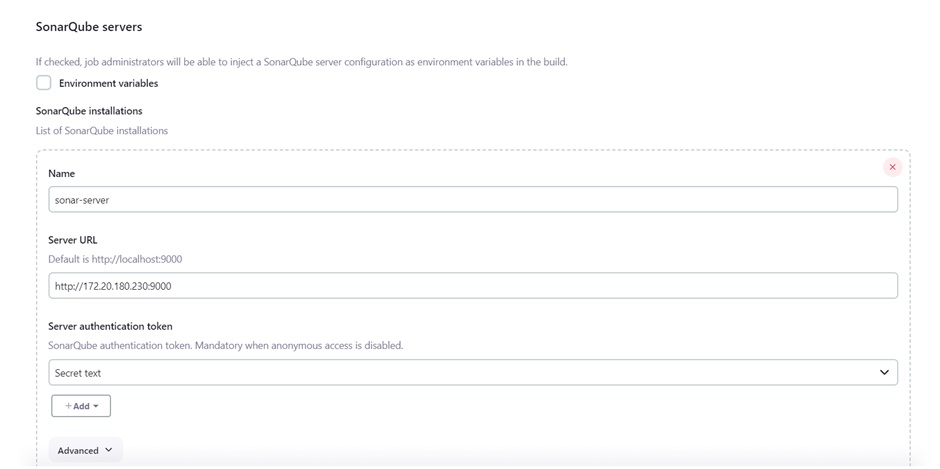
Step:-38 Go to Mange Jenkins>>System and add SonarQube server details.
Step:- 39 Now we need to install Trivy by shell script on Prometheus server.
Vi trivy.sh
#!/bin/bash
sudo apt-get install
wget apt-transport-https gnupg lsb-release -y
wget -qO - https://aquasecurity.github.io/trivy-repo/deb/public.key | gpg --dearmor | sudo tee /usr/share/keyrings/trivy.gpg > /dev/null
echo "deb [signed-by=/usr/share/keyrings/trivy.gpg] https://aquasecurity.github.io/trivy-repo/deb $(lsb_release -sc) main" | sudo tee -a /etc/apt/sources.list.d/trivy.list
sudo apt-get update
sudo apt-get install trivy -y
Now give the permission to Trivy.sh file to run.
sudo chmod 777 trivy.sh
And now Run the ./trivy.sh
Step:40- Now go to Jenkins and create a pipeline for Netflix clone project.
Now add the script in the pipeline.
pipeline{
agent any
tools{
jdk 'jdk17'
nodejs 'node16'
}
environment {
SCANNER_HOME=tool 'sonar-scanner'
}
stages {
stage('clean workspace'){
steps{
cleanWs()
}
}
stage('Checkout from Git'){
steps{
git branch: 'main', url: 'https://github.com/sheshdhar3/Netflix-clone.git'
}
}
stage("Sonarqube Analysis "){
steps{
withSonarQubeEnv('sonar-server') {
sh ''' $SCANNER_HOME/bin/sonar-scanner -Dsonar.projectName=Netflix \
-Dsonar.projectKey=Netflix '''
}
}
}
stage("quality gate"){
steps {
script {
waitForQualityGate abortPipeline: false, credentialsId: SonarQube token
}
}
}
stage('Install Dependencies') {
steps {
sh "npm install"
}
}
stage("OWASP"){
steps{
dependencyCheck additionalArguments: '--scan ./', odcInstallation: 'Dependency-Check'
dependencyCheckPublisher pattern: '**/dependency-check-report.xml'
}
}
stage('TRIVY FS SCAN') {
steps {
sh "trivy fs . > trivyfs.txt"
}
}
stage("Docker Build & Push"){
steps{
script{ withCredentials([usernamePassword(credentialsId:"DockerHubCreds",passwordVariable:"dockerPass",usernameVariable:"dockerUser")]){
sh "docker login -u ${env.dockerUser} -p ${env.dockerPass}"
sh "docker build --build-arg TMDB_V3_API_KEY=API_Key Here -t netflix ."
sh "docker tag netflix sheshdhar3/netflix:latest "
sh "docker push sheshdhar3/netflix:latest "
}
}
}
}
stage("TRIVY"){
steps{
sh "trivy image sheshdhar3/netflix:latest > trivyimage.txt"
}
}
stage('Deploy to container'){
steps{
sh 'docker run -d --name netflix -p 8081:80 sheshdhar3/netflix:latest'
}
}
}
post {
always {
emailext attachLog: true,
subject: "'${currentBuild.result}'",
body: "Project: ${env.JOB_NAME}<br/>" +
"Build Number: ${env.BUILD_NUMBER}<br/>" +
"URL: ${env.BUILD_URL}<br/>",
to: 'sheshdevops@gmail.com',
attachmentsPattern: 'trivyfs.txt'
}
}
}
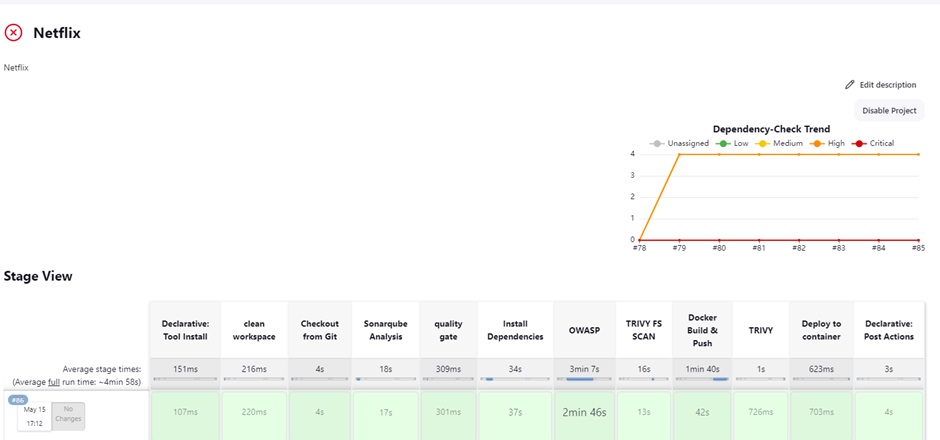
Step:-41 Run the created pipeline.
Created Pipeline run successfully.
Step 42- : Copy the IP address of Jenkins server with Port No. 8081 and you will get the Netflix page successfully.
Subscribe to my newsletter
Read articles from Shesh Dhar directly inside your inbox. Subscribe to the newsletter, and don't miss out.
Written by
