How to Query in SQL, Import to Excel for Visualization, and Copy to PowerPoint
 Neibo Augustine
In today's data-driven world, the ability to extract, visualize, and present data effectively is a crucial skill. Recently, I completed a project that involved querying data in SQL, importing it into Excel for visualization, and then creating a PowerPoint presentation to showcase the insights. In this blog post, I will guide you through the process step-by-step so you can achieve the same results.
#### Step 1: Querying Data in SQL
SQL (Structured Query Language) is the standard language for managing and manipulating databases. To start, you'll need to write SQL queries to extract the data you need. Here’s a simple example using a hypothetical database of sales data:
SELECT
    top 3 rating,
    count(rating) as 'Total Rating'
FROM movies_cleaned
WHERE [Released Country] = 'United States'
GROUP BY rating
ORDER BY count(rating) DESC
The Query selects the top 3 ratings from movies released in the United States.
#### Step 2: Exporting SQL Data to Excel
Once you have your query results, the next step is to export the data to Excel. Most database management systems (DBMS) offer options to export query results directly to Excel. Here's how you can do it in SSMS:
- Microsoft SQL Server Management Studio (SSMS):
Run your query
copy the query
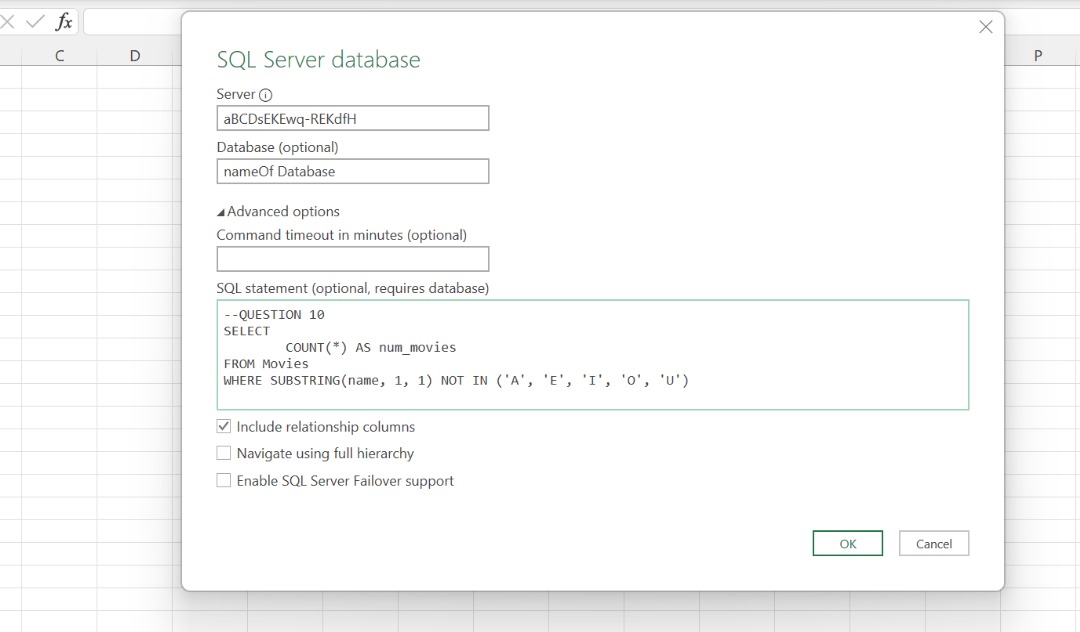
go to Excel and on the Data Menu, Click on get data -> from Database ->From SQL Server
Input the necessary details and click on Ok

#### Step 3: Creating Visualizations in Excel
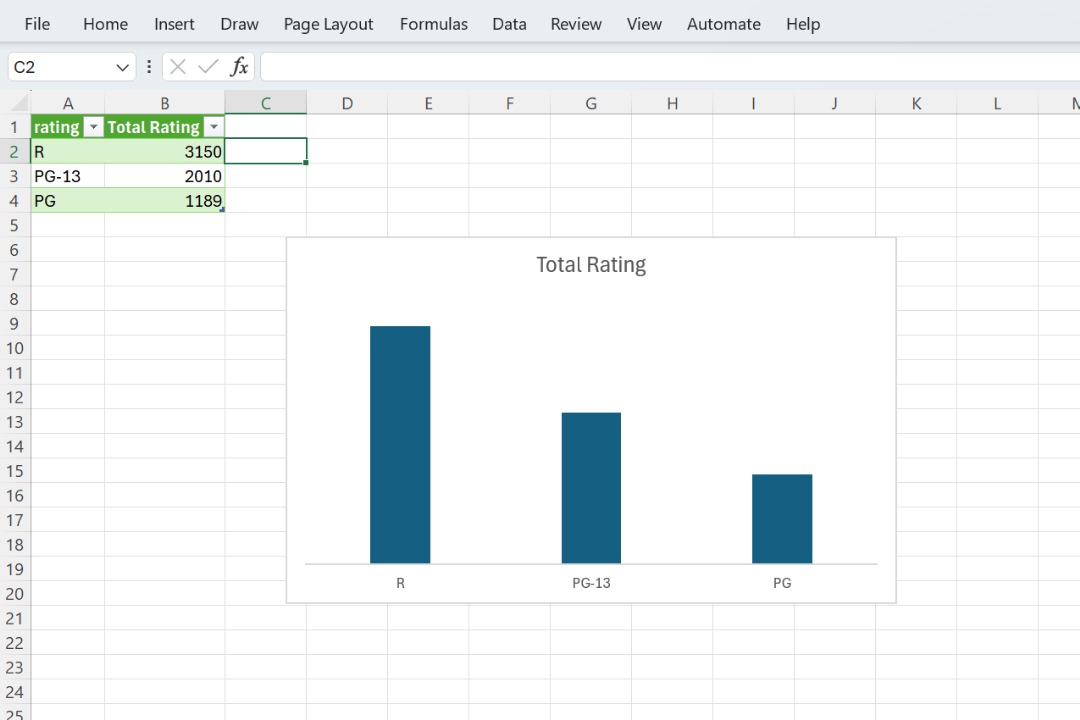
With your data now in Excel, you can create a variety of visualizations to highlight key insights. Here’s how to create a simple chart:
Insert a Chart:
Select the data range you want to visualize.
Go to the "Insert" tab on the Excel ribbon.
Choose the type of chart you want to create (e.g., bar chart, line chart, pie chart).

- Storytelling: Arrange your slides to tell a coherent story. Highlight the most important findings and explain their significance.
### Conclusion
By following these steps, you can efficiently query data in SQL, visualize it in Excel, and create a compelling PowerPoint presentation. This process not only enhances your data analysis skills but also improves your ability to communicate insights effectively. Happy querying and presenting!
Subscribe to my newsletter
Read articles from Neibo Augustine directly inside your inbox. Subscribe to the newsletter, and don't miss out.
Written by
