Reliability Engineering: Monitoring Platform Performance and Engagement with Sentry & PostHog
 Jeremy Alva
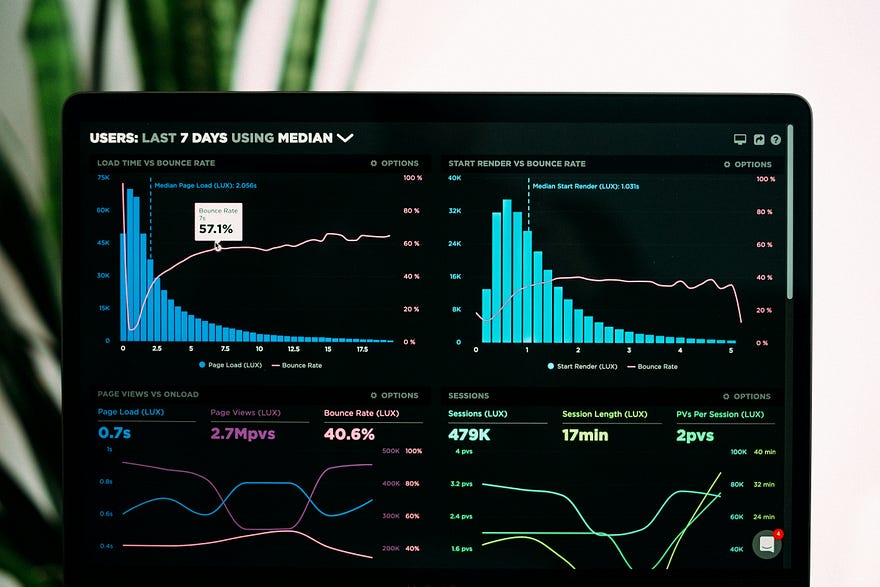
So you’ve built an app and deployed it to the web. It’s time to sit back and let the users come to us, right?
Wrong.
There are many things that could go wrong when you go live. API endpoints throws errors, servers crash, and your frontend can experience bugs at the same time your users are accessing your app. There’s a thousand things that could go wrong unknowingly.
Monitoring for Reliability Engineering

Ben Sloss, Google SRE Handbook
A good Reliability Engineering process does not rely on hope, instead it relies on data, collected from multiple aspects of your application.
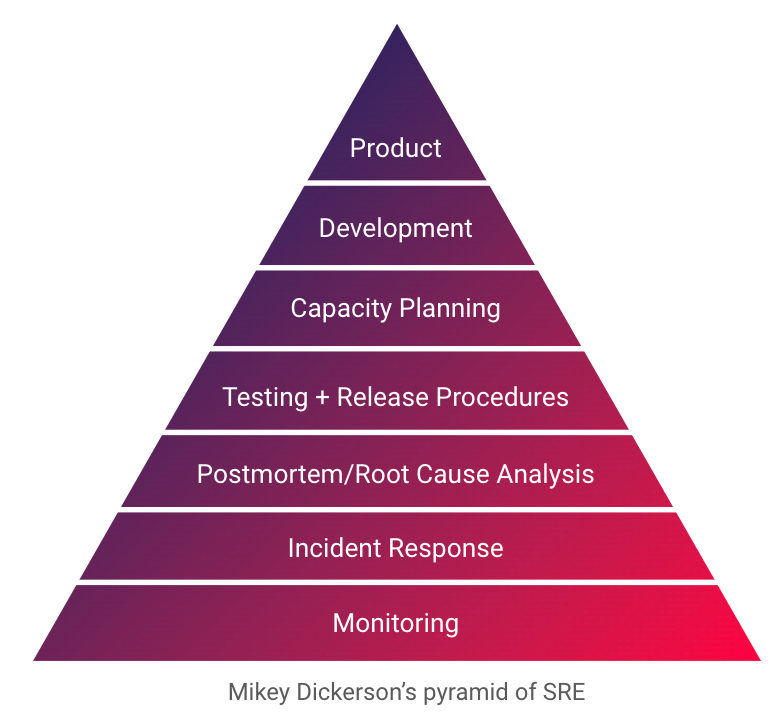
The SRE Pyramid
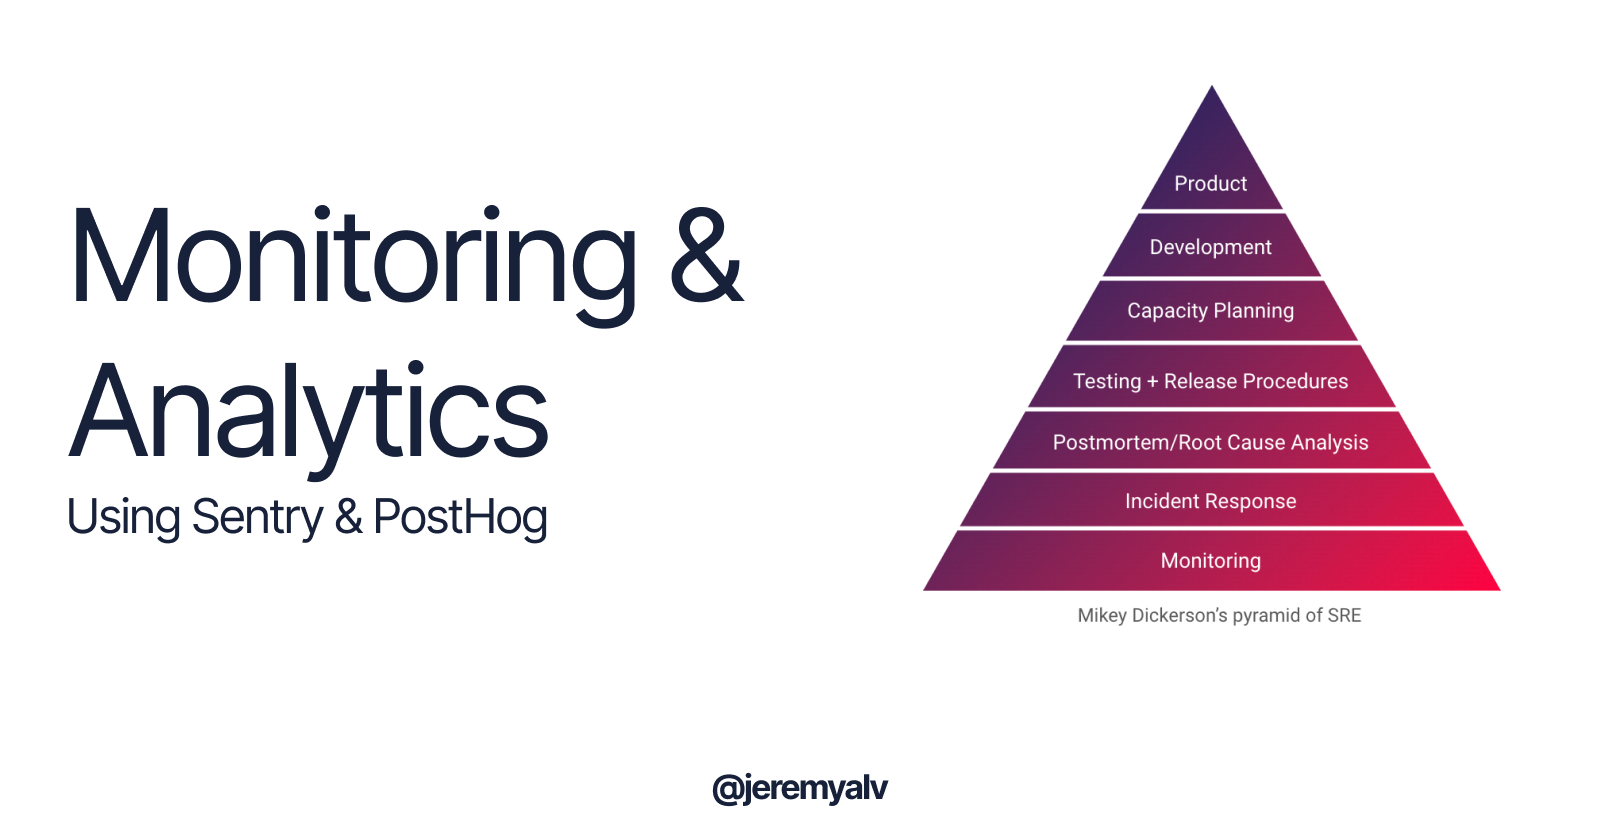
Mikey Dickerson created what’s now known as the “SRE Pyramid”, which provides principles that helps teams enable good Reliability Engineering. Monitoring is at the very base of the pyramid, because it helps SREs understand which parts of the app is breaking, when it breaks, and what sequences of actions causes it to break. At the top there is the Product itself. A good product experience ultimately relies on sound monitoring practices.
One of the monitoring tools we’ll discuss in this article is Sentry, an open-source Application Monitoring software that helps developers find bugs, monitor performance, and code profiling in production quickly.
Product Analytics for Maximizing Engagement
Aside from monitoring, there’s also the product issues that can cause your users to churn or worsen their experience using your app. These product issues include confusing workflows, pricing factors, which causes a decrease in your product conversion funnel. One example is when many users drop out of the checkout funnel when entering the payments page. They may be discouraged from continuing because their favorite payment options are not there.
One tool that could help us is Product Analytics tools, such as PostHog. PostHog helps software teams to understand how users interact with your app and where their parts of interests may lie on. It helps us debug bad user experiences and test out various versions of our app to decide on the best experience to provide to users.
We’ll be discussing both Sentry and PostHog in this article.
Sentry

Sentry is an open-source tool to help developers monitor application performance. It includes a comprehensive set of Error Tracking tools, Performance Monitoring, Code Profiling, Session Replay, and more. Some benefits of using monitoring tools like Sentry are:
Notice Problems Quickly
Monitoring tools helps us to notice bugs quickly through automated workflows. We can create alerting rules to inform our pager whenever an error has reached a certain threshold of all requests, and so on. This removes the need for a human to look at the screen 24/7, and allocates their time for the more creative debugging process instead.Clear Insight on Bugs Monitoring software helps developers to understand which bugs are happening, which parts of the code causes the bug, and what actions led to the bug itself. This helps them to find the root cause and get to the solution faster.
Get Insights on Application Performance
Monitoring software helps developers identify bottlenecks in their application, and plan out potential improvements to improve their service quality.Provide Better User Experience All of the improvements above ultimately result in a better user experience for the users. Developers can provide users a fast, intuitive, and bug-free experience so they can use the application to fulfill their needs without unnecessary friction!
Implementing Sentry
The best reference to use when implementing Sentry is their official documentation. But here I’ll outline a quick look on the steps to take to implement this great tool into your projects.
Create a Sentry.io account
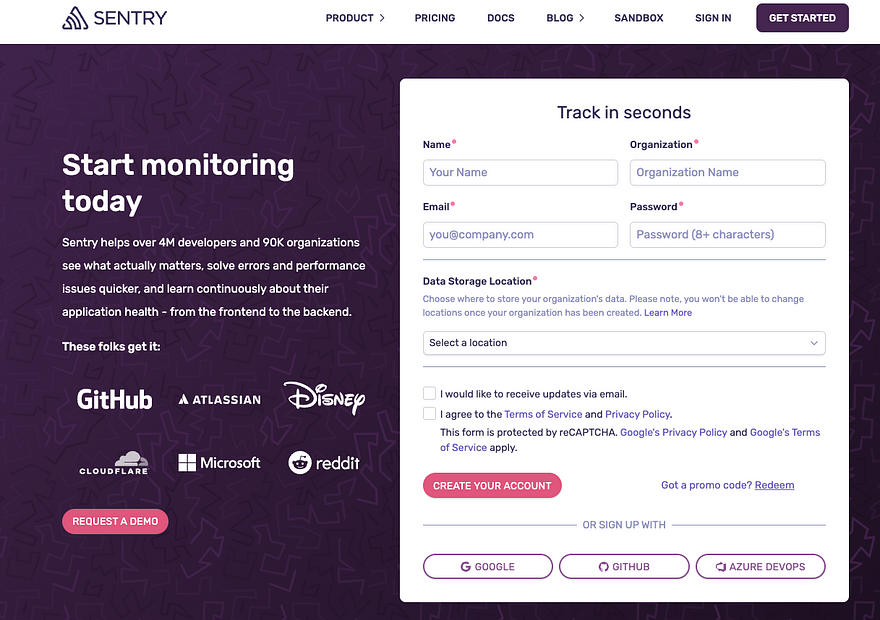
Create your account, step into the Dashboard and click “Create Project.”
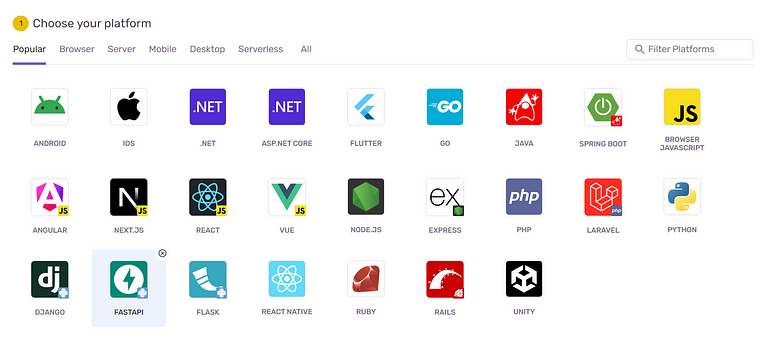
Select the platform you want to implement Sentry in
Since our team uses FastAPI, we’ll be picking FastAPI for this part.
Determining your Alert Frequency
You can choose whether to alert on every new issue, set a certain threshold, or create your own alerts later.
Give your project a name!
The above is an example of our team’s name when we signed up for Sentry.
Install Sentry on your project using pip

Initialize Sentry instance in your project
To give an example of our Python FastAPI project, we can initialize the Sentry instance like below. Replace the DSN with the one Sentry gave you.
from fastapi import FastAPI
import sentry_sdk

sentry_sdk.init(
  dsn = "your dsn"
  Traces_sample_rate=1.0
  profiles_sample_rate =1.0
)

# ...

app = FastAPI()

# ...
And you’re all set up! Sentry will track any errors happening on your app and you’ll be able to see the list on the Sentry.io dashboard page.
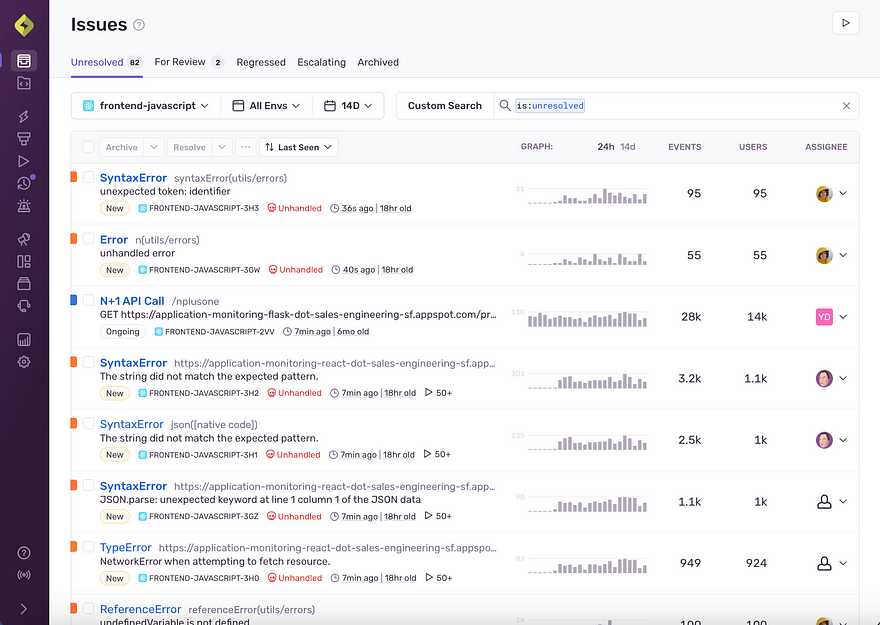
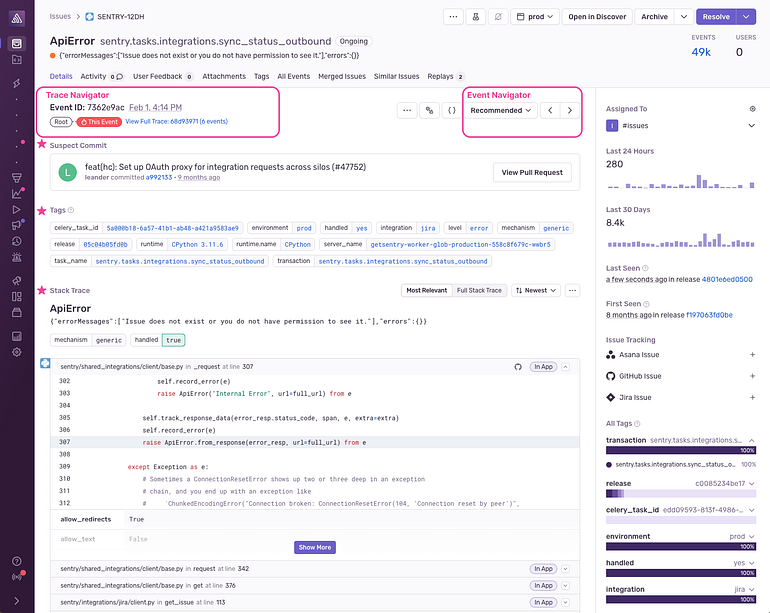
You can see that there are two types of issues, blue for performance-related and orange for error-related. We can peek into each issue to uncover it in greater detail:
Here we can see some items, including:
Trace Navigator: The Event trace on the top left below Detailstab.
Event Navigator: navigate between the recent, oldest, or Sentry-recommended issue event.
Tags: Key/value pairs which gives information regarding things such as browser type, version, etc.
Stack Trace: which parts of the code causes the error.
Suspected Commit: the commit which potentially causes the error.
Customizing Sentry
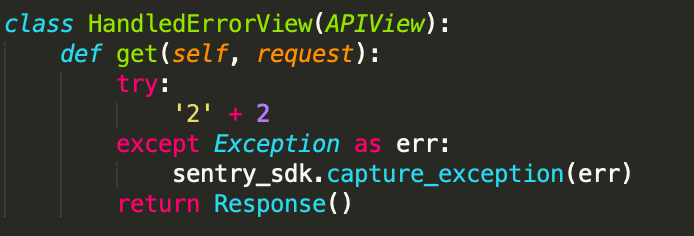
You can capture custom exceptions with Sentry by using thesentry_sdk.capture_exception(e) method.
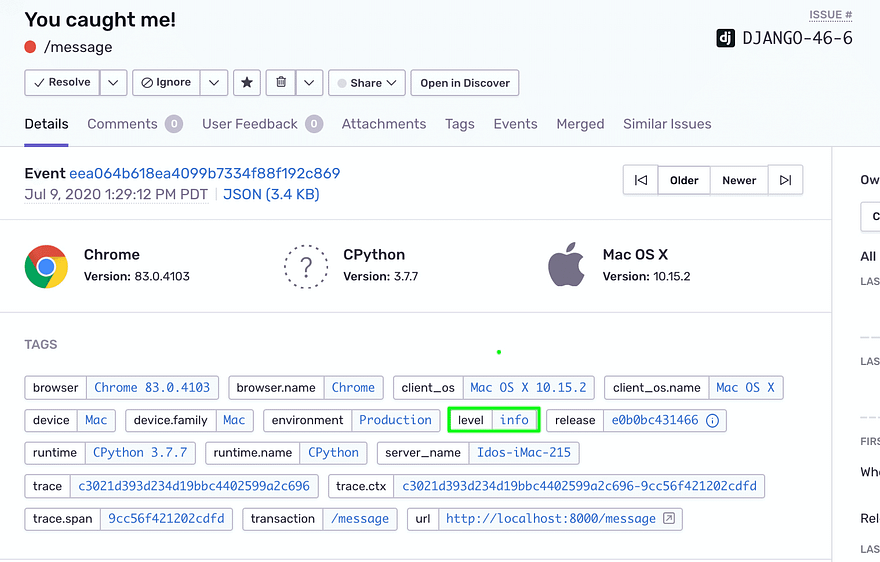
Capture messages anywhere using sentry_sdk.capture_message("message") which captures an info type message and records it on the dashboard.

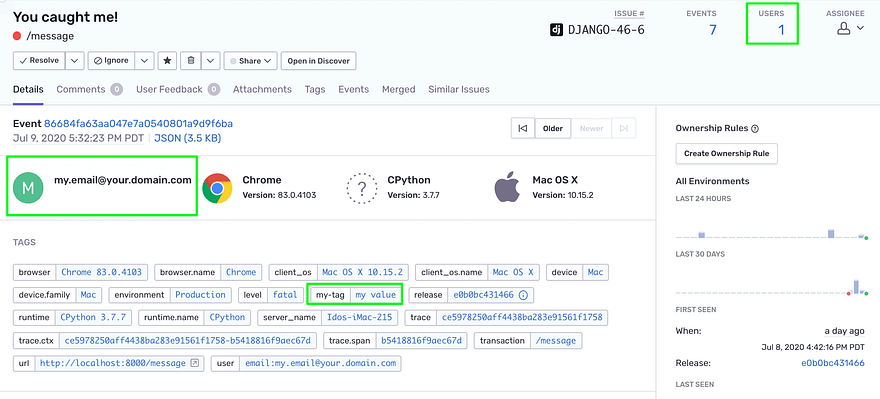
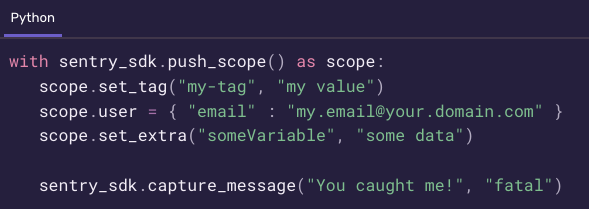
Lastly, you can customize the event data by using scopes. These values will be reflected on the Issue Details page such as below:
PostHog
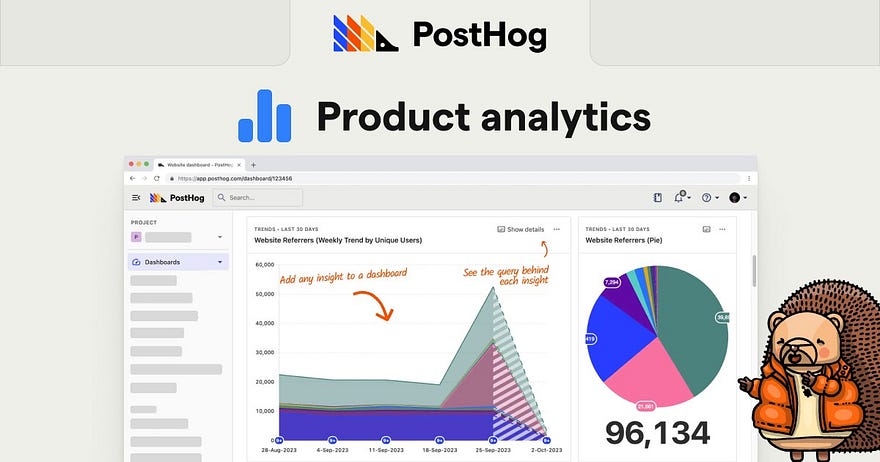
If Sentry helps us turn a bad user experience into good, PostHog helps us turn good user experience into great. PostHog is an open-source product analytics tool that developers can implement to uncover even greater insights regarding their users and how they use your product.
Their solutions include:
Product Analytics
Helps teams understand their users through conversion funnels, group analytics, stickiness, retention analysis and much more.Session Replay Diagnose UI issues by watching recordings of real users using your product. You can monitor user’s network performance, mobile devices sessions, and so on.
Feature Flags Enable safer deployment and easy rollback of features using Feature Flags. Teams can enable/disable features easily and reduce risk of bad deployments impacting users’ experience.
A/B Testing Test out feature hypotheses in production by creating experiments in PostHog. Compare the results between user set A and set B (hence, the name) to draw conclusions on how feature differences can impact user behavior.
and more!
Implementing Posthog in Next.JS app
The PostHog documentation provides a lot of information regarding on how to implement the product analytics tool. Head to the Next.js guide for the next steps:
Install posthog-js on your project
npm install --save posthog-js
Add new environment variables for PostHog
NEXT_PUBLIC_POSTHOG_KEY=<ph_project_api_key>
NEXT_PUBLIC_POSTHOG_HOST=<ph_client_api_host>
These values need to start with NEXT_PUBLIC_ to be accessible on the client-side.
The next step will depend on whether your Next.js project uses Page Router or the App Router. In our case, we used the Page Router for our app.
Import PostHog JS modules
// Pages Router
import posthog from 'posthog-js'
import { PostHogProvider } from 'posthog-js/react'
Do a check to ensure the code is run client-side
// Check that PostHog is client-side (used to handle Next.js SSR)
if (typeof window !== 'undefined') {
  posthog.init(process.env.NEXT_PUBLIC_POSTHOG_KEY, {
    api_host: process.env.NEXT_PUBLIC_POSTHOG_HOST || 'https://app.posthog.com',
    // Enable debug mode in development
    loaded: (posthog) => {
      if (process.env.NODE_ENV === 'development') posthog.debug()
    }
  })
}
Inside your _app.tsx , wrap all the components inside PostHogProvider .
<PostHogProvider client={posthog}>
  <Component {...pageProps} />
</PostHogProvider>
And you’re all set! PostHog will now track events such as form inputs, clicks, and so on.
Using the usePostHog React hook
We can track more than just generic events, and define custom events using the PostHog library. We'll useposthog-js in tracking user events, and usePosthog hook is the tool to capture a user event and send it to the Posthog dashboard.
We’ll capture the events using posthog.capture('event_id_string') for events we want to capture.
import { usePostHog } from 'posthog-js/react'
// ...

function App() {
  const posthog = usePostHog();
  // ...

  useEffect(() => {
    if (user) {
      // posthog.identify will map actions tracked to a user
      const userEmail = secureLocalStorage.getItem("active_user_email");

      if (typeof userEmail === "string") {
        posthog?.identify(userEmail as string);
      }
    }
  }, [posthog, jwt]);

  return (
    <>
      {isAuthRoute ? (
        <PostHogProvider client={posthog}>
          // ...
        </PostHogProvider>
      ) : (
        <PostHogProvider client={posthog}>
          // ...
        </PostHogProvider>
      )}
    </>
  );
}
Identifying Previously Anonymous Requests
As seen above, posthog.identify is a method used to identify previously anonymous User_ID into specific identifiers such as email or user_id in your database. It is recommended to track users when they log in to your site and reset the identify session each time they log out. For further information you can reference the PostHog Guide on Identifying Users.
useEffect(() => {
    if (user) {
      // posthog.identify will map actions tracked to a user
      const userEmail = secureLocalStorage.getItem("active_user_email");

      if (typeof userEmail === "string") {
        posthog?.identify(userEmail as string);
      }
    }
  }, [posthog, jwt]);
Capturing More Granular Events
The second argument of the capturemethod is used when we want to include more data to the PostHog event, such as JOB_ID and so on.
const handleTranscribe = async () => {
    const cookies = parseCookies();
    const jobName = uuidv4();
    const fileName = cookies["fileName"];

    const selectedLanguage = (
      document.querySelector(
        'input[name="language"]:checked'
      ) as HTMLInputElement
    )?.value;

    const title = (
      document.querySelector('input[name="title"]') as HTMLInputElement
    )?.value;

    const tags = (
      document.querySelector('input[name="tags"]') as HTMLInputElement
    )?.value;

    posthog?.capture(PostHogEvents.TRANSCRIPTION_START_TRANSCRIBE_JOB, {
      "job_name": jobName,
      "file_name": fileName,
      "selected_language": selectedLanguage,
      "title": title,
      "tags": tags,
    });

    // ...
}
Viewing Events on Dashboard
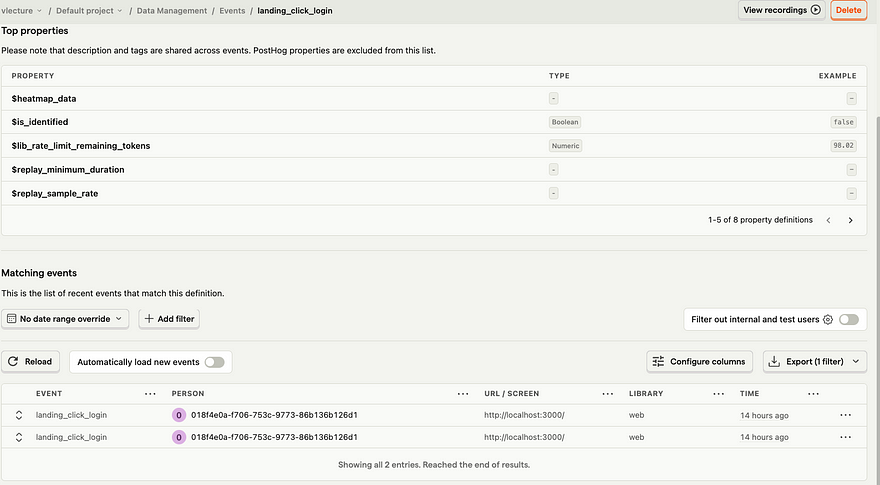
You can view the PostHog events on your Dashboard by going to Data Management > Events , here you’ll see all the tracked events generated by the user.
Analyze Product Usage by Creating Insights
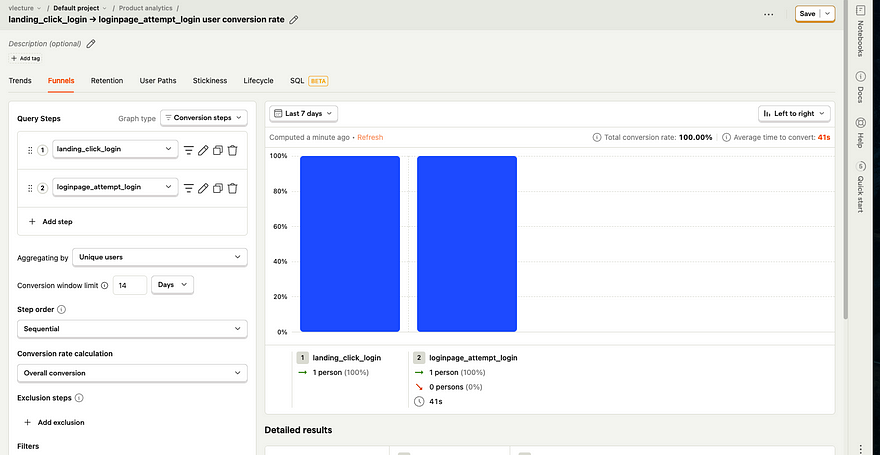
To analyze your user data further, create Insights by going to Product Analytics on the sidebar, and click New Insight on the top right corner of the screen. Here, you can combine data points and visualize into trends, funnels, etc. according to your use case.
For example, in our sample data below we can see that all users who clicked “Login” on the landing page, filled out the Login Form and attempted to log in into our application. This insight can be used to inform business/product decisions to optimize the user experience even further for users.
We’ve barely touched the surface on PostHog, as there’s still a lot of other useful tools such as Group Analytics, Session Replay, and so on. Our team plans to utilize these tools further in our next sprint, so we can gain deeper user insights as we approach the product launch date.
References
Subscribe to my newsletter
Read articles from Jeremy Alva directly inside your inbox. Subscribe to the newsletter, and don't miss out.
Written by

Jeremy Alva
Jeremy Alva
product-oriented software engineer
