Optimize React Components with the React Profiler 🚀
 Gautam Vaja
Imagine you're working on a complex React application that's starting to feel sluggish. Users are complaining about slow load times and laggy interactions. You suspect that some components are rendering more frequently than they should, but figuring out exactly what's going wrong is tricky. This is where the React Profiler comes in handy.
A Real-World Example
Let's look at a simple app that displays a list of items and allows users to add new items. Here's the initial code:
import React, { useState } from "react";

function App() {
  const [items, setItems] = useState([]);
  const [newItem, setNewItem] = useState("");

  const addItem = () => {
    setItems([...items, newItem]);
    setNewItem("");
  };

  return (
    <div>
      <input
        type="text"
        value={newItem}
        onChange={(e) => setNewItem(e.target.value)}
      />
      <button onClick={addItem}>Add Item</button>
      <ItemList items={items} />
    </div>
  );
}

function ItemList({ items }) {
  return (
    <ul>
      {items.map((item, index) => (
        <li key={index}>{item}</li>
      ))}
    </ul>
  );
}

export default App;

The app works, but as the number of items grows, it starts to slow down, especially when adding new items. The problem is that the ItemList component re-renders every time a new item is added, even if the list of items hasn't changed.
Introducing React Profiler
To diagnose and fix this issue, we can use the React Profiler to measure the performance of our components.
Adding the Profiler to Your Code
First, let's wrap the ItemList component with the <Profiler> component:
import React, { Profiler, useState } from "react";

function App() {
  const [items, setItems] = useState([]);
  const [newItem, setNewItem] = useState("");

  const addItem = () => {
    setItems([...items, newItem]);
    setNewItem("");
  };

  const onRenderCallback = (
    id,
    phase,
    actualDuration,
    baseDuration,
    startTime,
    commitTime,
    interactions
  ) => {
    console.log(`Profiling ${id}:`, {
      phase,
      actualDuration,
      baseDuration,
      startTime,
      commitTime,
      interactions,
    });
  };

  return (
    <div>
      <input
        type="text"
        value={newItem}
        onChange={(e) => setNewItem(e.target.value)}
      />
      <button onClick={addItem}>Add Item</button>
      <Profiler id="ItemList" onRender={onRenderCallback}>
        <ItemList items={items} />
      </Profiler>
    </div>
  );
}

function ItemList({ items }) {
  return (
    <ul>
      {items.map((item, index) => (
        <li key={index}>{item}</li>
      ))}
    </ul>
  );
}

export default App;
Analyzing the Results
How to Use It
- Open your React application in the browser.
- Open React Developer Tools and navigate to the "Profiler" tab.
- Click the "Record" button to start profiling.
- Add items to the list so that the
ItemListcomponent re-renders. - Click the "Stop" button in the Profiler to end the recording session.
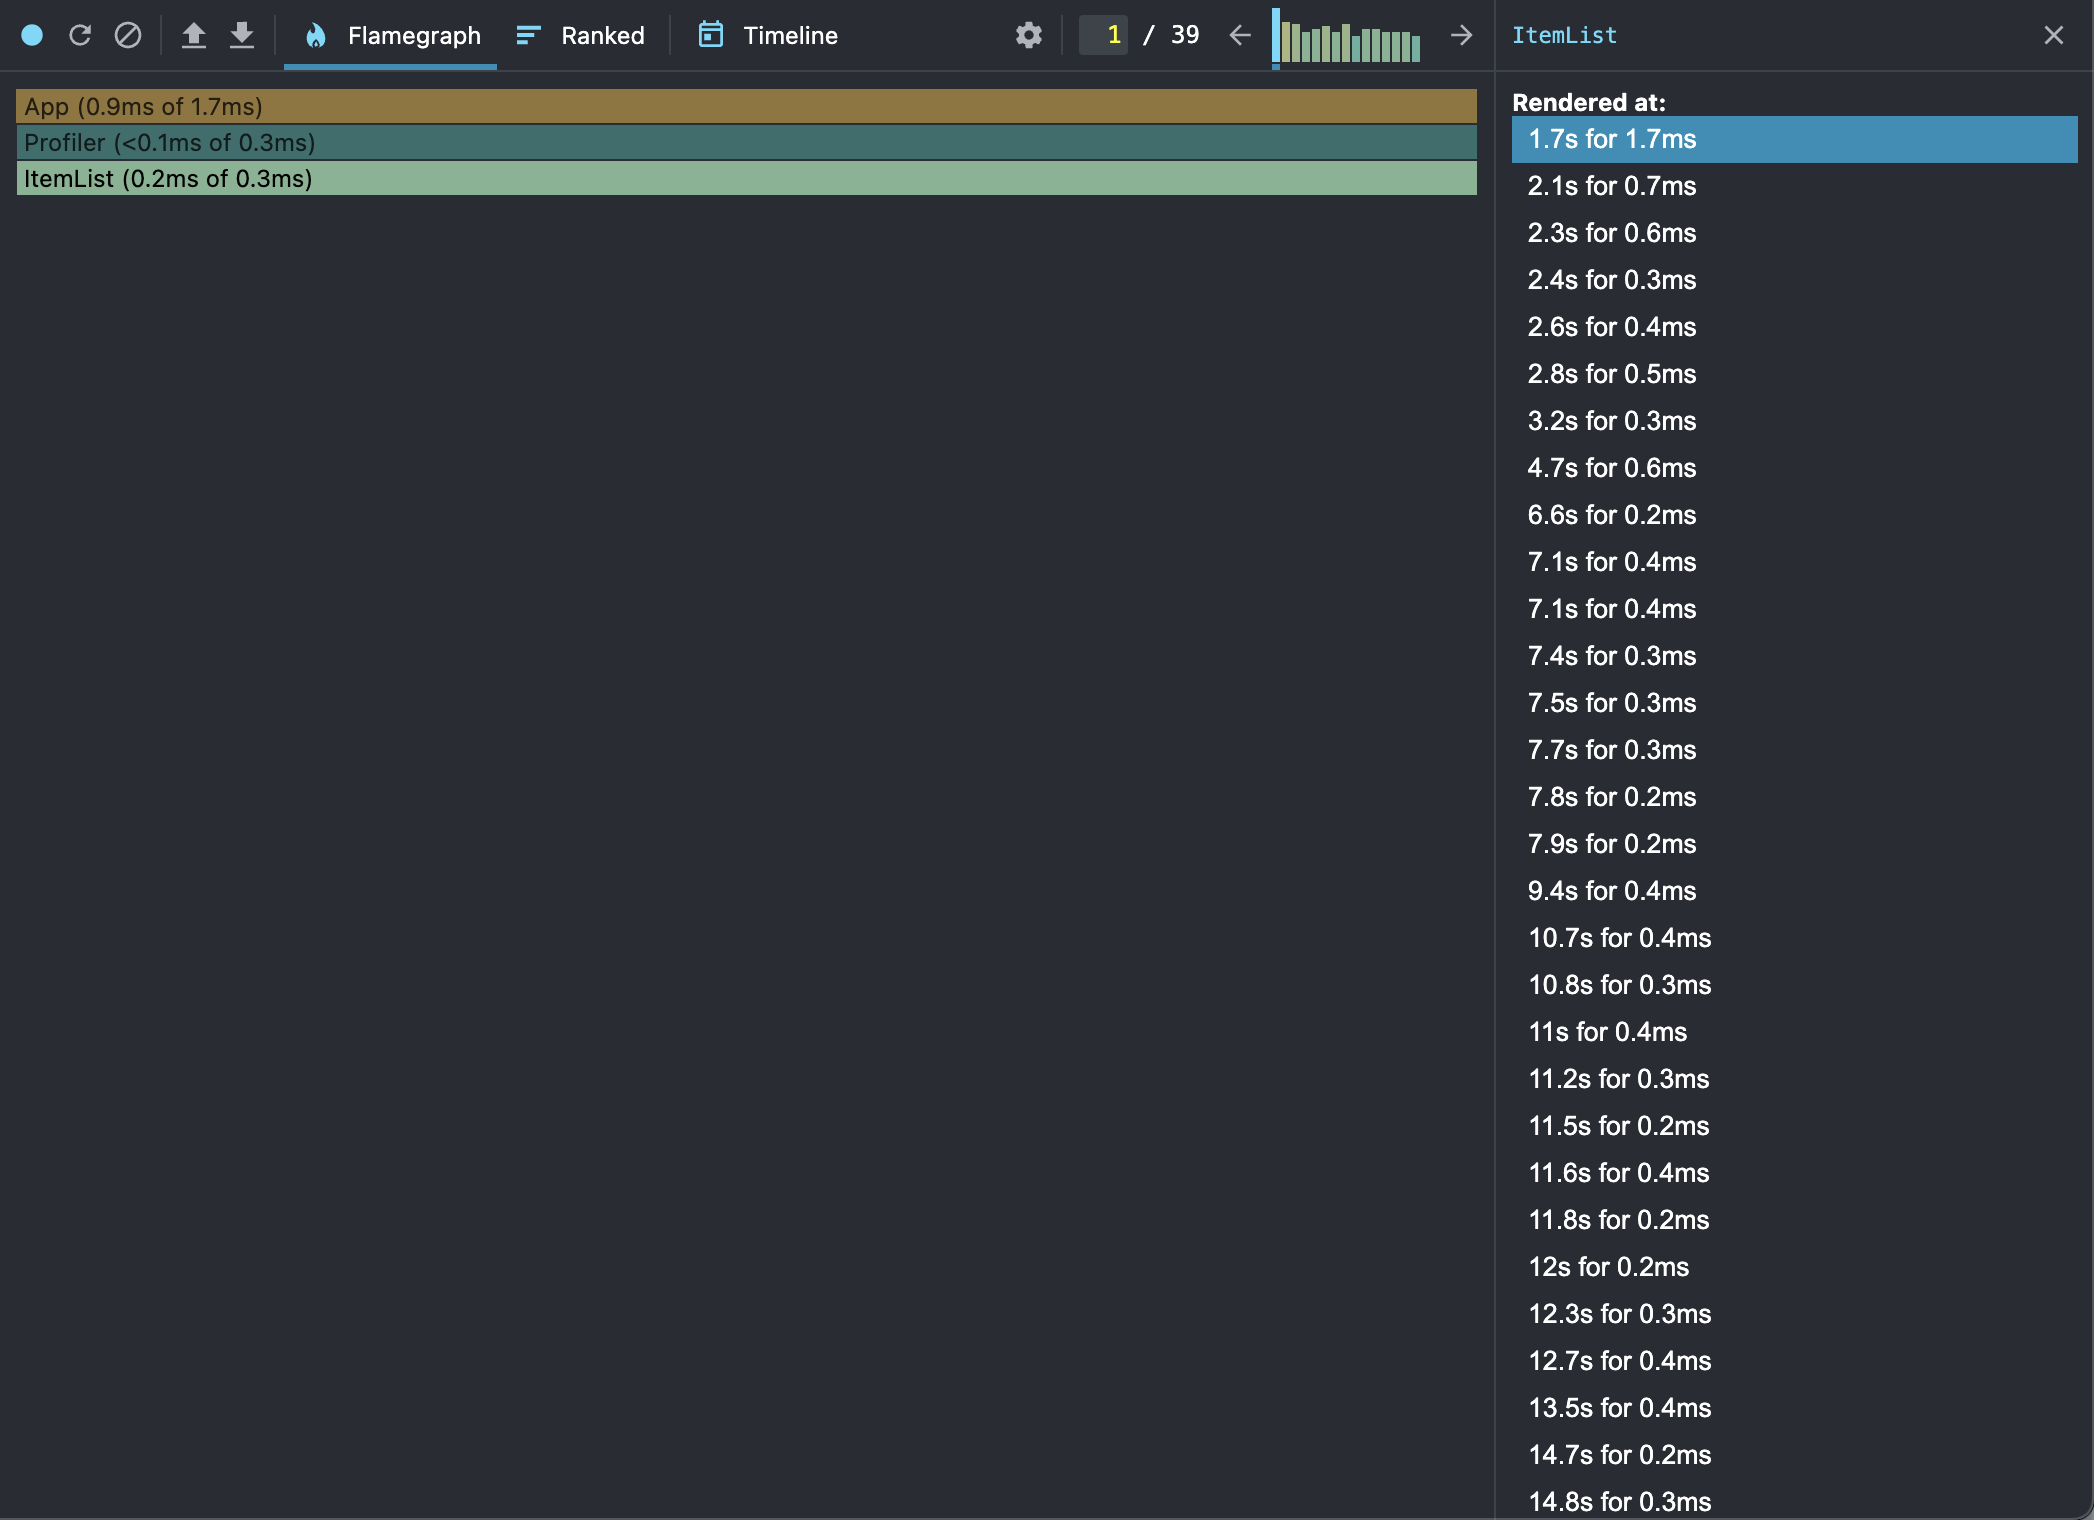
- The Profiler will display a flamegraph.
- You can also see the console logs.
- In the flamegraphs, click on the
ItemListcomponent to see the rendering timestamps.
What is a Flamegraph?
A flamegraph is a visual representation of the rendering performance of your application. It displays how much time each component takes to render, helping you identify performance bottlenecks. Each bar in the flamegraph represents a component, and the length of the bar corresponds to the time spent rendering that component.
Key Elements of the Flamegraph
- Bars: Each bar represents a component in your React application.
- Width of Bars: The width of each bar corresponds to the amount of time the component took to render. Wider bars indicate longer render times.
- Colors: The colors can help distinguish between different components. Typically, the React Profiler uses consistent coloring to differentiate components.
- Hierarchy: The flamegraph displays the component hierarchy, showing which components are children of others.
Analysis

- App: Takes 1.2ms out of the total 2ms render time.
- Profiler: Takes less than 0.1ms.
- ItemList: Takes 0.2ms.
 - Itemlist component renders so frequently
Optimizing with React.memo
To prevent unnecessary re-renders, we can use React.memo to memoize the ItemList component:
import React, { Profiler, useState, memo } from "react";

function App() {
  const [items, setItems] = useState([]);
  const [newItem, setNewItem] = useState("");

  const addItem = () => {
    setItems([...items, newItem]);
    setNewItem("");
  };

  const onRenderCallback = (
    id,
    phase,
    actualDuration,
    baseDuration,
    startTime,
    commitTime,
    interactions
  ) => {
    console.log(`Profiling ${id}:`, {
      phase,
      actualDuration,
      baseDuration,
      startTime,
      commitTime,
      interactions,
    });
  };

  return (
    <div>
      <input
        type="text"
        value={newItem}
        onChange={(e) => setNewItem(e.target.value)}
      />
      <button onClick={addItem}>Add Item</button>
      <Profiler id="ItemList" onRender={onRenderCallback}>
        <MemoizedItemList items={items} />
      </Profiler>
    </div>
  );
}

const ItemList = ({ items }) => {
  return (
    <ul>
      {items.map((item, index) => (
        <li key={index}>{item}</li>
      ))}
    </ul>
  );
};

const MemoizedItemList = memo(ItemList);

export default App;
Using useCallback to Memoize Functions
To further optimize, avoid passing anonymous functions as props, which can cause components to re-render. Use useCallback to memoize functions:
import React, { Profiler, useState, useCallback, memo } from "react";

function App() {
  const [items, setItems] = useState([]);
  const [newItem, setNewItem] = useState("");

  const addItem = useCallback(() => {
    setItems((prevItems) => [...prevItems, newItem]);
    setNewItem("");
  }, [newItem]);

  const onRenderCallback = (
    id,
    phase,
    actualDuration,
    baseDuration,
    startTime,
    commitTime,
    interactions
  ) => {
    console.log(`Profiling ${id}:`, {
      phase,
      actualDuration,
      baseDuration,
      startTime,
      commitTime,
      interactions,
    });
  };

  return (
    <div>
      <input
        type="text"
        value={newItem}
        onChange={(e) => setNewItem(e.target.value)}
      />
      <button onClick={addItem}>Add Item</button>
      <Profiler id="ItemList" onRender={onRenderCallback}>
        <MemoizedItemList items={items} />
      </Profiler>
    </div>
  );
}

const ItemList = ({ items }) => {
  return (
    <ul>
      {items.map((item, index) => (
        <li key={index}>{item}</li>
      ))}
    </ul>
  );
};

const MemoizedItemList = memo(ItemList);

export default App;
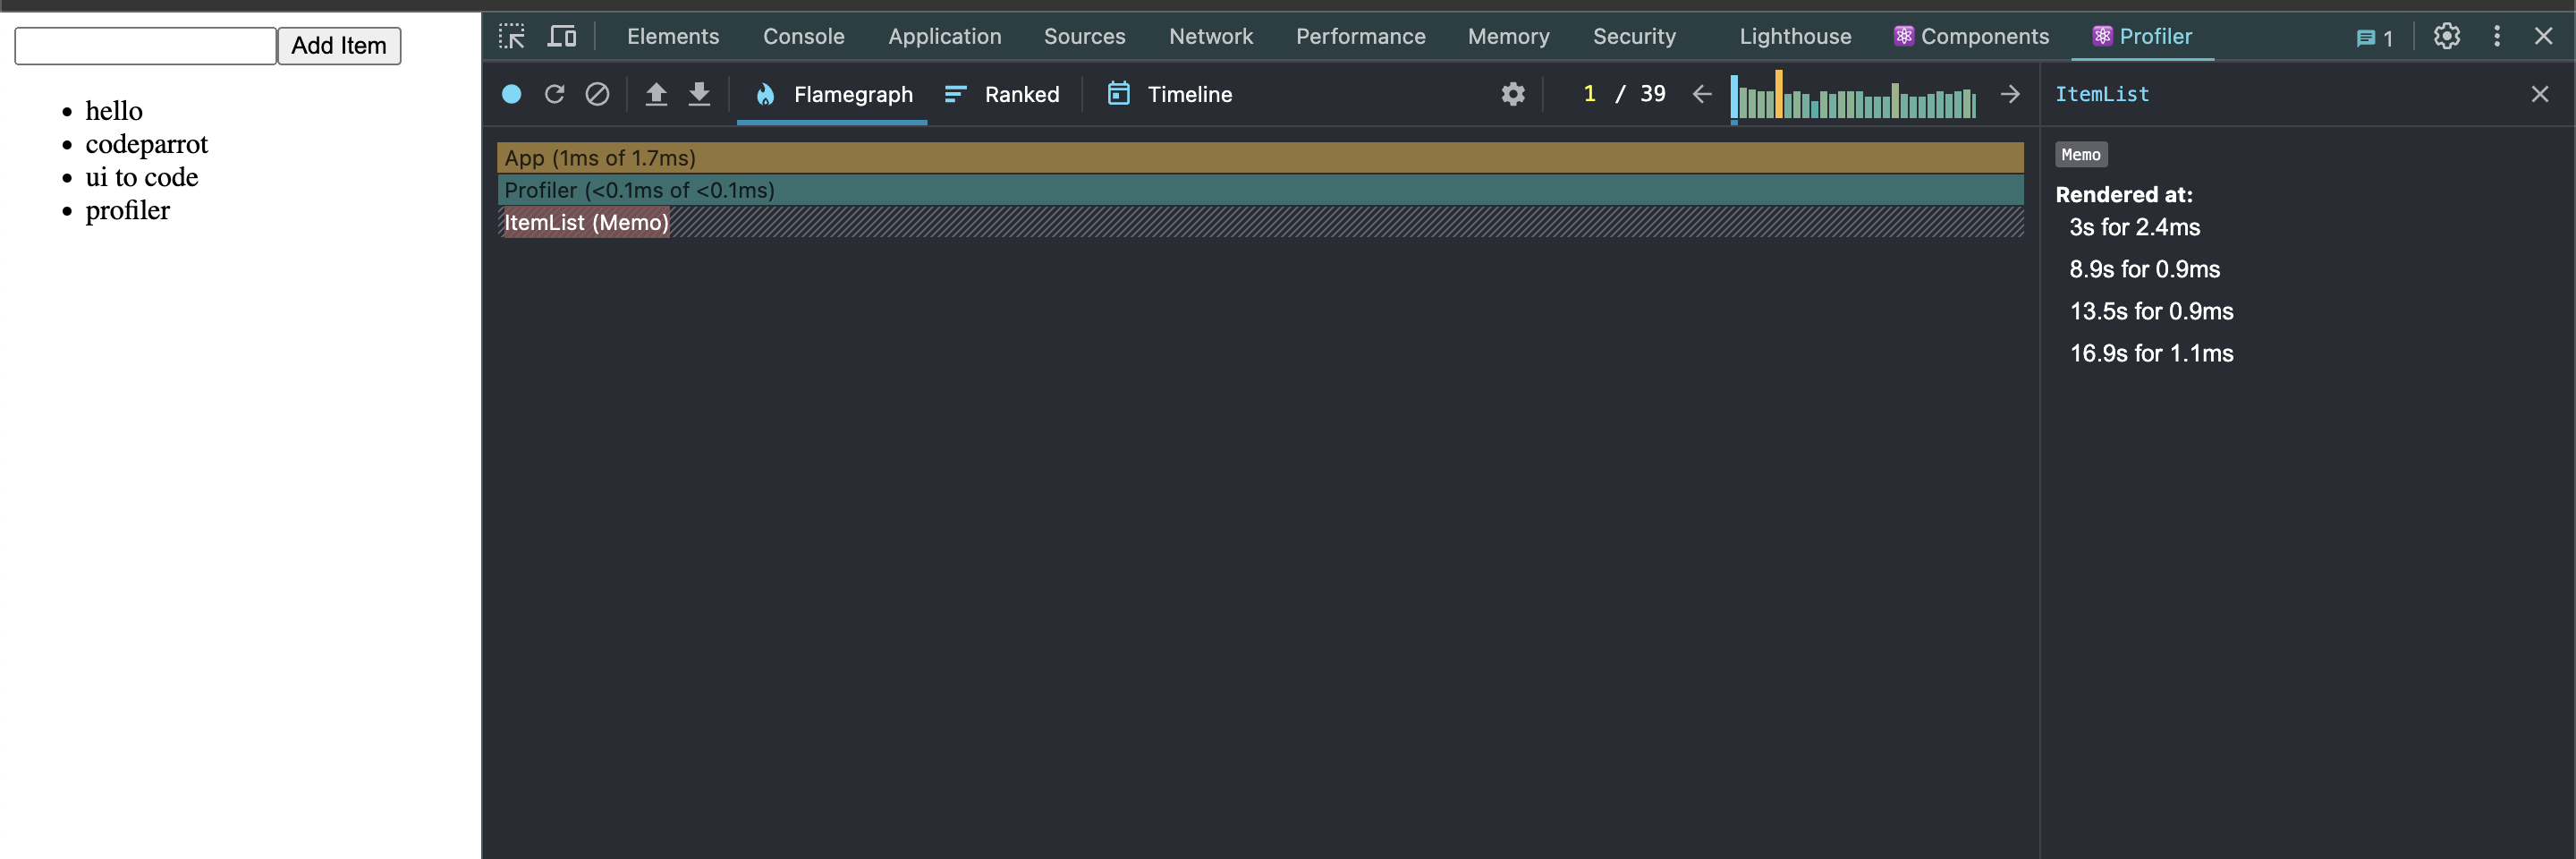
Rendering time stamps after react memo and callback function.

Rendering Time Stamps after Optimization
After applying React.memo and useCallback, you can see that the ItemList component only renders four times for four items in 16 seconds, significantly reducing unnecessary re-renders.
Conclusion
The React Profiler helps you find and fix performance issues in your React apps. By using React.memo and useCallback, you can optimize components and create a smoother user experience. Happy coding!
For more details, visit the official React Profiler documentation.
Subscribe to my newsletter
Read articles from Gautam Vaja directly inside your inbox. Subscribe to the newsletter, and don't miss out.
Written by
