Light House vs Web Vitals: Which score is real?
 Gautam Vaja
What is Google Lighthouse?
Google Lighthouse is an open-source, automated tool for improving the quality of web pages. It provides audits for performance, accessibility, SEO, and more. You can run Lighthouse in Chrome DevTools, from the command line, or as a Node module.
How to Run Lighthouse
- Open Chrome DevTools (F12 or right-click on the page and select "Inspect").
- Click on the “Lighthouse” tab.
- Select the categories you want to audit (Performance, Accessibility, Best Practices, SEO, PWA).
- Click “Generate report”.
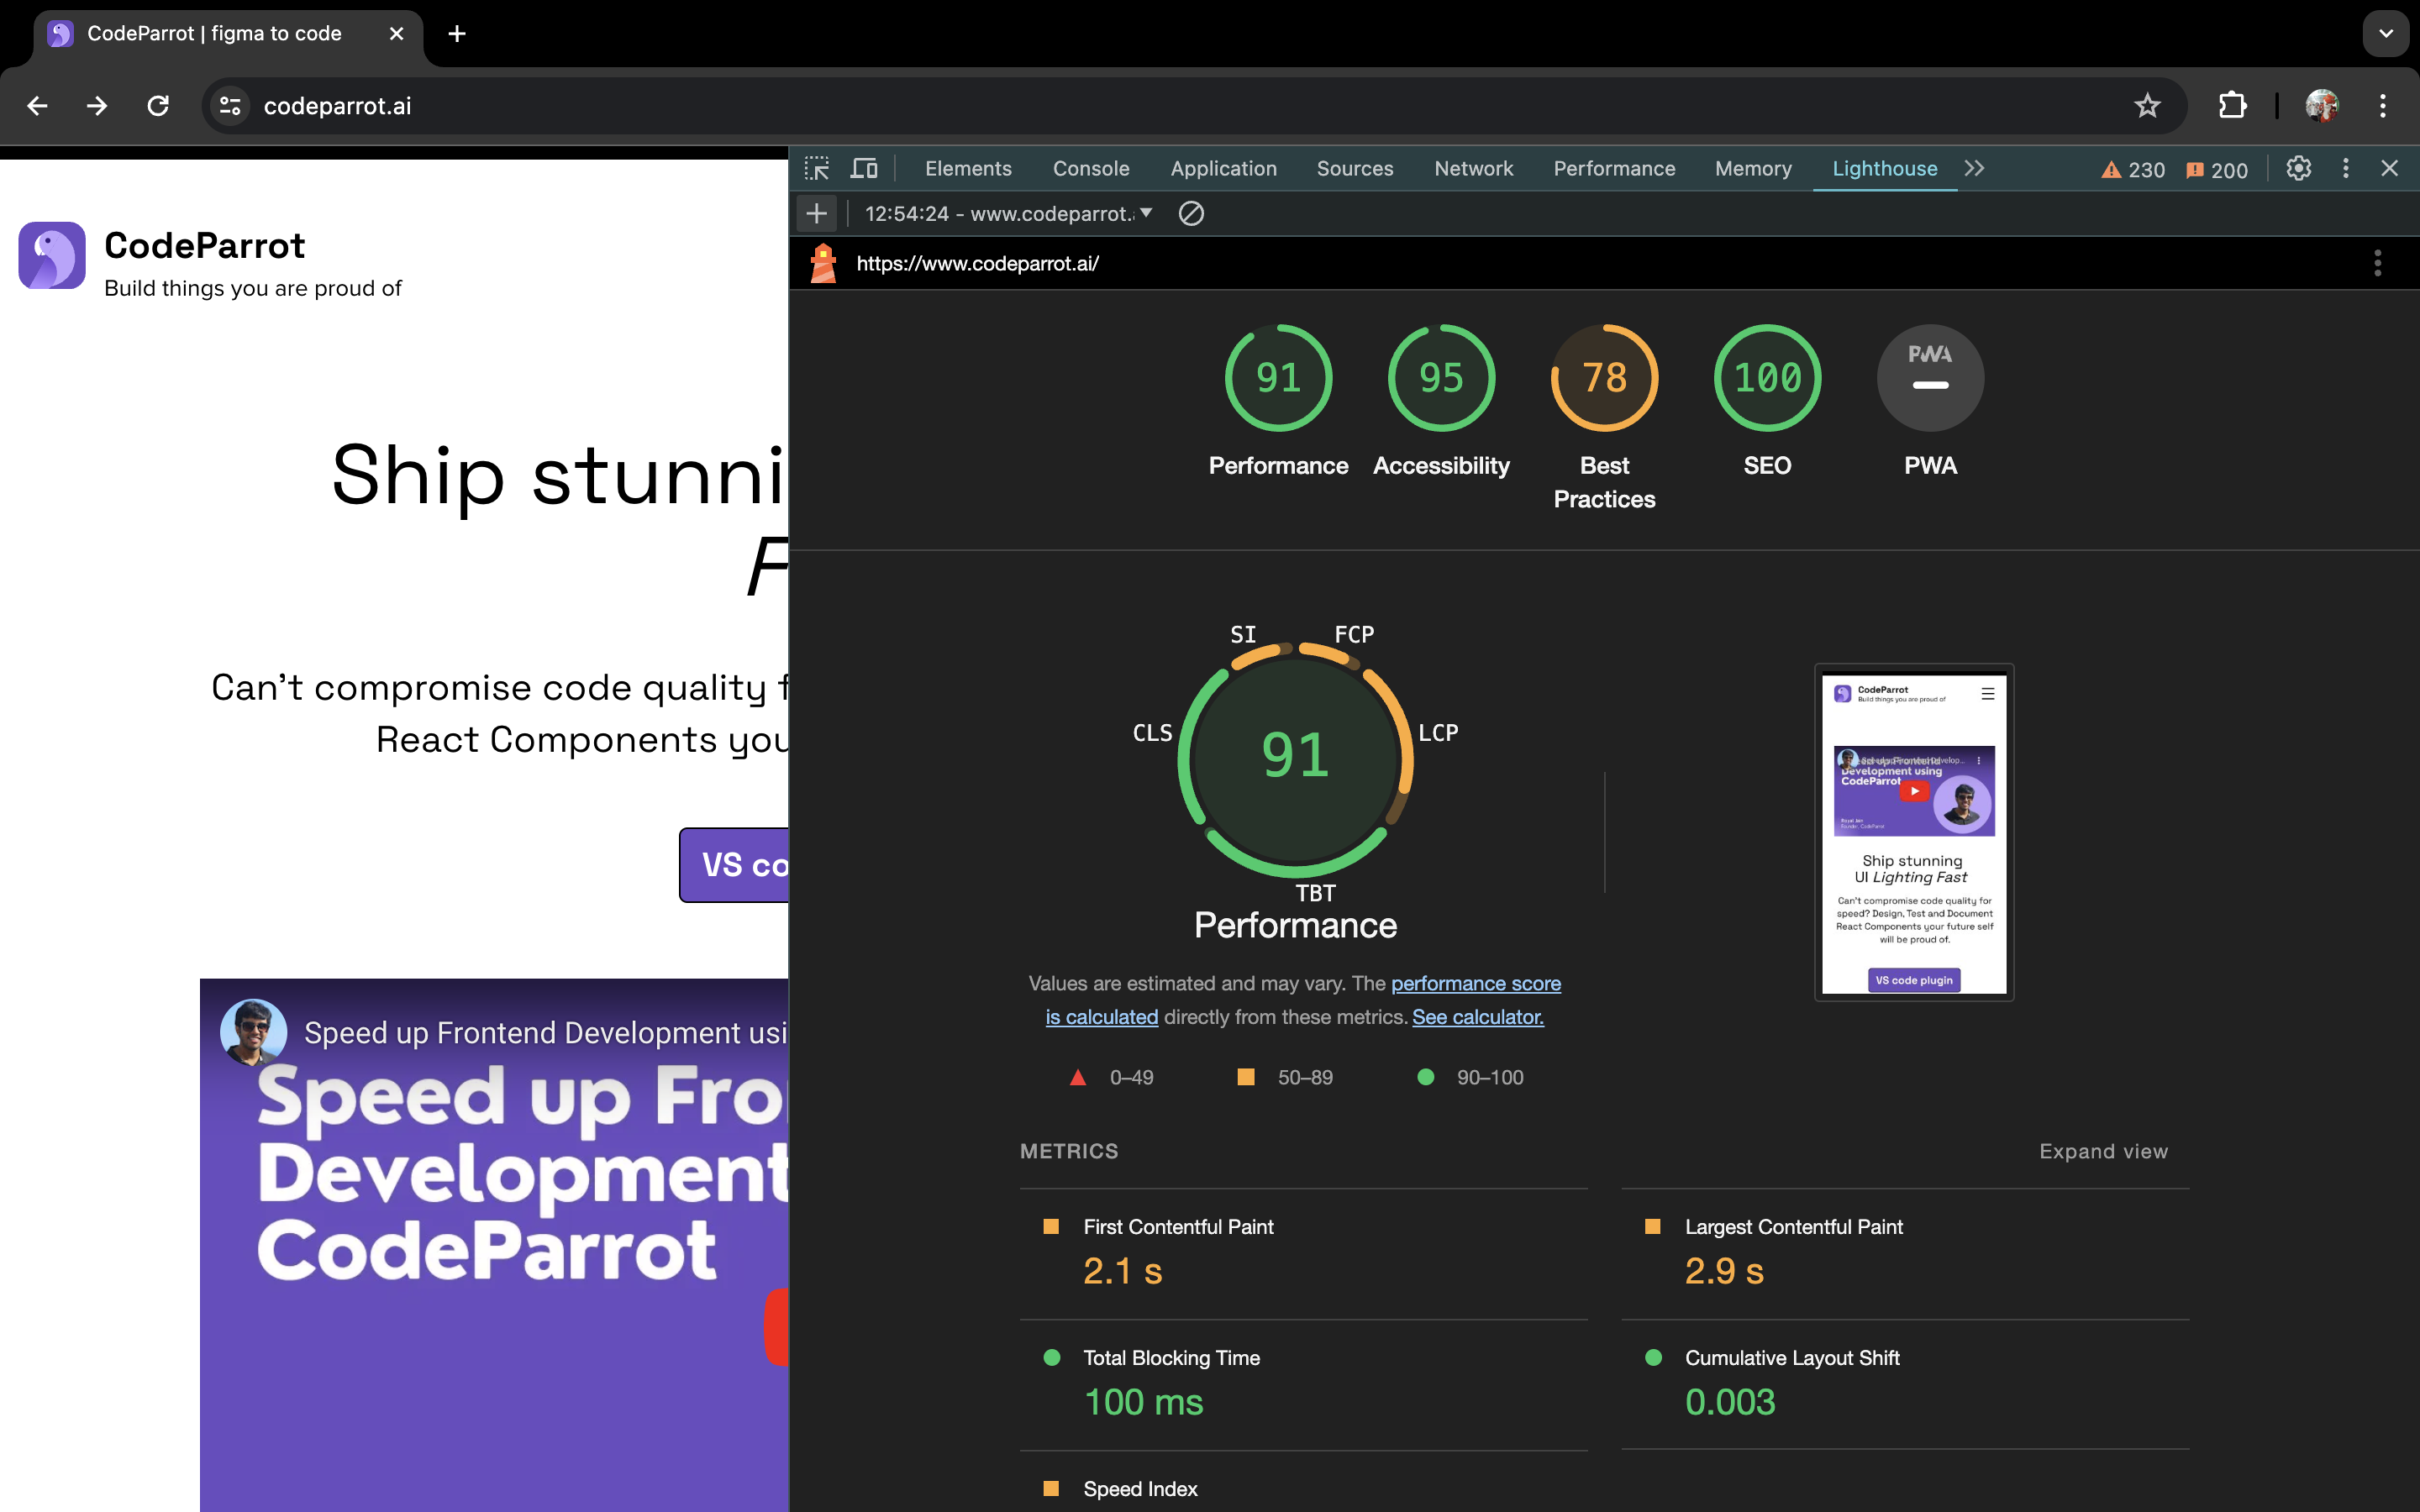
Here’s an example of a Lighthouse report for codeparrot.ai:

Overview of a Lighthouse Report
- Performance: 91
- Accessibility: 95
- Best Practices: 78
- SEO: 100
- PWA: Not available (PWA score is not provided)
Performance (91)
- First Contentful Paint (FCP): 2.1 seconds
- This is the time it takes for the first piece of content to be painted on the screen.
- Largest Contentful Paint (LCP): 2.9 seconds
- This measures how long it takes for the largest content element to be painted.
- Total Blocking Time (TBT): 100 milliseconds
- The total time the main thread is blocked, preventing user input responsiveness.
- Cumulative Layout Shift (CLS): 0.003
- This measures the visual stability of the page and how often unexpected layout shifts occur.
Accessibility (95)
This score evaluates how accessible your website content is, especially for users with disabilities. It involves aspects like color contrast, ARIA roles, and screen reader support.
Best Practices (78)
This score reflects adherence to modern web development best practices, such as avoiding deprecated APIs, using HTTPS, ensuring secure resource loading, and reducing JavaScript execution time.
SEO (100)
A perfect SEO score indicates excellent adherence to search engine optimization best practices, including the proper use of meta tags, descriptive link text, and ensuring pages are crawlable.
What are Web Vitals?
Web Vitals is a set of metrics introduced by Google to help quantify the user experience on a web page. These metrics focus on three main aspects:
- Loading (Largest Contentful Paint - LCP)
- Interactivity (First Input Delay - FID)
- Visual Stability (Cumulative Layout Shift - CLS)
How to Measure Web Vitals
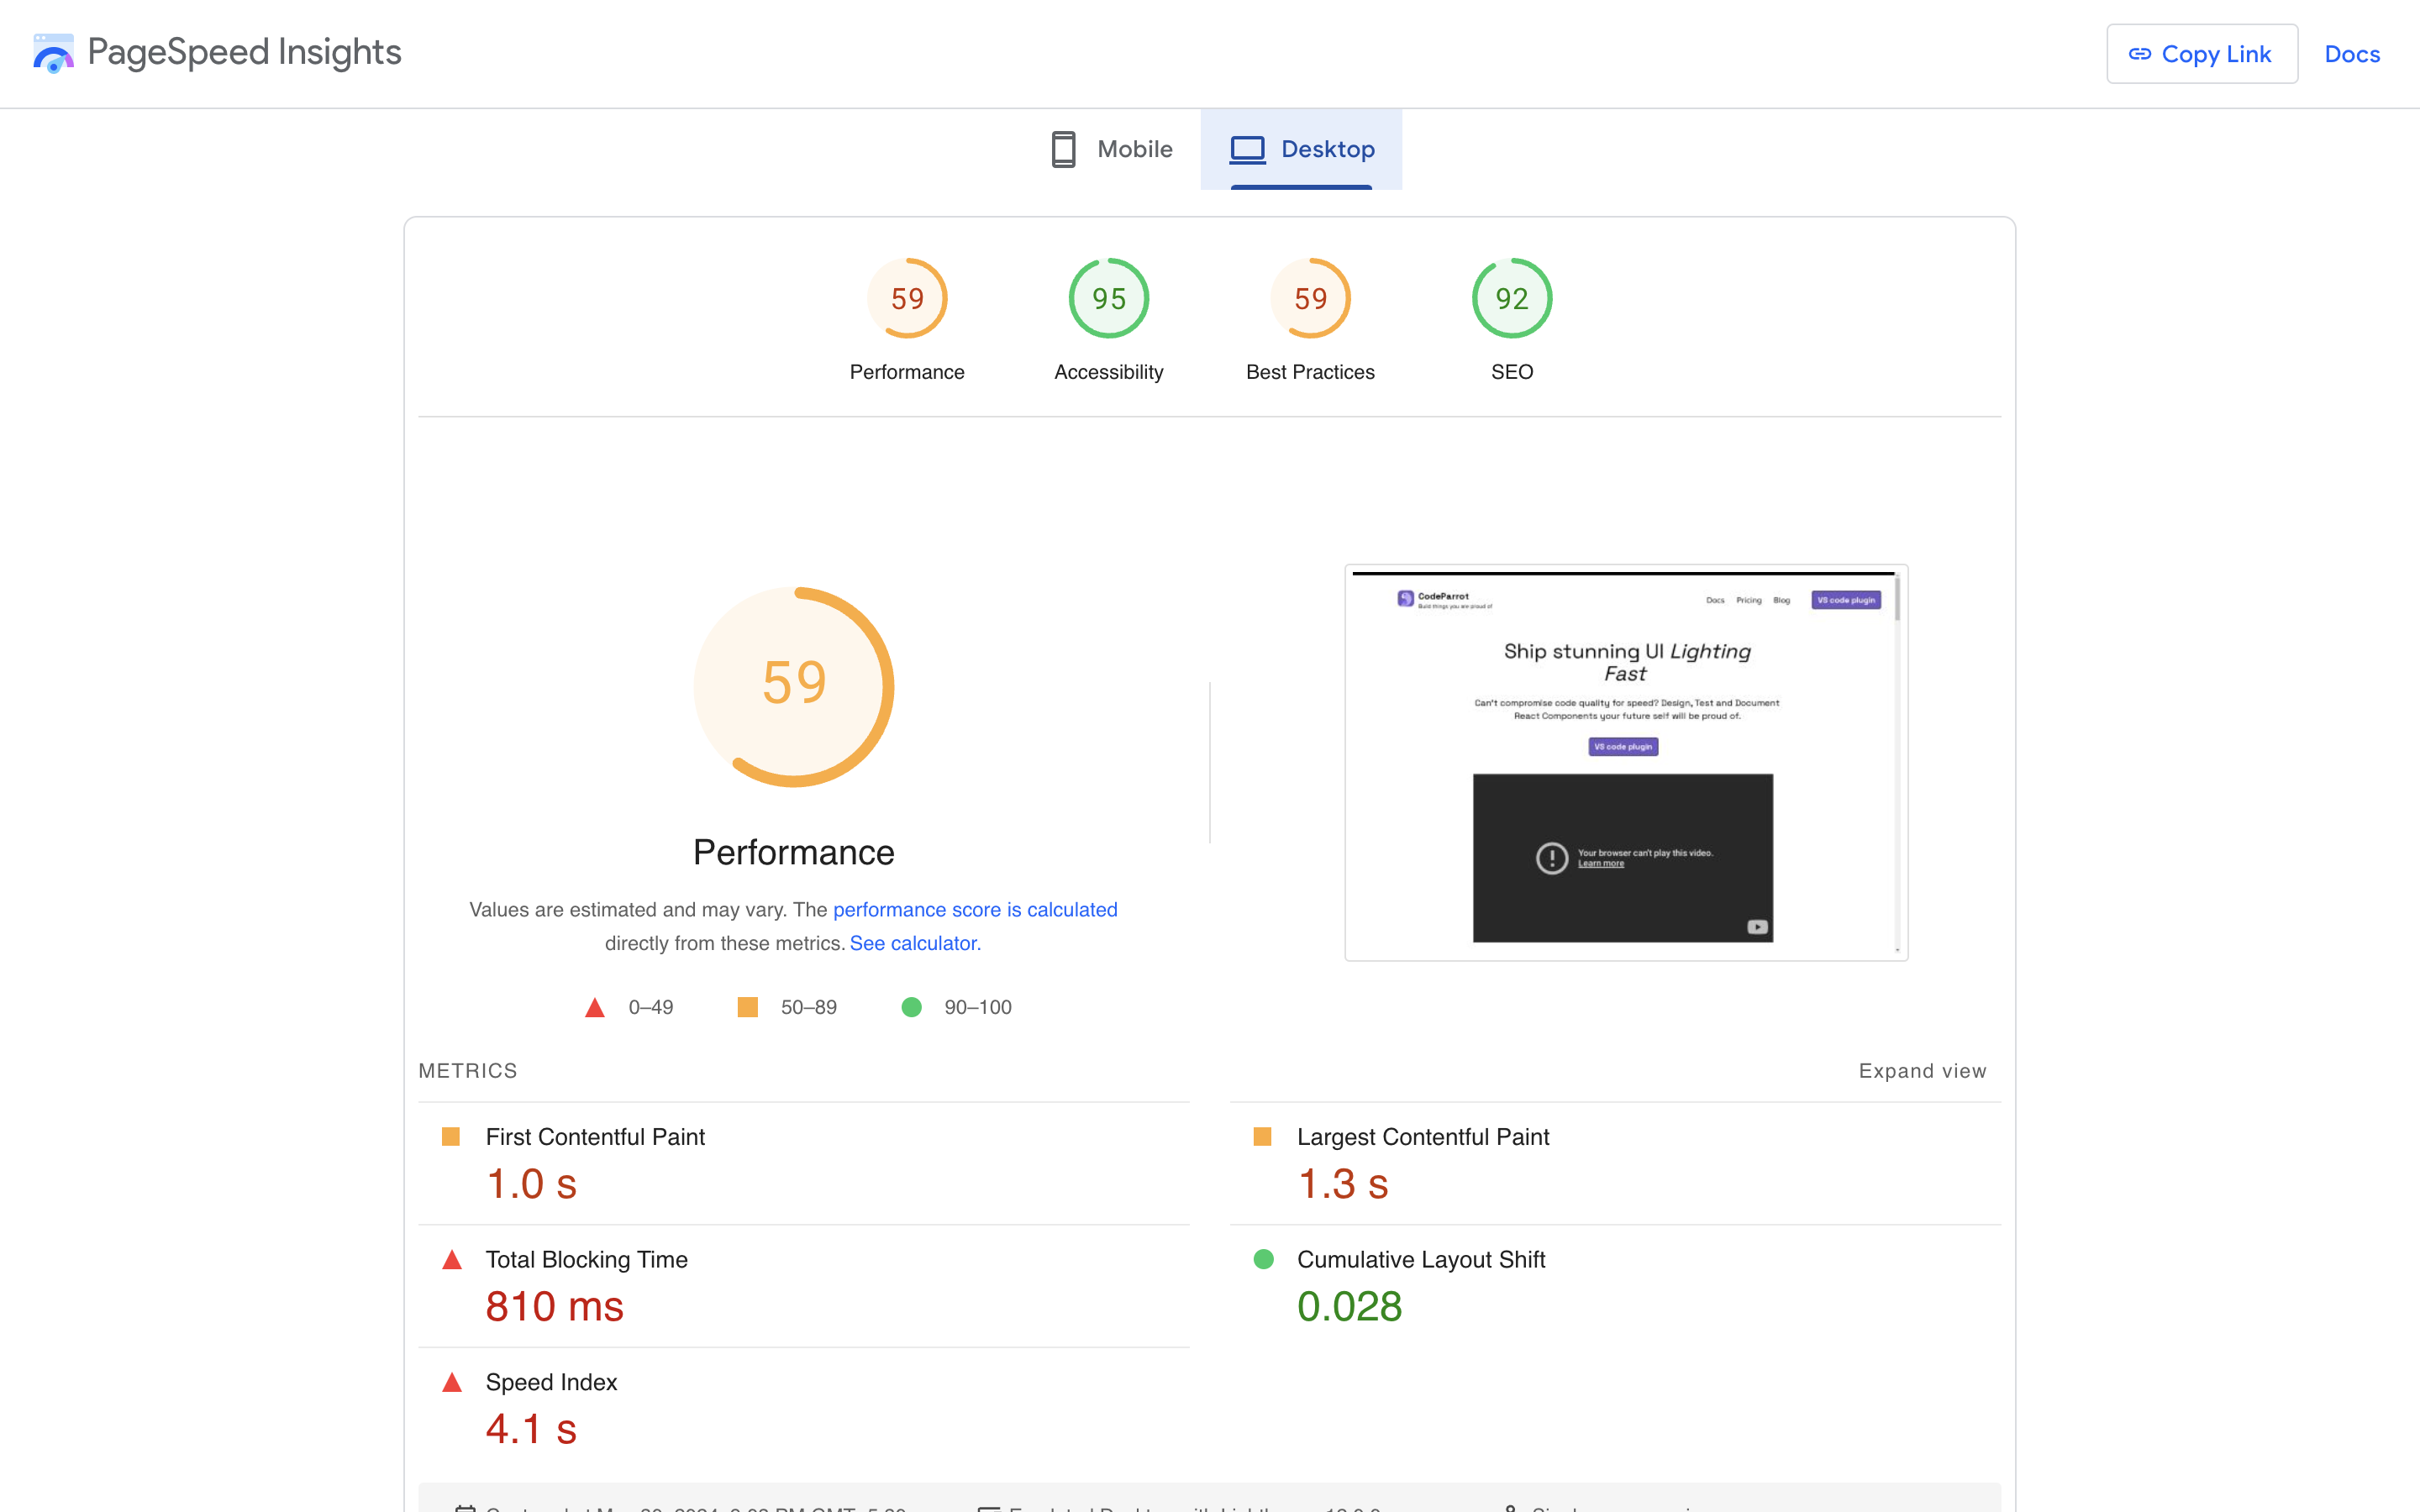
To measure Web Vitals, simply enter your website URL into Google PageSpeed Insights, and you’ll get a detailed report. Here’s an example report for codeparrot.ai:

Analyzing PageSpeed Insights Report
Performance Metrics Breakdown
First Contentful Paint (FCP): 1.0 s
- FCP measures the time it takes for the first piece of content to be rendered on the screen.
- Status: Good. This is within the recommended time frame of under 1.8 seconds.
Largest Contentful Paint (LCP): 1.3 s
- LCP measures the time it takes for the largest content element visible in the viewport to be rendered.
- Status: Good. This is within the recommended time frame of under 2.5 seconds.
Total Blocking Time (TBT): 810 ms
- TBT measures the total time that the main thread is blocked, preventing user input.
- Status: Needs Improvement. The recommended TBT is under 200 milliseconds.
Speed Index: 4.1 s
- Speed Index shows how quickly the contents of a page are visibly populated.
- Status: Needs Improvement. The recommended Speed Index is under 3 seconds.
Cumulative Layout Shift (CLS): 0.028
- CLS measures the visual stability of the page, indicating how much the page layout shifts unexpectedly.
- Status: Excellent. This is well within the recommended threshold of under 0.1.
Differences Between Lighthouse and Web Vitals
Results Comparison
In the Lighthouse report, the performance score was 91, whereas the PageSpeed Insights report showed a performance score of 59. Why the big difference? It comes down to the environments and specific metrics each tool prioritizes.
Why Lower Score in Web Vitals?
The lower score in Web Vitals can be attributed to higher Total Blocking Time (TBT) in the PageSpeed Insights report. This suggests that while the initial loading times (FCP and LCP) are good, the page struggles with interactivity and responsiveness—possibly due to heavy JavaScript execution or blocking resources.
Scope and Purpose
Lighthouse:
- Comprehensive Audits: It covers performance, accessibility, best practices, SEO, and Progressive Web App (PWA) features.
- Developer Tool: Designed to provide detailed insights into various aspects of a website, beyond just performance.
Web Vitals:
- Focused Metrics: Specifically targets key user experience metrics that have a strong correlation with the overall user experience.
- User-Centric: Aims to quantify and improve the user experience by focusing on loading speed, interactivity, and visual stability.
Key Metrics
Lighthouse Metrics:
- Performance Metrics: FCP, LCP, Speed Index, TBT, CLS.
- Accessibility Metrics: Checks for color contrast, ARIA roles, screen reader support.
- Best Practices: Assesses deprecated APIs, secure resource loading, optimized JavaScript.
- SEO: Evaluates meta tags, descriptive link text, crawlability.
- PWA: Checks for features like offline support, service workers, manifest files.
Web Vitals Metrics:
- Largest Contentful Paint (LCP): Measures loading performance.
- First Input Delay (FID): Measures interactivity.
- Cumulative Layout Shift (CLS): Measures visual stability.
Usage Scenarios
Lighthouse:
- Development and Testing: Ideal for developers needing comprehensive audits of their website’s performance and quality.
- Continuous Integration: Can be integrated into CI/CD pipelines to ensure code changes don’t degrade the website’s performance or quality.
- Broader Analysis: Useful for a wide range of checks beyond performance, such as accessibility and SEO.
Web Vitals:
- User Experience Optimization: Best for monitoring and optimizing core user experience aspects—loading speed, interactivity, and visual stability.
- Real-World Data: Often used with field data from tools like Google’s Chrome User Experience Report (CrUX) and real user monitoring (RUM) tools.
- Simplified Metrics: Provides clear, focused metrics that are easy to understand and prioritize.
Data Collection
Lighthouse:
- Lab Data: Simulates page loads in a controlled environment, providing consistent, repeatable metrics. Useful for debugging and pre-live testing.
- Controlled Conditions: Results may differ from real-world user experiences, especially if there are significant differences in network conditions and device capabilities.
Web Vitals:
- Field Data: Relies on metrics captured from real user interactions, providing an accurate picture of how users experience the site.
- Variability: Reflects real-world conditions, which can vary based on user devices, network speeds, and other factors.
Conclusion
Both Lighthouse and Web Vitals are essential for web performance optimization, but they serve different purposes. Lighthouse offers a comprehensive audit tool covering multiple aspects of web development, while Web Vitals focuses on the core metrics that matter most to user experience. By leveraging both tools, you can ensure your website is both high-performing and user-friendly, meeting the needs of search engines and end-users alike.
Subscribe to my newsletter
Read articles from Gautam Vaja directly inside your inbox. Subscribe to the newsletter, and don't miss out.
Written by
