Akamai TrafficPeak; Ingesting Logs, Creating Dashboards and Analyzing Data
 Mike Elissen
Two months ago, I wrote about Akamai TrafficPeak, the new Akamai observability solution built by Hydrolix. Having the ability to ingest millions of Akamai logs, store them forever, show them in a variety of out-of-the-box or customized dashboards and analyze traffic patterns to improve your applications can be a powerful tool in both your Performance or Security strategies.
After working with the Hydrolix team and running dozens of Proof of Concepts, our team has created several helpful TrafficPeak videos, hosted by Mike Ostenberg, which can help you get the most out of your Akamai TrafficPeak solution.
If you are an existing Akamai customer or partner and are interested in trying out Akamai TrafficPeak, please get in touch with your account team, who can help with setting up a POC tenant for you.
If you have access to a TrafficPeak POC tenant, you will want to ingest your Akamai logs (either through Akamai DataStream for all delivery logs or Akamai SIEM for all security events) into TrafficPeak. You should have also received an email with a custom TrafficPeak URL, username and password.
In order to start sending Akamai DataStream logs to TrafficPeak, you will want to follow these steps:
Login to Akamai Control Center and navigate to DataStream and create a new DataStream by following the wizard tool.
Name your stream.
Select your Akamai properties (delivery configurations).
Select your log data sets (recommended is to select all).
Make sure the log format is set to JSON.
Select the 'Custom HTTPS' endpoint.
Select 'BASIC' Authentication.
Add your TrafficPeak URL to the Endpoint URL as well as username and password.
Enable 'Send Compressed Data'.
Under Additional Options, Custom Header Content Type, select application/json.
Activate your DataStream configuration.
Navigate to Properties, select your property and create a new version.
Add a new Blank Rule named DataStream.
Add the behavior DataStream.
Select the Enable On, select the DataStream name and leave Sampling Rate to 100.
Add the behavior Log Request Details.
Select the logging information you desire (recommended to enable all).
Save your configuration and deploy to Akamai Staging and/or Akamai Production.
Once both DataStream configuration and the new property version are deployed to Akamai Production, you should be seeing logs coming into TrafficPeak.
In order to start sending Akamai security events to TrafficPeak, you will need to enable the Akamai SIEM API. Our TechDocs platform has an excellent guide to enable SIEM API, which you can find here.
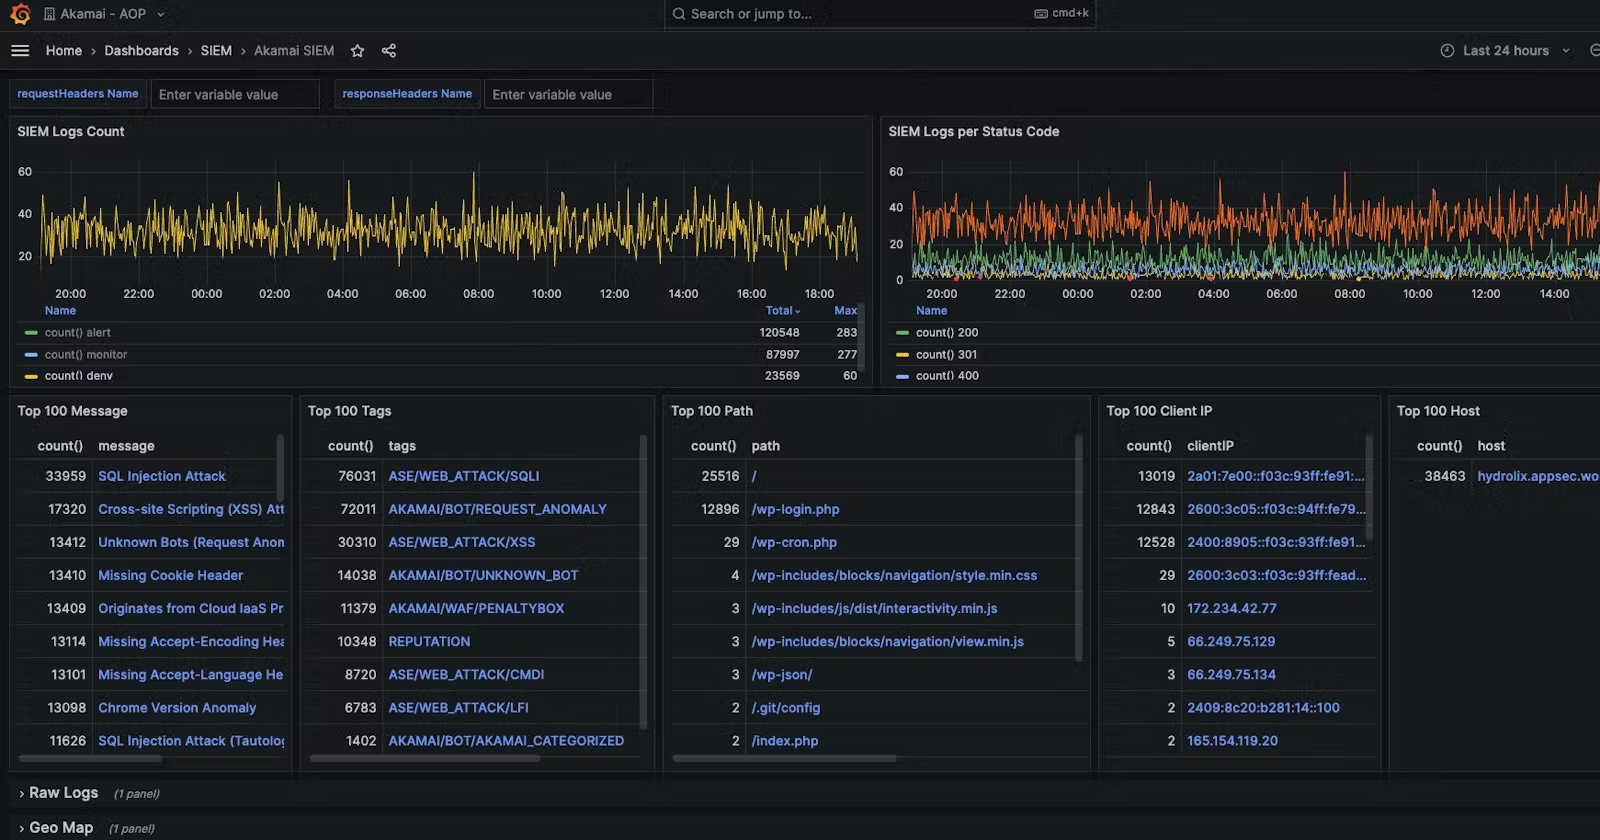
With the Akamai log data coming into TrafficPeak, you will want to make the most of it. TrafficPeak comes out-of-the-box with several helpful dashboards in Grafana. The great thing about Grafana is that it allows you to fully customize any dashboards according to your team's needs in their Query engine.
Both the Grafana Dashboards docs and the video shown above will help you create the dashboards you need.
In short, you have the ability to add any type of filters based on all the data sets / log types that are entering. For instance, you can filter on the hostname, or URL/path, or from which country the requests are coming in, or requests that are in the 4xx/5xx response series.
Your Akamai account team can also help with creating dashboards and share recommendations
One of the common use-cases for TrafficPeak is to analysis the Akamai cache hit/miss ratios, Akamai started as a Content Delivery Network after all. Optimizing the cache ratios, can help you improve offload, reduce hits required to be handled by your origin infrastructure and improve the end-user performance.
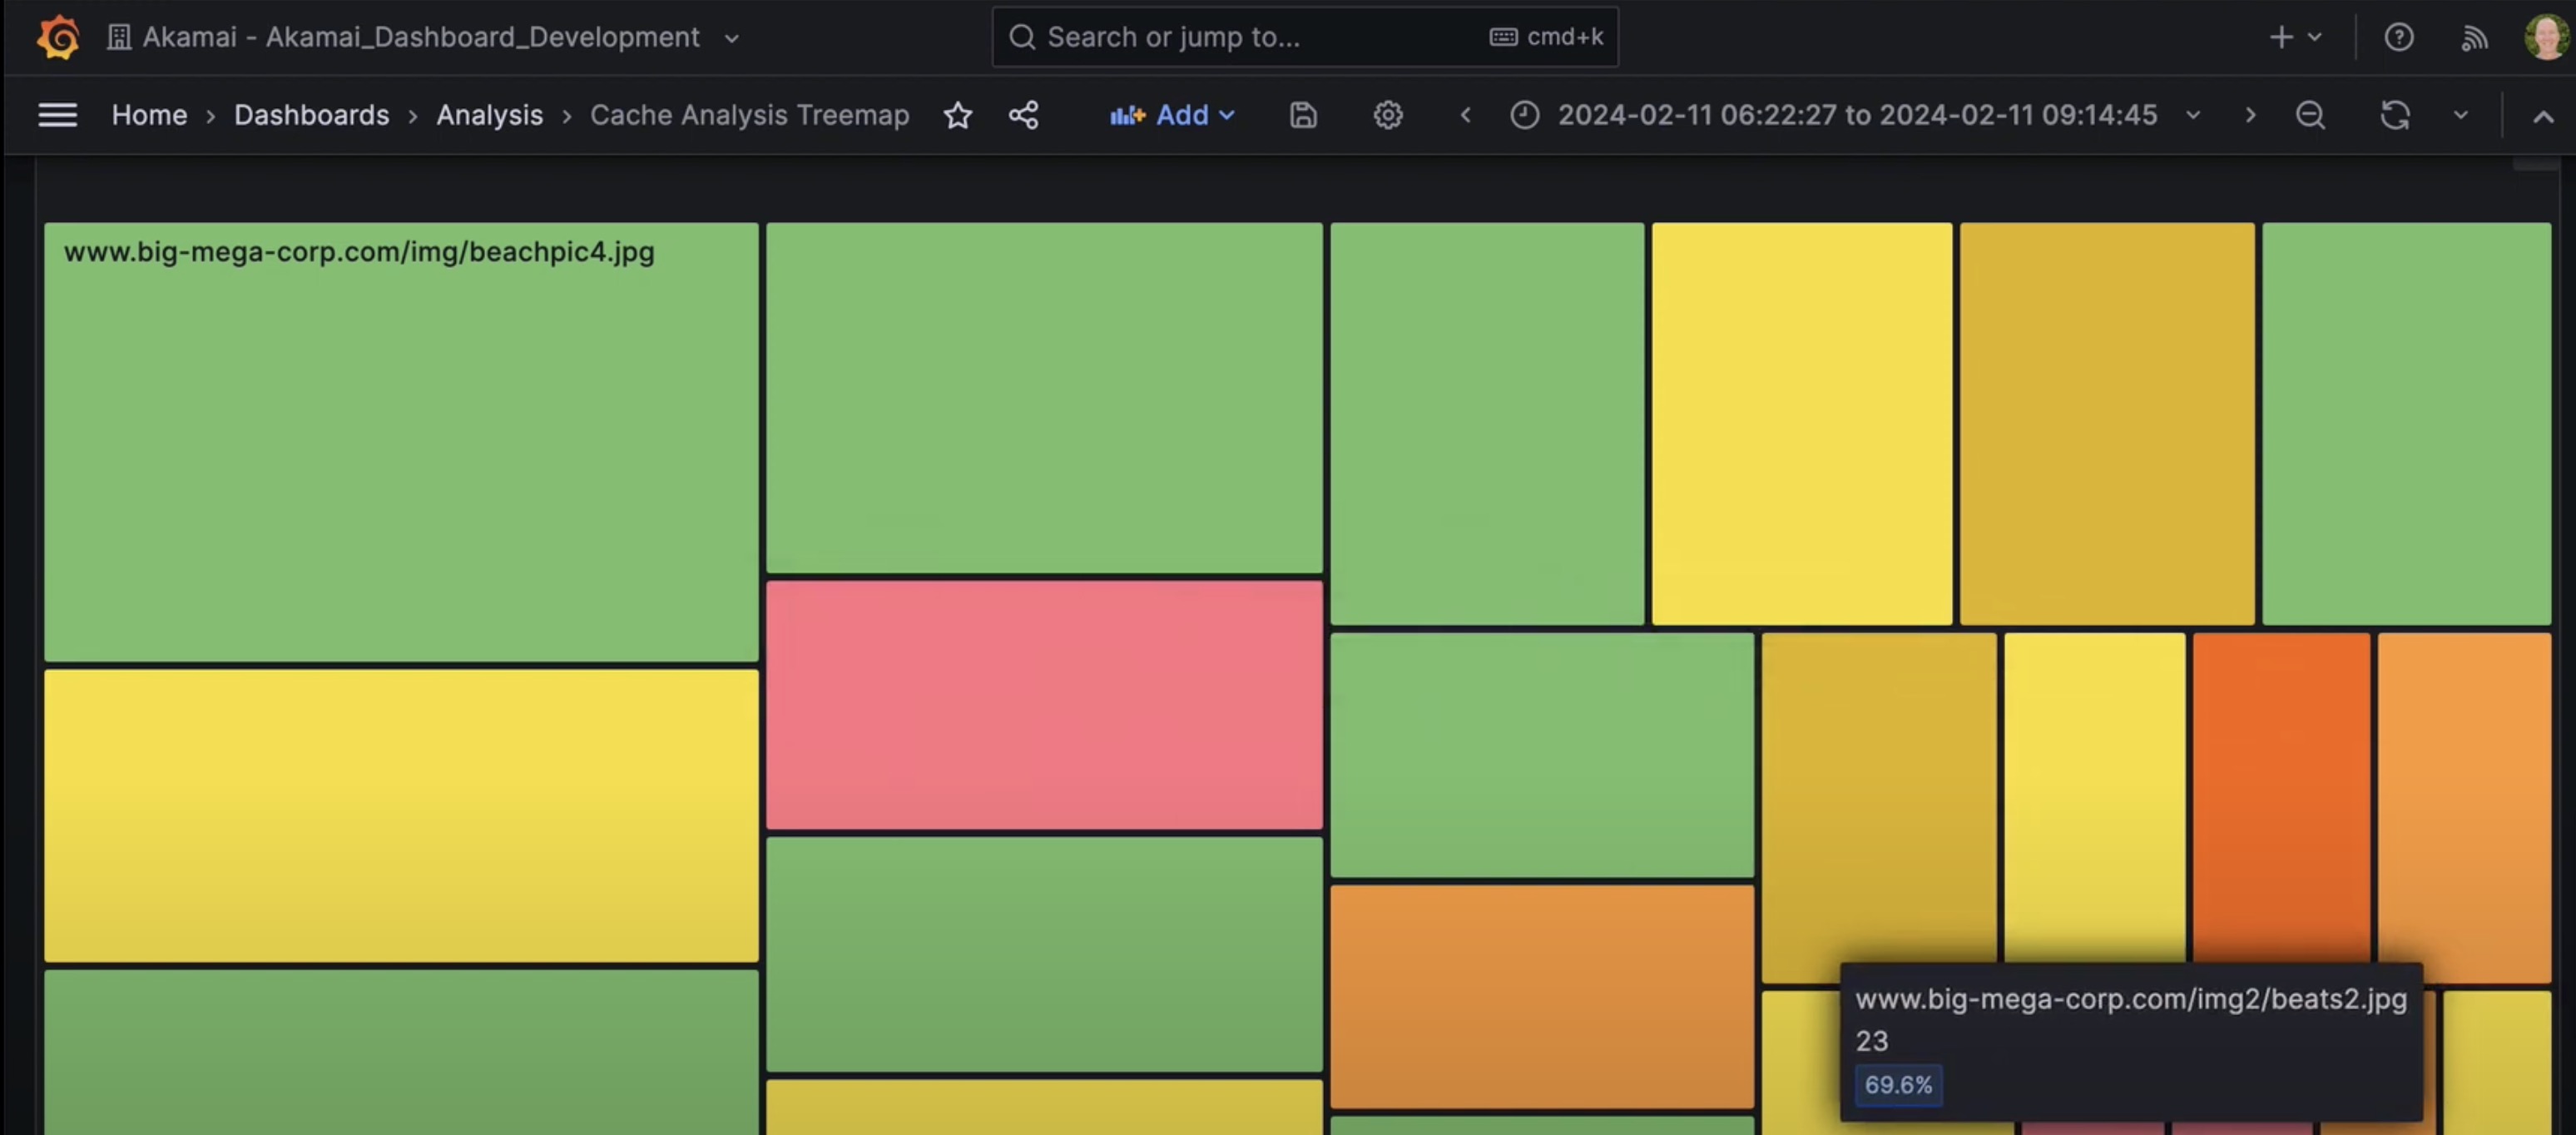
The built-in Cache Analysis Treemap dashboard will be a great start to dive deeper into your hostname cache ratios. The treemap will give a great high-level overview breaking down the cache ration into good (green color) to bad (red color).
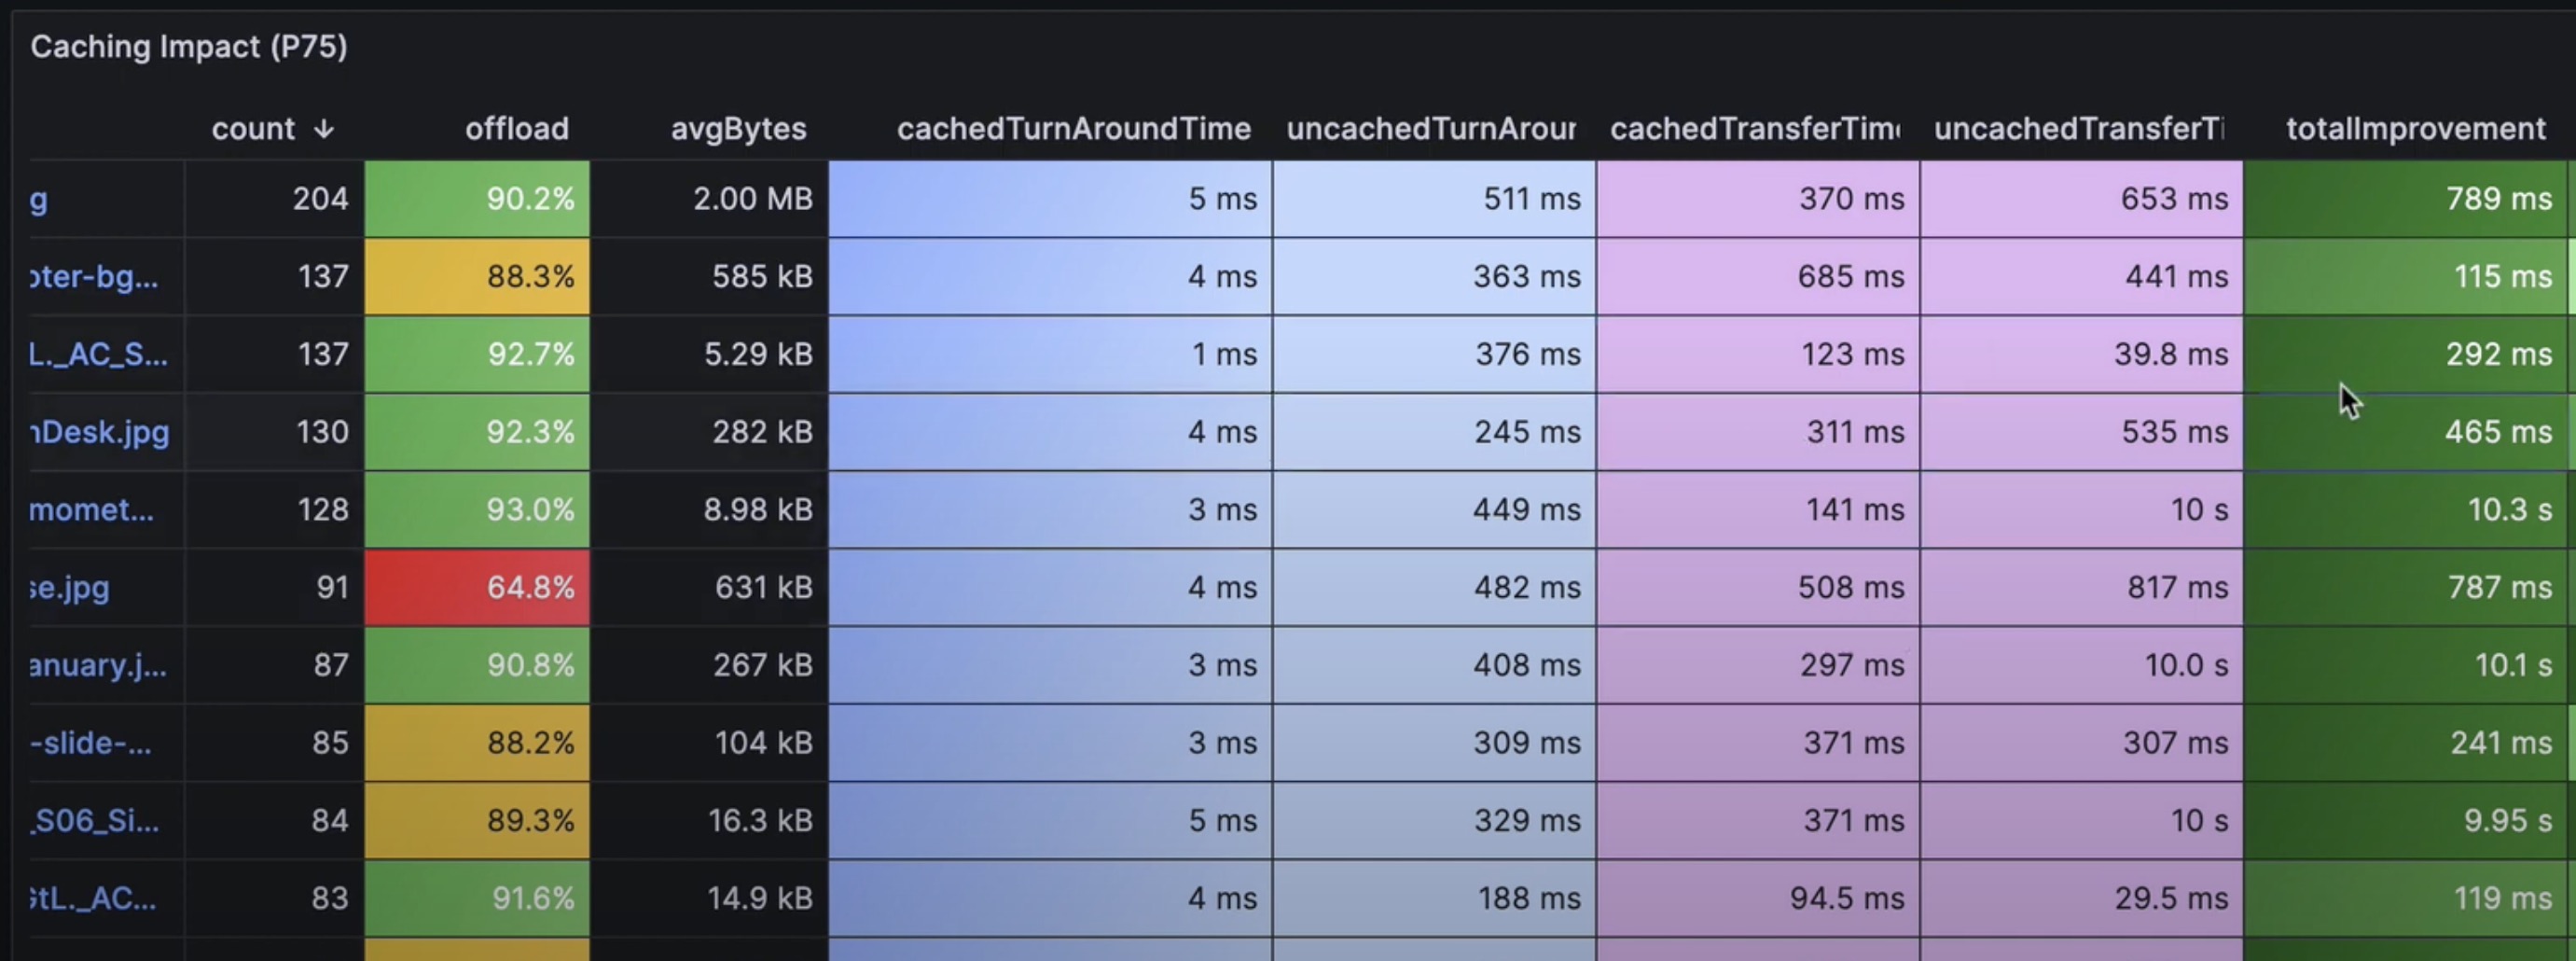
Finding the 'largest objects' with the 'lowest offload' will be a good start on tackle the offload. There could be different reasons why it is not being cached of course, which you can tune in the Akamai delivery configuration by creating specific caching rules.
Cache optimization is definitely a recommended exercise and something to take into account for a subsequent application release. Development teams might have released new content that aren't being cached properly which in turn could lead to performance issues for your end-users.
Similarly to cache optimization, another important easy action would be to HTTP error rate optimization. The 'Error Analysis' dashboard will be the right dashboard for the job.
Another treemap will be available here that can be filtered based on hostname and will share URLs that trigger a high rate of 4xx/5xx responses in the timeframe you have selected.
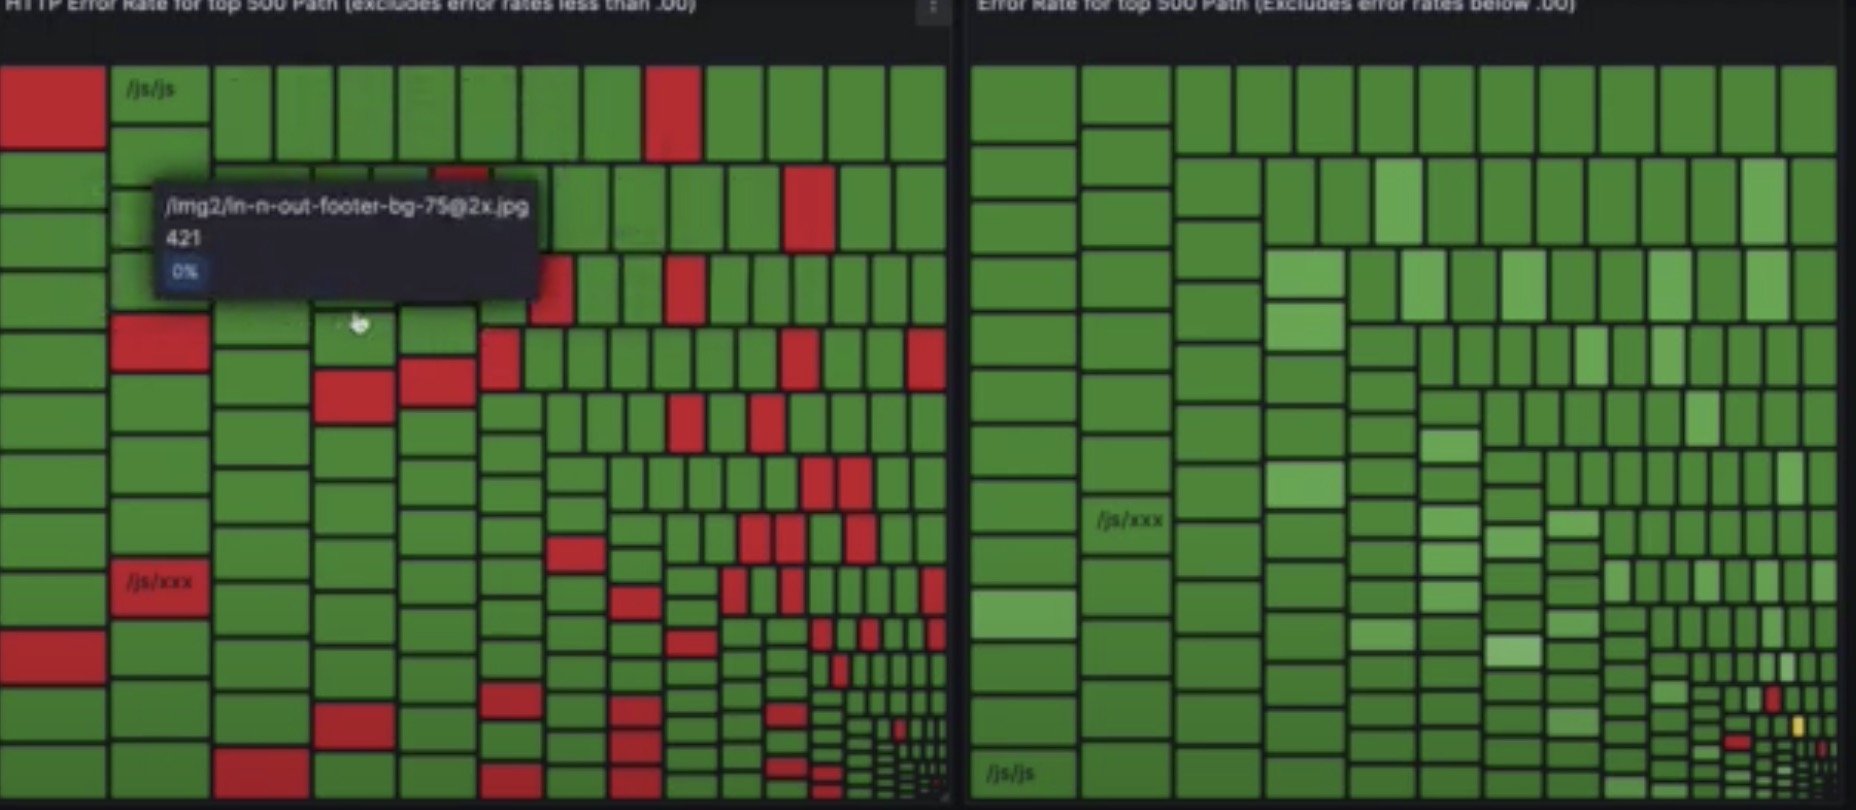
Finding URLs that are triggering high rates of errors should be easy with this treemap. You can drill down on the reasons why this URLs is triggering. The most common issue is that every user is seeing issues and all 100% of the requests to this URL are failing. This might be because the file has since been removed but still referenced in any of the HTML files.
Alternatively, it could also be related to device or browser type, which is another common issue. TrafficPeak is making it easy to find these issues, easier than running your own log ingest and observability solution because everything is ready to go as an out-of-the-box solution.
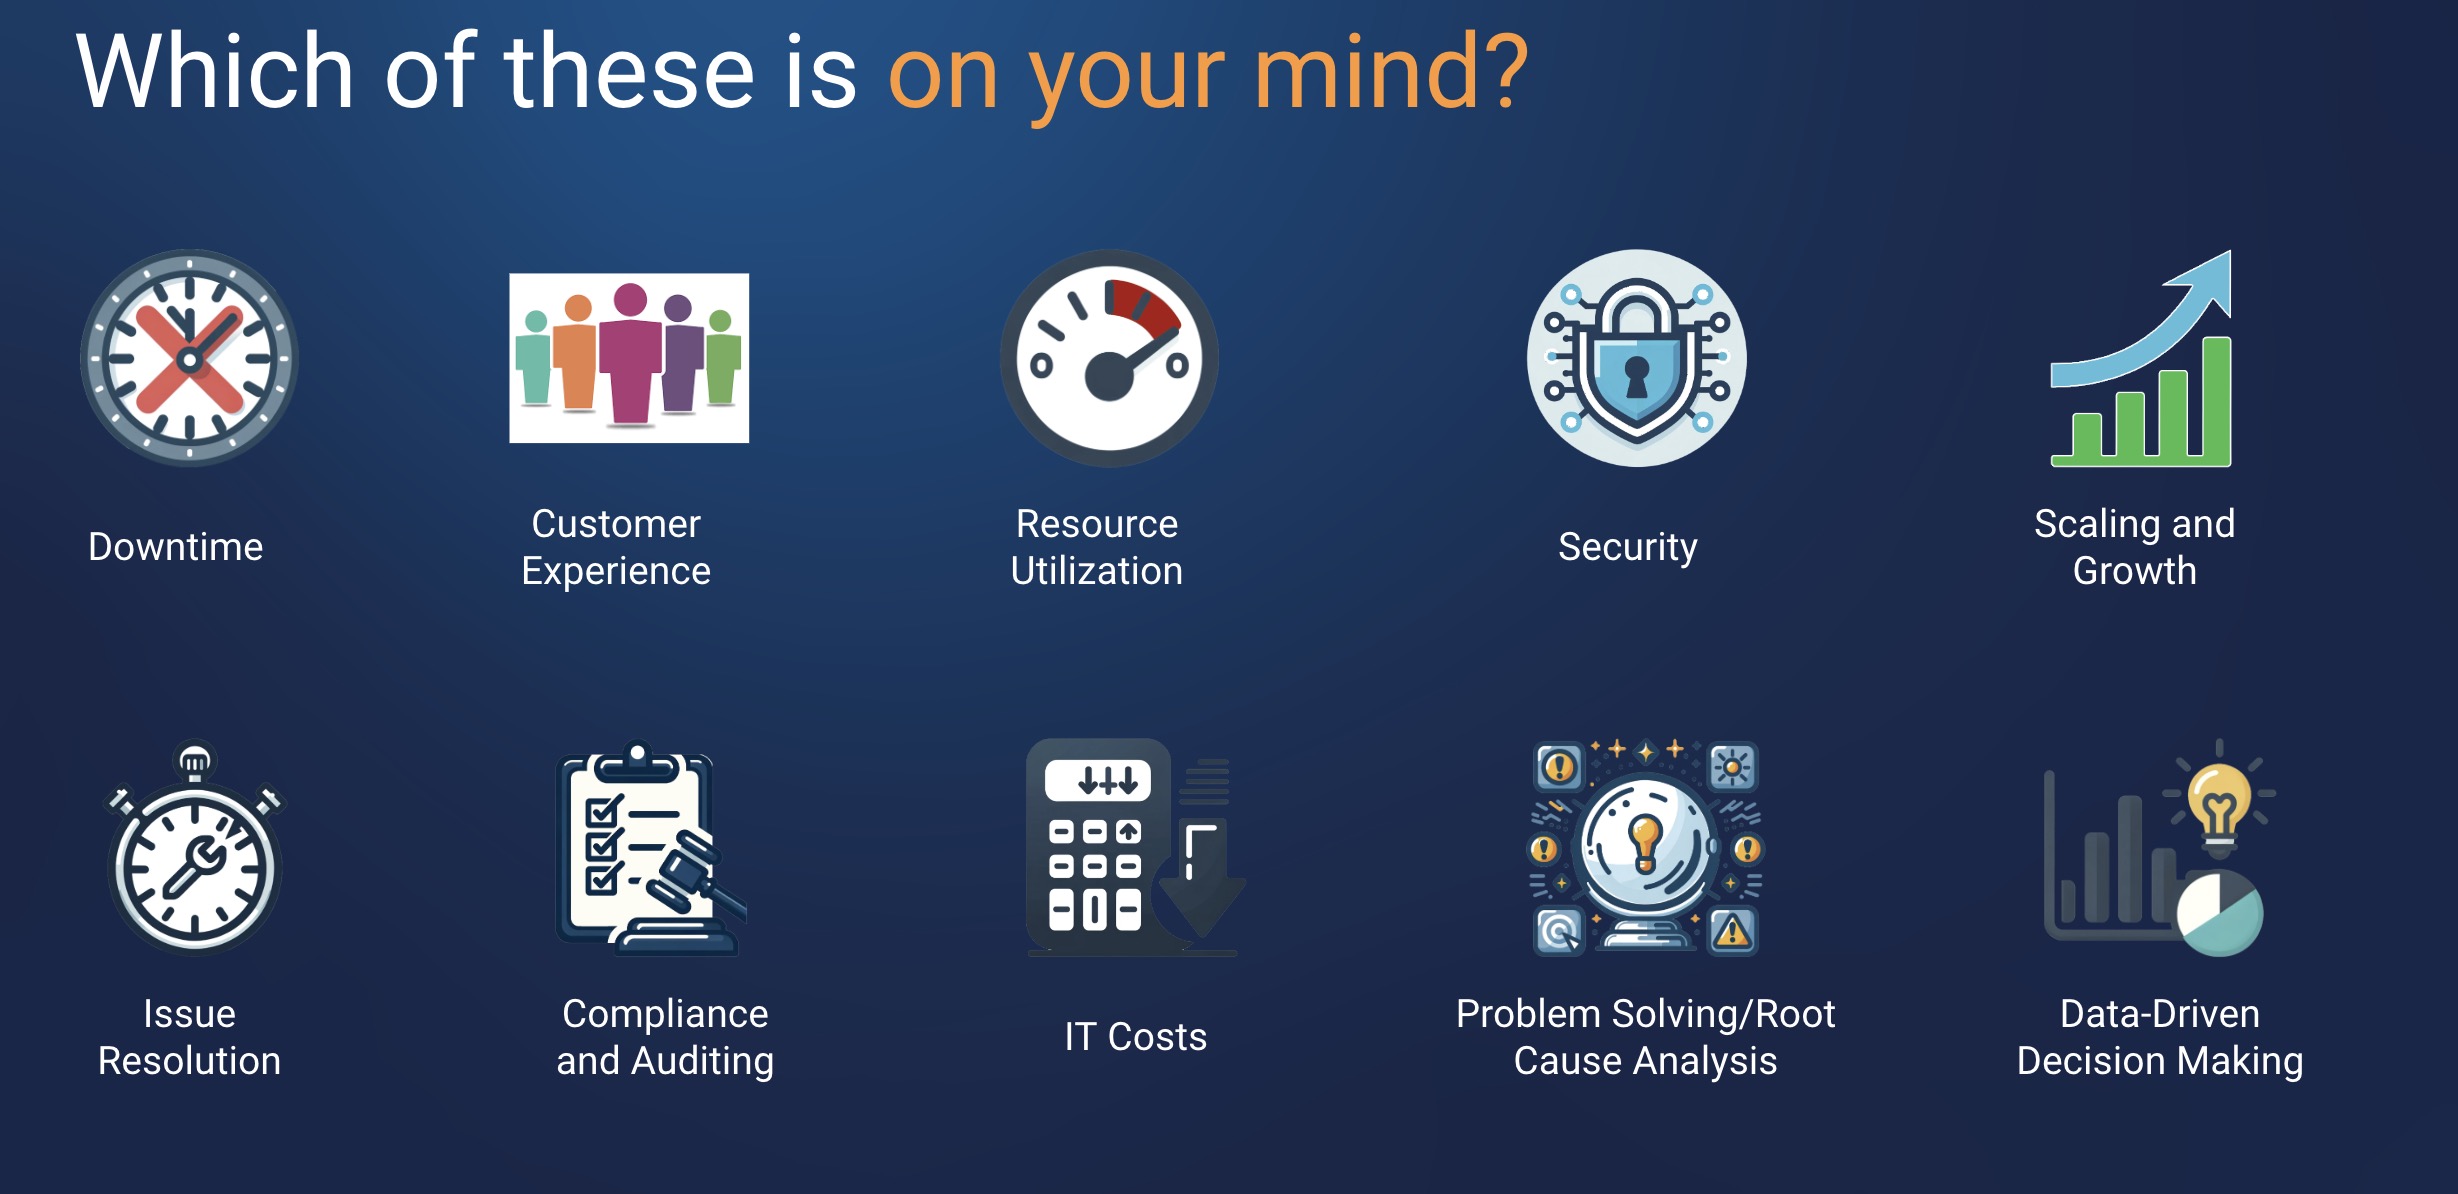
Of course, these are just are just the 'tip-of-the-iceberg' on how you can utilize Akamai TrafficPeak. With the ability to store all your Akamai log, typically longer and cheaper as alternative observability platform, it can tremendously help your to tune the performance, improve the security and help with abuse, auditing, compliance and other types of root cause analysis.
Akamai TrafficPeak has already proven itself as a very helpful observability platform for many of our customers and partners with benefits ranging from operational benefits to financial benefits.
For instance, a large media customer was able to not only achieve a 75% cost reduction from their observability budget but also able to optimize their multi-CDN performance through analyzing the logs in a much easier fashion.
Another use-case was from a large consumer electronics retailer who was able to apply TrafficPeak during the 'Black Friday' shopping season and analyze the traffic and find malicious IPs that were trying to cause a disruption to the web applications in combination with Akamai's App & API Protector solutions, these attacks were swiftly dealt with.
So where can you go from here?
For documentation on Akamai TrafficPeak: https://hydrolix.io/ & https://docs.hydrolix.io/docs/welcome
For further deep-dive, please watch the videos from my colleague Mike:
If you are an existing Akamai customer or partner and are interested in trying out Akamai TrafficPeak, please get in touch with your account team, who can help with setting up a POC tenant for you.
Thanks to Mike Ostenberg for the invaluable deep-dive videos and thanks to Hydrolix for adding TrafficPeak to the toolbox!
Subscribe to my newsletter
Read articles from Mike Elissen directly inside your inbox. Subscribe to the newsletter, and don't miss out.
Written by

Mike Elissen
Mike Elissen
In today's world, it is difficult to stay secure with your applications, APIs and data. I can help you. Mike Elissen, Developer Advocate @ Akamai Technologies.