Unveiling the Power of Statistics: Mastering Data Science - Part 05
 Naymul Islam
Margin Of Error - ME👇
When the population variance is known, the margin of error is equal to his expression -

When the population variance is unknown the expression is -

The confidence interval could be summarized as follows -
The true population mean falls in the interval defined by the sample mean(±) the margin of error(ME) -

Getting a smaller margin of error means that the confidence interval would be narrower
A smaller margin of error = Narrower confidence interval
As we want a better prediction it is in our interest to have the narrowest possible confidence interval
we can control the margin of error.
the statistics and the standard deviation are in the numerator, so smaller statistics and smaller standard deviations will reduce the margin of error.
A higher level of confidence increases the statistics, A higher statistics mean a higher margin of error. This leads to a higher confidence interval.
Bigger margins of error = wider confidence interval
A lower standard deviation means that the dataset is more concentrated around the mean, so we have a better chance to get it right.
Larger sample sizes will decrease the margin of error. The more observation you have in your sample the more certain you are in the prediction.
The more observations there are in the sample, the higher the chances of getting a good idea about the true mean of the entire population.
Confidence Intervals; Two means; Dependent Sample👇
A few important distinctions need to be made before we dive into this topic-
In some cases, the sample that we have taken from the two populations will be dependent on each other, and in others, they will be independent.
Dependent samples are easier.
We can have the same people but in samples relating to different things. So instead of a before and after situation we are looking at cause and effect.
Example-
When applying to a university in the U.S., you sit the SAT, and based on it you either get admitted or you don't. The applicant is the same person. However, the samples are different one relates to the SAT, and the other to the admittance outcome.
In terms of testing, we have one formula for confidence intervals for dependent samples and other statistical methods like regression.
When we have independent samples we can further distinguish three cases-
Population variance is known
Population variance is unknown but assumed to be equal
Population variance is unknown but assumed to be different.
Depending Samples👇
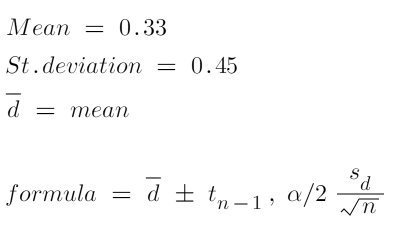
The statistical test is often used when developing medicine. Let's say you have developed a pill that increases the concentration of magnesium in the blood, It is very promising but there is no data to support your claim after testing the drug in a laboratory. It is time to see its actual effect on people. What you would typically do is take a sample of 10 people and test their magnesium levels before and after taking the pill. The two dependent samples are the magnesium levels before and the magnesium levels after when dealing with immediately assume that such variables are normally distributed.
For Example -
| Before | After | Difference |
| 2.00 | 1.70 | -0.30 |
| 1.40 | 1.70 | 0.30 |
| 1.30 | 1.80 | 0.50 |
| 1.10 | 1.30 | 0.20 |
| 1.80 | 1.70 | -0.10 |
| 1.60 | 1.50 | -0.10 |
| 1.50 | 1.60 | 0.10 |
| 0.70 | 1.75 | 1.05 |
| 0.90 | 1.70 | 0.80 |
| 1.50 | 2.40 | 0.90 |

Confidence Intervals; Two means; Independent Sample👇
As we said earlier, there are 3 sub-cases -
Known population variances
Unknown population variances but assumed to be equal
Unknown population variances but assumed to be different.
Now we will focus on the 1st case -
Example:
We would like to test the grades of two departments in the UK University.
P.T.B.N: University grades in the UK expressed in percentages.
Our samples are taken from two departments Engineering and Management
| Engineering(x) | Management(y) | Diff.(x-y) | |
| Size | 100 | 70 | ? |
| Sample Mean | 58 | 65 | -7.00 |
| Population Std. | 10 | 5 | 5.00 |
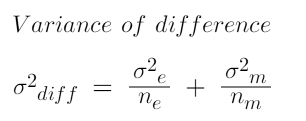
From past years, we know that the population standard deviation is 10% points, Thus the variance is known and the population standard deviation is 5%.
Considerations 👇
The populations are normally distributed
The population variances are known
The sample sizes are different
The grade of a person in engineering doesn't in any way affect the grade of a person studying management and that's why the two samples are truly independent.
Problems: We want to find a 95% confidence interval for the difference between the grades of the students from engineering and management.
In this case,
Samples are big
Population variance is known
Population is assumed to follow the normal distribution
All this information points us to the 'z-statistics'.
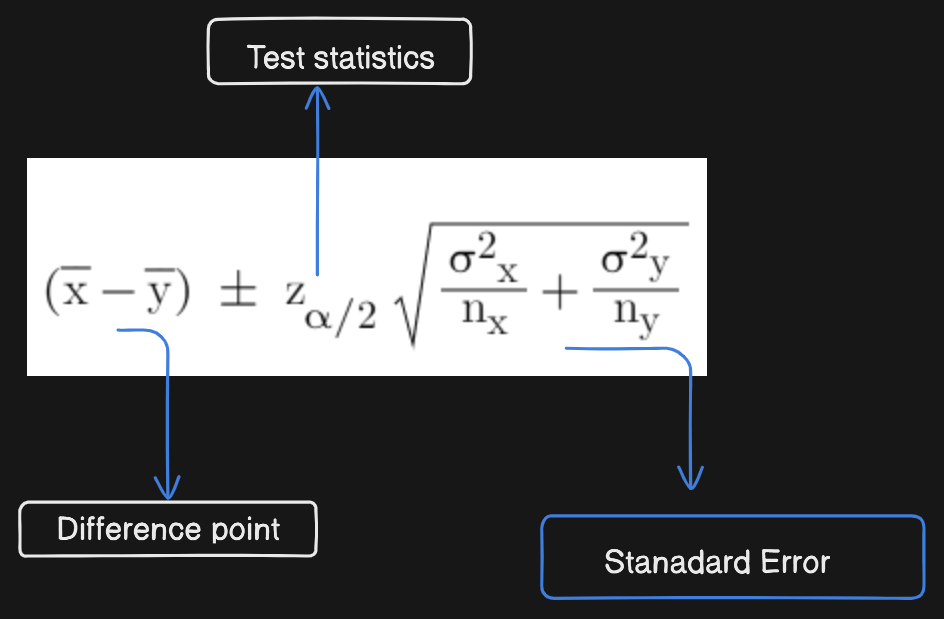
Formula:

from the upper example, the formula of confidence interval is -

Takeways👇
We are 95% Confident that the true mean difference between engineering and management grades falls into this interval.
The whole interval is negative => Engineering was consistently getting lower grades.
Had we calculated the difference as :
For 'Management - Engineering' we would get a confidence interval :(4.72,9.28)
It's completely symmetrical around 0.
Confidence Intervals - Population variance unknown but assumed to be equal👇
Problem: Estimate the difference in the price of apples in NY and LA.
You go to 10 grocery shops in New York and your friend Paul who lives in LA visits eight grocery stores. In order to help you with the research.
| NY Apples | LA Apple |
| 3.80 | 3.02 |
| 3.76 | 3.22 |
| 3.87 | 3.24 |
| 3.99 | 3.02 |
| 4.02 | 3.06 |
| 4.25 | 3.15 |
| 4.13 | 3.81 |
| 3.98 | 3.44 |
| 3.99 | |
| 3.62 |
You don't know what the population variance of apple prices in NY or LA is, but you assume it should be the same.
| NY | LA | |
| Mean | 3.94 | 3.25 |
| STD | 0.18 | 0.27 |
| Sample Size | 10 | 8 |
We assume that the population variances are equal. So we have to estimate them.
The unbiased estimator in this case is called the pooled sample variance and we can use the following formula to calculate it.
Pooled variance formula -

While it -
Population variance unknown
Small sample
and it refers to T-Statistics.
Here is the formula for the confidence interval -

The degree of freedom is equal to the total sample size - the number of variables -

Before we end…
Thank you for taking the time to read my posts and share your thoughts. If you like my blog please give a like, comment, and share it with your circle and follow for more I look forward to continuing this journey with you.
Let’s connect and grow together. I look forward to getting to know you better😉.
Here are my social links below-
Linkedin: https://www.linkedin.com/in/ai-naymul/
Twitter: https://twitter.com/ai_naymul
Github: https://github.com/ai-naymul
Subscribe to my newsletter
Read articles from Naymul Islam directly inside your inbox. Subscribe to the newsletter, and don't miss out.
Written by

Naymul Islam
Naymul Islam
👉 I'm an ML Research 7 Open-Source Dev Intern at Menlo Park Lab. 👉 I'm a Machine Learning and MLOps Enthusiast. 👉 I’m One Of The Semi-Finalist Of The Biggest ICT Olympiad In Bangladesh Called “ICT Olympiad Bangladesh” In 2022. 👉 I've More Than 15 Google Cloud Badges. ⭐️ Wanna Know More About Me? Drop Me An Email At: naymul504@gmail.com ★