Jenkins + JMeter = Love (Part 2)
 HarshKumar Jiladiya
In Part 1 of our series, we delved into the world of Jenkins, setting up automated jobs, integrating Git repositories, and leveraging Docker for seamless project builds. Now, armed with a robust CI/CD pipeline, it's time to take our software testing to the next level with JMeter. If you haven't gone through part1, I suggest you to have look at it once.
Table of contents
JMeter Test on local
Integrating JMeter with Jenkins
Analyzing Test Result
Conclusion
JMeter Test on local
Before delving into conducting JMeter tests locally, it's essential to have a foundational understanding of JMeter. I am not asking for much because to be honest i am not aware of much but you just have to aware about the Thread Group, Samplers and Listeners here is the basic defination of those.
Thread Group: The thread group defines the number of users (threads) and the ramp-up period (time taken to start all the threads) for your test.
Samplers: Samplers are used to simulate user actions like sending HTTP requests to the server. JMeter supports various types of samplers such as HTTP Request, FTP Request, JDBC Request, etc. We will be using HTTP request only.
Listeners: Listeners provide visual representations of test results. They allow you to view metrics like response time, throughput, and error rates in various formats such as tables, graphs, and trees.
You can easily download JMeter from their official website. The only prerequisite is having Java set up on your system
If your setup is ready, let's proceed to test our sample Node application, which is running on 'slave1'. For this, obtain the public IP of 'slave1' through AWS and create a new thread group in JMeter. In thread group keep Number of Threads(users) = 10.
In the Thread Group, add an HTTP request by navigating to Add > Sampler > HTTP Request. Name the request if desired. In the 'Server Name or IP' field under the 'Basic' section, enter the IP address of 'slave1'. Since our application is running on port 3000, keep the 'Port Number' as 3000. Specify the endpoint based on your website's endpoint. For example, if you're using my sample Node application, one of the endpoints is '/hugeData', so enter this into the 'Path' field. Set the request type via the 'Request type' dropdown (e.g., GET). That's it! You're all set to configure the HTTP Request section. Here is one image for your reference.
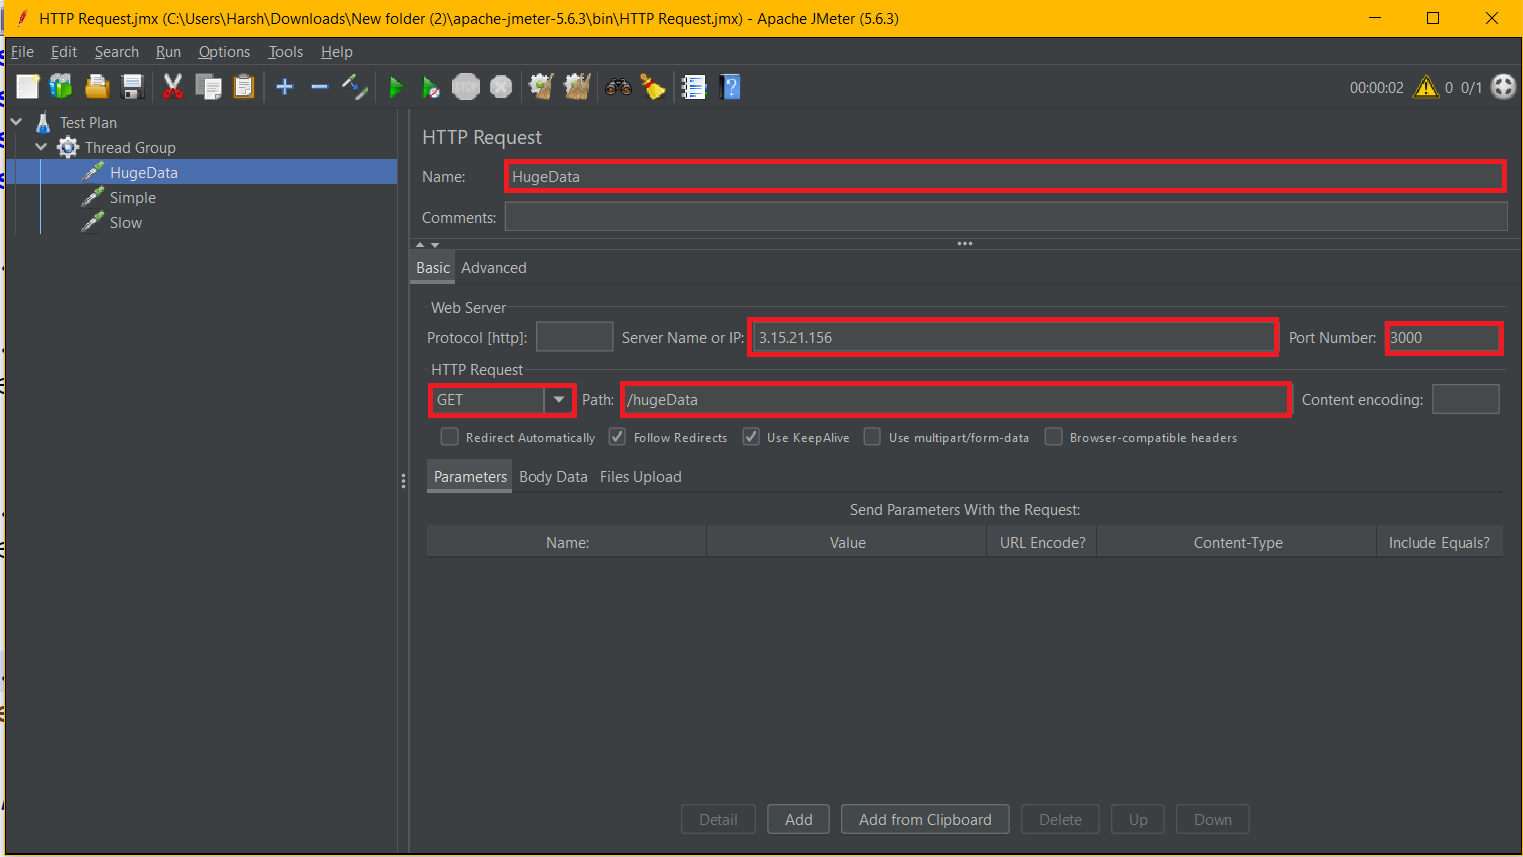
I have highlighted the fields which I update, and I have also added three more requests in the same way: Simple and Slow with endpoints /simple and /slow. The rest of the settings remain the same.
We have outlined what needs to be performed in JMeter, but to observe the test performance, we require results. To do so, we need to add listeners. There are many types of listeners, each providing detailed insights. In the HTTP request section, for demo purposes, I've included the bare minimum fields. JMeter offers full control to customize settings according to your requirements. Let's add listeners through Thread Group > Add > Listener > View Result Tree.
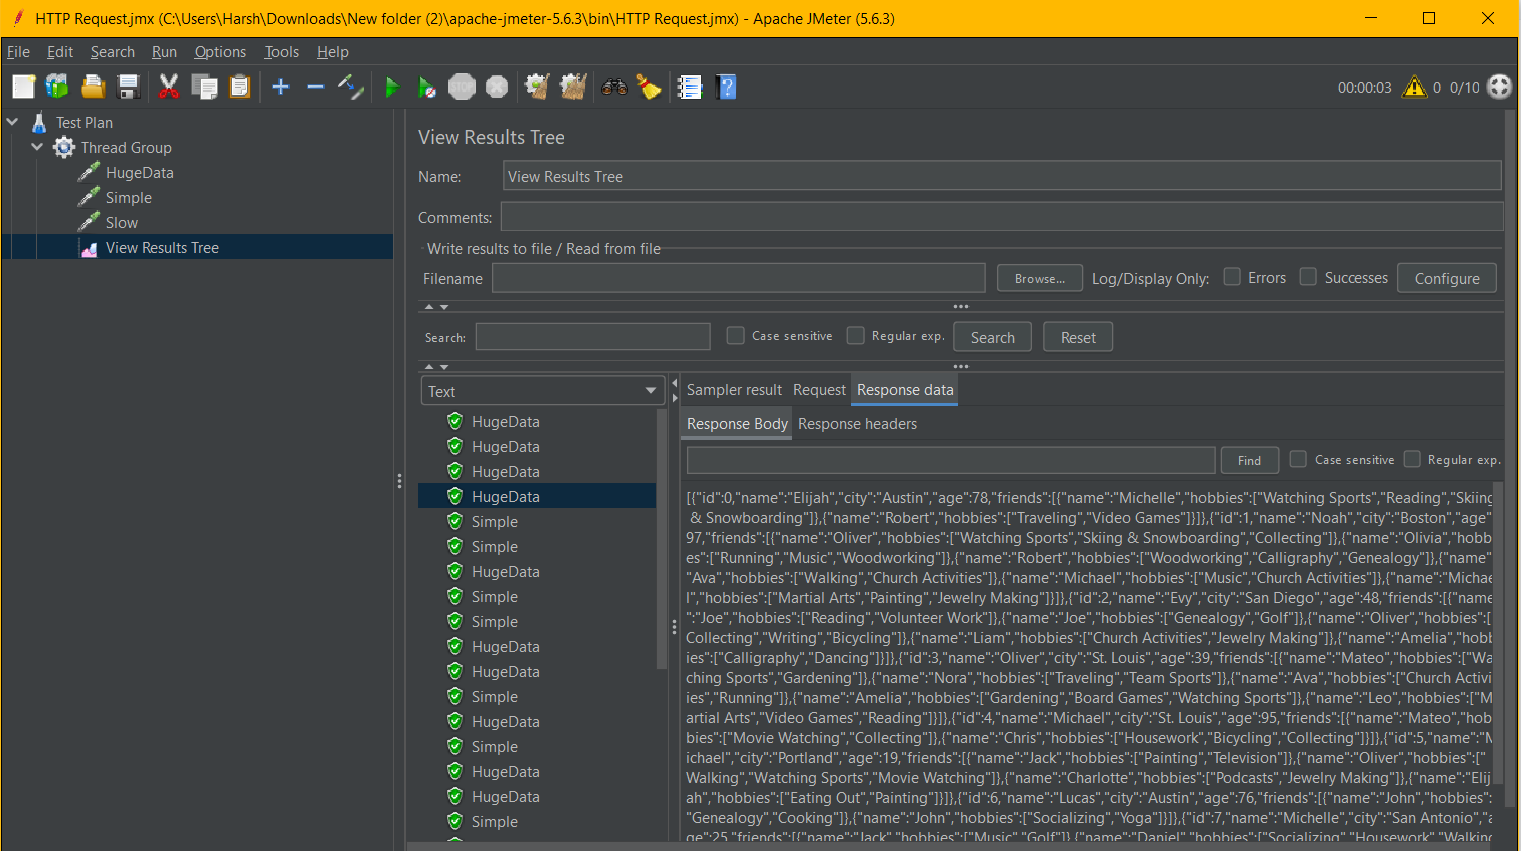
Finally, you can run your test. With users set to 10, it will send 30 requests (10 for each endpoint). View the results in the 'View Result Tree' section, where you can explore each request's responses, their response times, and other relevant details. Once complete, save the test using the save option, and a JMX file will be saved.
Now we just need to run the same test using command line as we need to perforom the same test into jenkins server. To do so cd to Jmeter/bin folder in local machine and hit below command
jmeter -n -t <path to new jmx file>
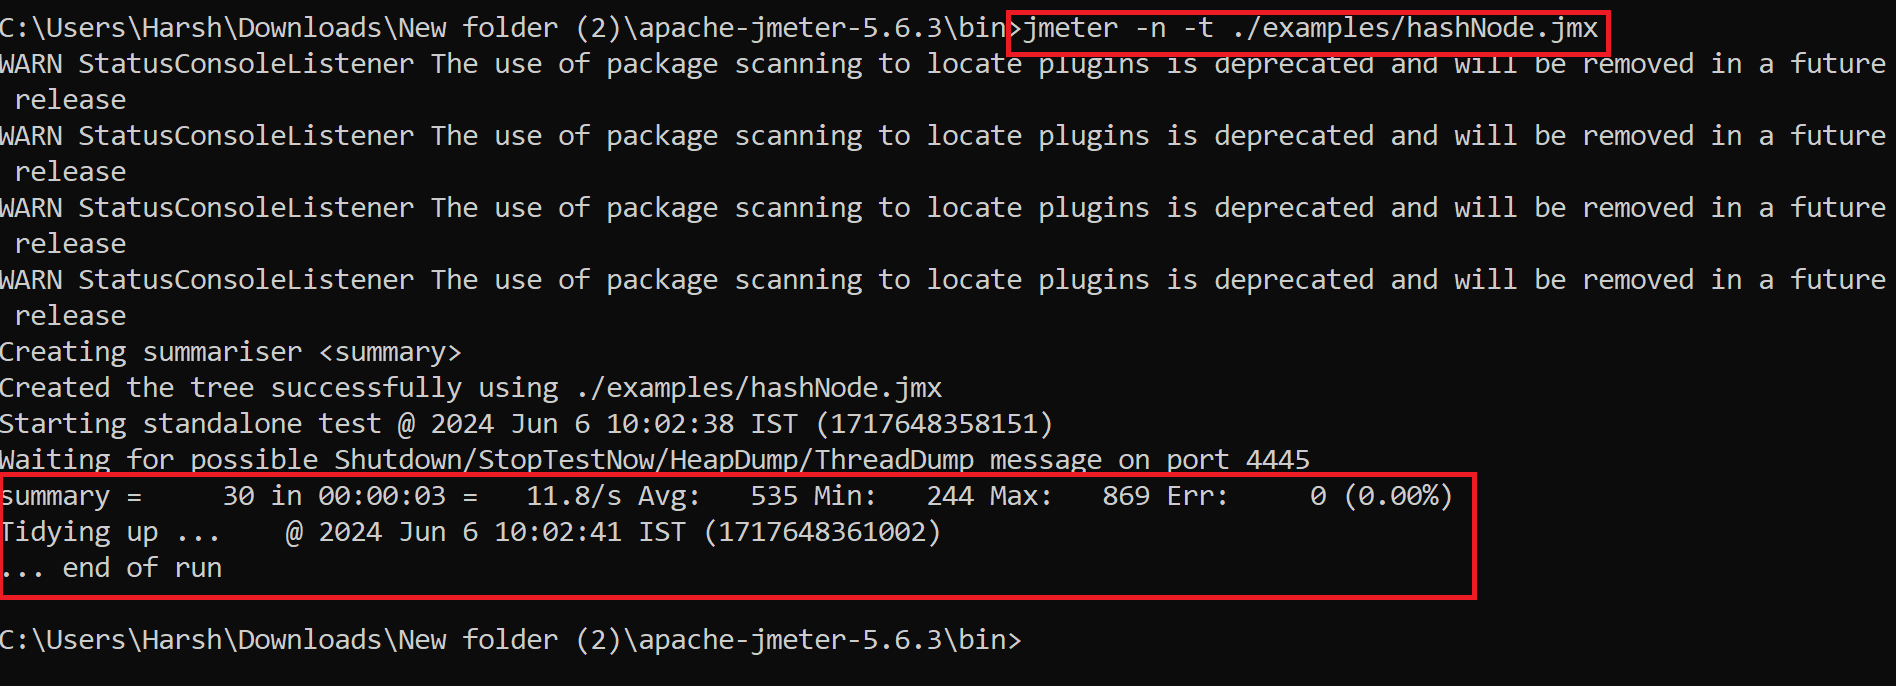
We can see test run in same way as GUI mode and we can see the results over here as well now we need to save this results in jtl file to use those in jenkins. Here is the command for it.
jmeter -n -t <path to new jmx file> -l ./examples/hashNode.jtl
You will be able to see the JTL file created in your 'examples' folder.
That's all about using JMeter in GUI and Non-GUI mode. let's integrate it into Jenkins.
Integrating JMeter with Jenkins
If you had no problem creating the JTL file in the previous part, then this next step will be straightforward for you. Here, we have two options: we can create another slave and install JMeter there to perform our task, but since I have access to AWS free tier, I'll perform the JMeter test on the same node where the Jenkins master is running. To do this, the first and foremost thing we need on that slave (Linux server) is JMeter. You can install it using the same zip file we used for Windows (because Java is amazing). Here is the command for downloading JMeter on the Linux server:
sudo wget https://dlcdn.apache.org//jmeter/binaries/apache-jmeter-5.6.3.zip
Then unzip the file, and you're good to go. If you have performed the first part of the practice correctly, there must be a JMX file created once you save through the JMeter UI. Copy the same file into the /bin/examples directory. Then we are all set to test our JMeter over the server using the command below. Just make sure you change the directory to bin.
sh jmeter.sh -n -t ./examples/hashNode.jmx
Here is the Output Photo for your reference

It's important to add the Jenkins user to the admin group to avoid any access denied problems. Otherwise, JMeter may not be able to generate the JTL file due to permission denied errors. Here are the steps:
sudo -a -G ubuntu jenkins
sudo usermod -a -G ubuntu jenkins
This will add the Jenkins user to the Ubuntu group, which has all the permissions to read and write files. Now, we can take one more step forward by adding the JTL file to the JMeter command, Here is the Command
sh jmeter.sh -n -t ./examples/hashNode.jmx -l ./examples/result.jtl
Make sure that at the end of this command, a JTL file is created in the examples directory. If so, congratulations, you have successfully added JMeter to your Jenkins master.
Analyzing Test Result
We need some good visualization for the end output, right? Jenkins has one amazing plugin for that: the Performance plugin. Let's first add it to our Jenkins. To do so, go to Manage Jenkins > Manage Plugins > Available tab. Here, you will find the Performance plugin. Install it.
Now it's the right time to add our new job. I've named it 'JMeterTest'. Create the freestyle job and then go to the configuration part. In the 'Restrict where this project can be run' field, give the label for the node where your Jenkins master is running.

You might need to add the lable in the build in node other wise you will not find the matching node from here.
We just need to add the build steps. Here they are, very simple: the same commands we performed in the previous section.
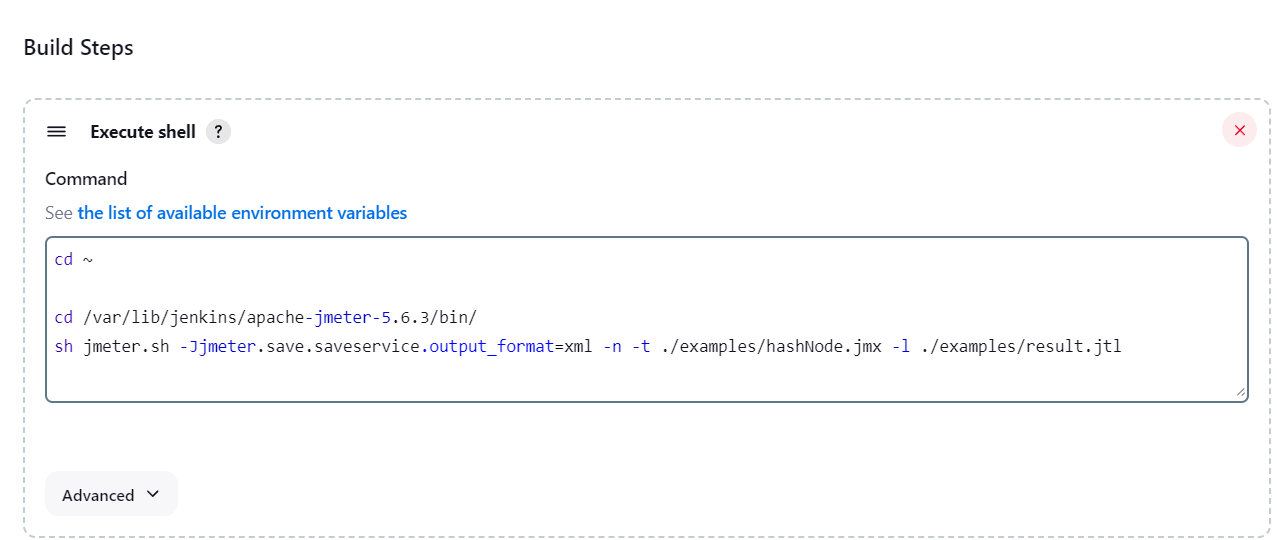
cd ~

cd /var/lib/jenkins/apache-jmeter-5.6.3/bin/
sh jmeter.sh -Jjmeter.save.saveservice.output_format=xml -n -t ./examples/hashNode.jmx -l ./examples/result.jtl
Change directory to the 'bin' first. In the second command, we execute the same command as before, just adding the Jjmeter.save.saveservice.output_format=xml parameter. This will generate the JTL result file for our test. We need to visualize it, and for that, we have the Performance plugin.
Now that our Jenkins is ready with the Performance plugin, in the post-build options, you will find the 'Publish Performance test result report' option. Select that option and in the 'Source data files (autodetects format)' field, provide the location to the JTL file created in the build step.

Keep other options as it is and save the the Job
Run the job twise and you will see the magic of performance plugin
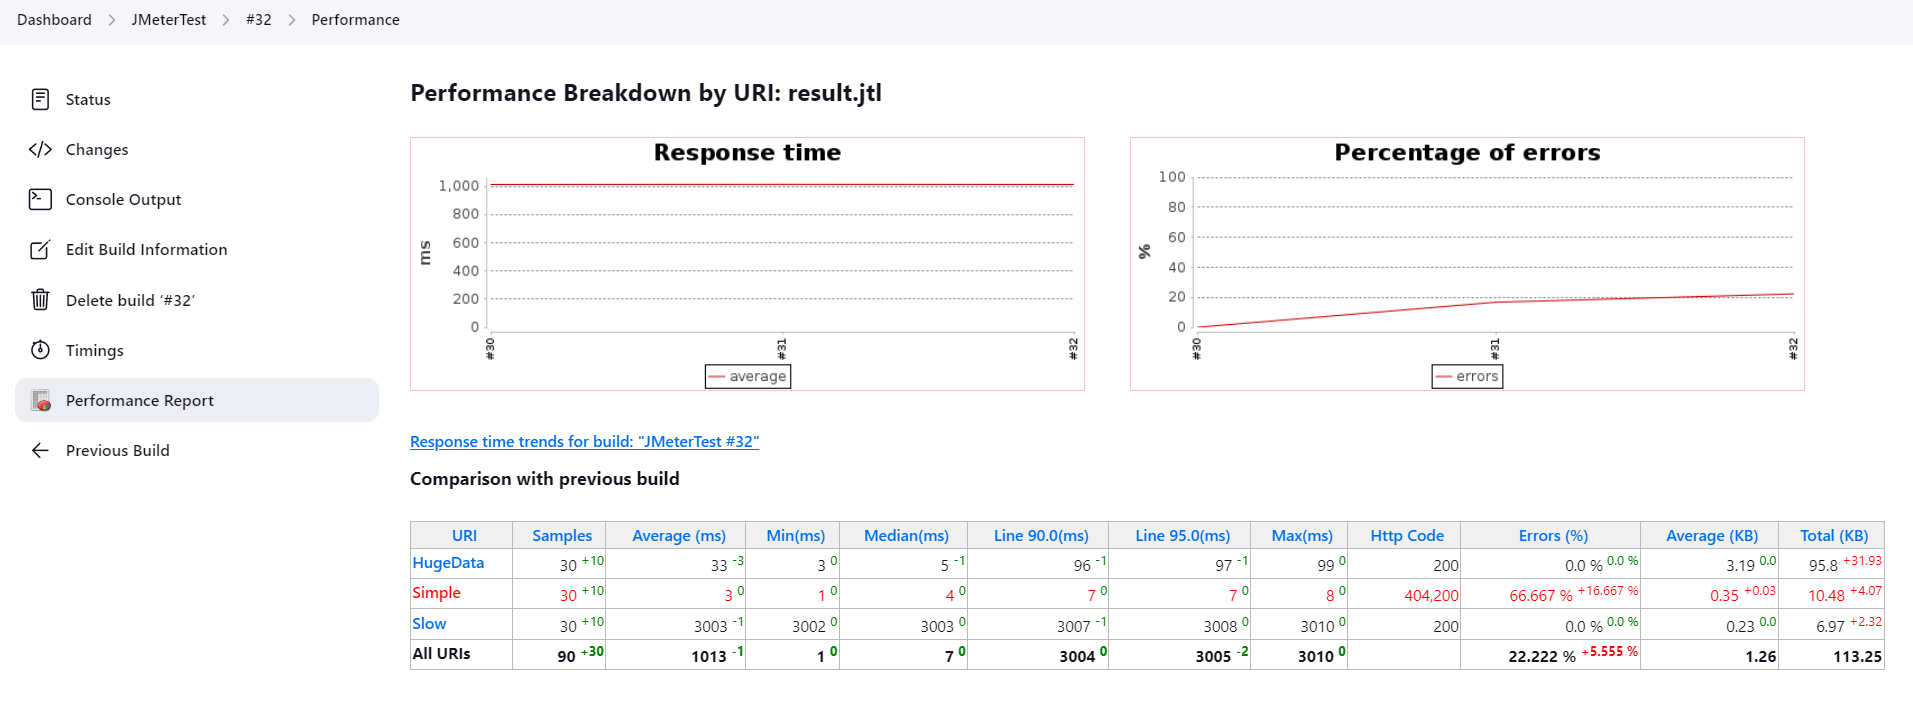
I have deliberately brought down the simple endpoint to show variation in the graph. As you can see, we can observe everything endpoint-wise through the graphs, including changes in errors and throughput, which is great!
To make the whole process fully automatic, we need to trigger this job whenever any commit happens. So, the entire flow is: whenever we make any commit, the changes will be live through our first job, which will remove the old container where our application was running and create a new one with our changes. Then, to test our application, we have a JMeter test in another job, which automatically gets triggered once our new container is ready. We can view visual graphs to see whether our commit causes any errors or decreases in response time, along with details of each endpoint.
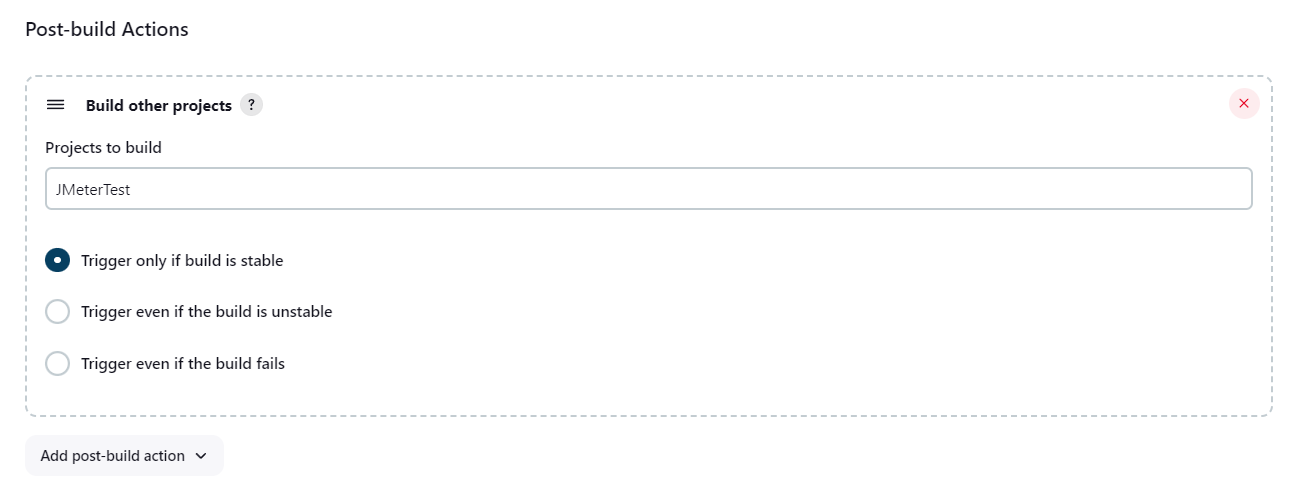
To achive the full automation we need to perform only one change which is adding Job JMeterTest as the post build action for the SlaveBuild Job here is how we can do it.
Go to the configuration of the SlaveBuild job, and at the end, you will find post-build actions. Here, we need to configure our JMeterTest job. Select the 'Build other projects' option from all options, and in the 'Projects to build' field, enter our job's name, i.e., JMeterTest. That's it.
Conclusion
Through this article, parts 1 and 2, we achieved complete automation of the small node application. Let's review the results once more by committing to our app. I will make the simple endpoint live again, which should cause a variation in the error graph.
Build 12 of the SlaveBuild job and Build 33 of the JMeterTest job were automatically triggered. It all started with a webhook, which triggered the SlaveBuild job. As a post-build action, the JMeterTest job was then triggered, and here are the results.
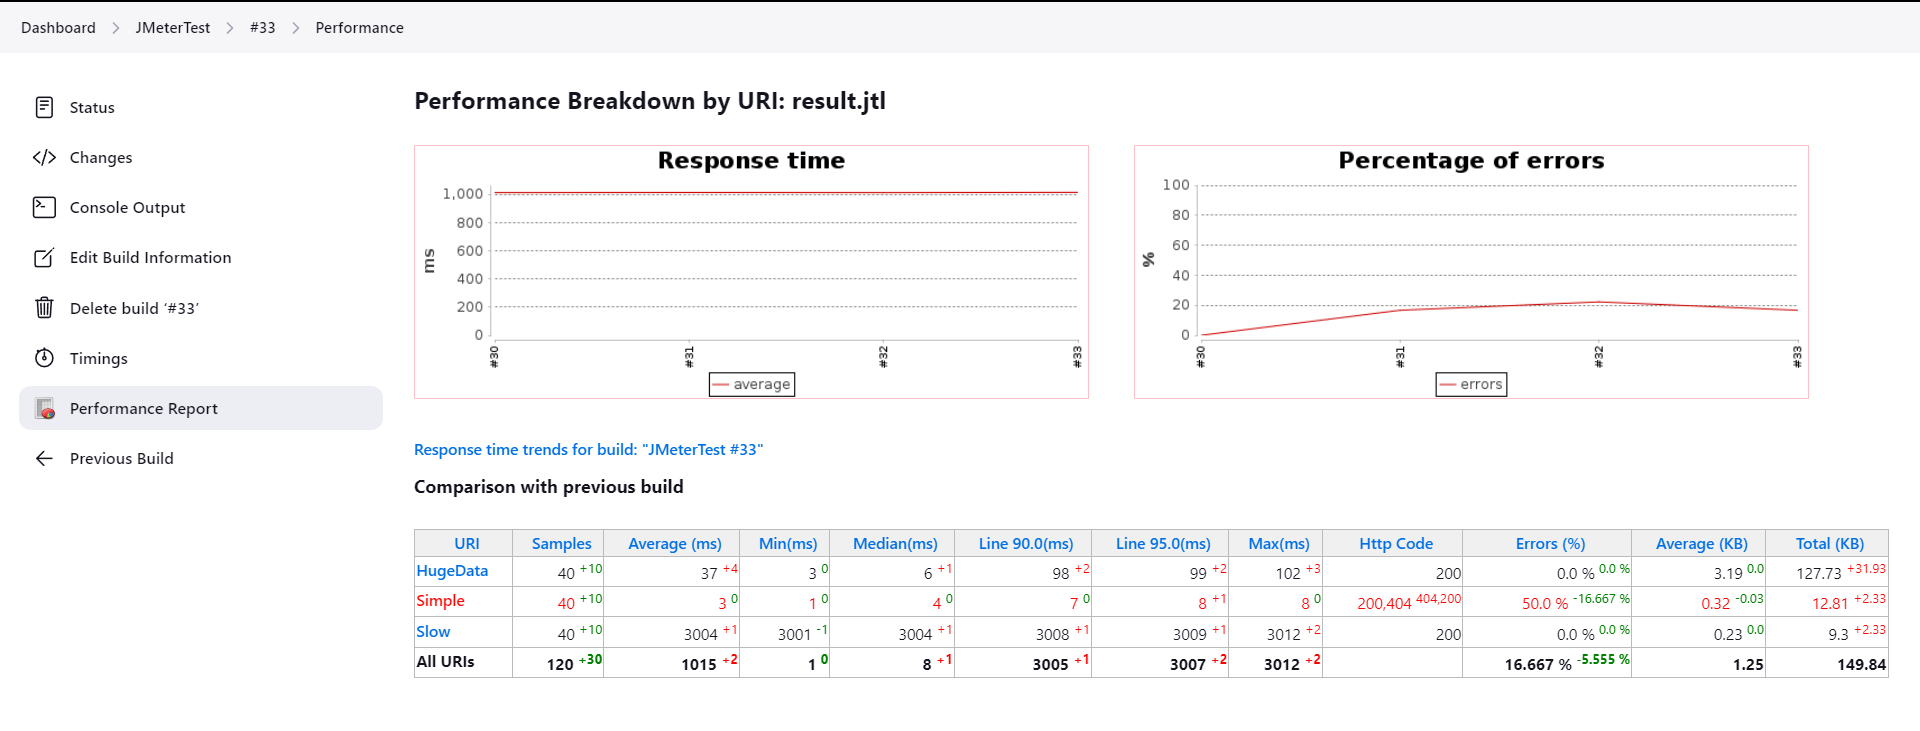
So happy to see this results without doing anyting.
In conclusion, through the automation of our small node application using Jenkins and JMeter, we've streamlined our development and testing processes. By integrating Jenkins for continuous integration and deployment and utilizing JMeter for performance testing, we've achieved efficiency and reliability in our software development lifecycle. With automated testing and deployment pipelines in place, we can confidently deliver high-quality software with speed and precision.
Subscribe to my newsletter
Read articles from HarshKumar Jiladiya directly inside your inbox. Subscribe to the newsletter, and don't miss out.
Written by
