Predicting Customer Churn with Random Forest: A Quick Guide
 Osahon Ohenhen
Introduction
Have you ever woken up to a wave of customer cancellations? It's a sinking feeling, and one that can significantly impact your business's bottom line. This is where customer churn comes in.
Customer churn, or the rate at which customers stop using your service, is a silent drain on revenue and growth. But what if you could predict churn before it happens?
In this blog post, we'll dive into the world of customer churn prediction using machine learning. We'll explore how I built a model with Random Forest classifier to identify customers at risk of churning. Get ready to learn how to take a proactive approach to customer retention and keep your business thriving!

Project Outline
Import Dependencies
Load Data
Data Understanding and Exploration
Data Preparation and Cleaning
Building the Customer Churn Prediction Model
Predict!
Import Dependencies
We will be using the Telecom Customer Churn from kaggle. You'll need a Python IDE, preferably Jupyter Notebook, and the following libraries installed: Numpy, Pandas, Plotly, and Scikit-Learn. Let's go!
import pandas as pd
import os
from sklearn import preprocessing
from sklearn.model_selection import train_test_split
from imblearn.over_sampling import SMOTE
from sklearn.ensemble import RandomForestClassifier
from sklearn.metrics import accuracy_score
import plotly.express as px
import plotly.graph_objects as go
from plotly.subplots import make_subplots
from plotly.offline import init_notebook_mode, iplot
init_notebook_mode(connected=True)
import warnings
warnings.filterwarnings(action="ignore", category=FutureWarning)
Load and Explore the Data
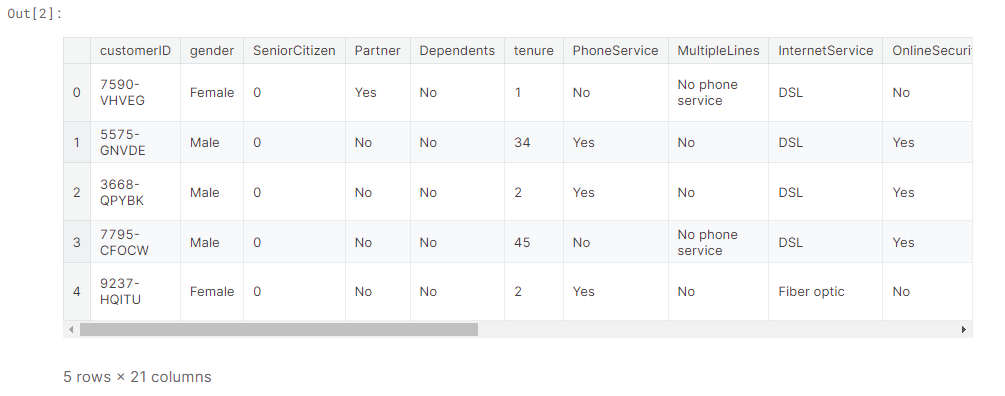
I loaded the dataset and took an initial look at the first few rows to understand the structure of the data.
df = pd.read_csv('WA_Fn-UseC_-Telco-Customer-Churn.csv')
df.head()
Data Understanding and Exploration
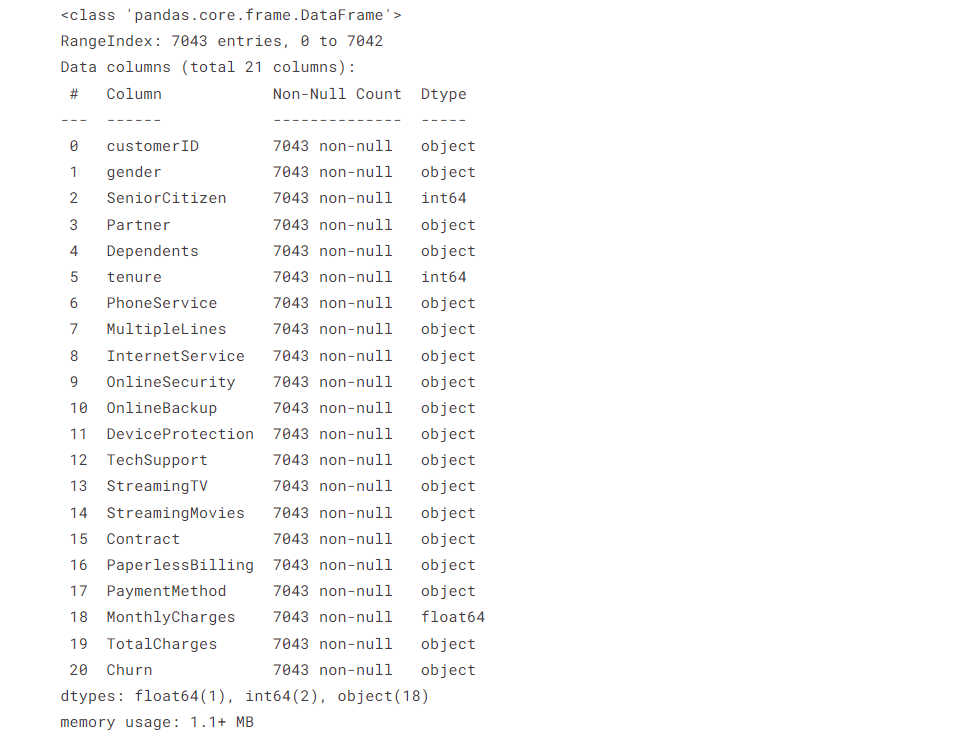
Now we need to explore the dataset to examine its shape, structure, and basic statistics. This step is crucial as it helps us identify potential issues with the data that could negatively impact our analysis and modeling.
# Determine the shape of the dataset
df.shape

# Check the datatypes and missing values
df.info()
# Get a statistical summary of the dataset
df.describe()

Key points:
The dataframe has 21 columns related to telecom user subscription behavior
There are 19 variables used to predict the target - Churn: The users who left within the last month
TotalChargesis in the wrong format
Let's determine the balance of this dataset
df['Churn'].value_counts(normalize=True)

Key point:
- Approximately 27% of customers had churned, indicating an imbalanced dataset.
Demographic analysis
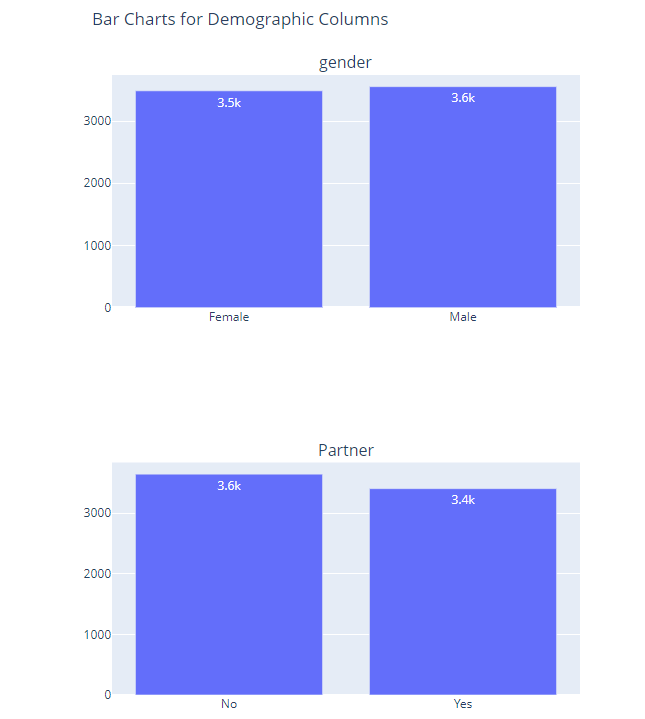
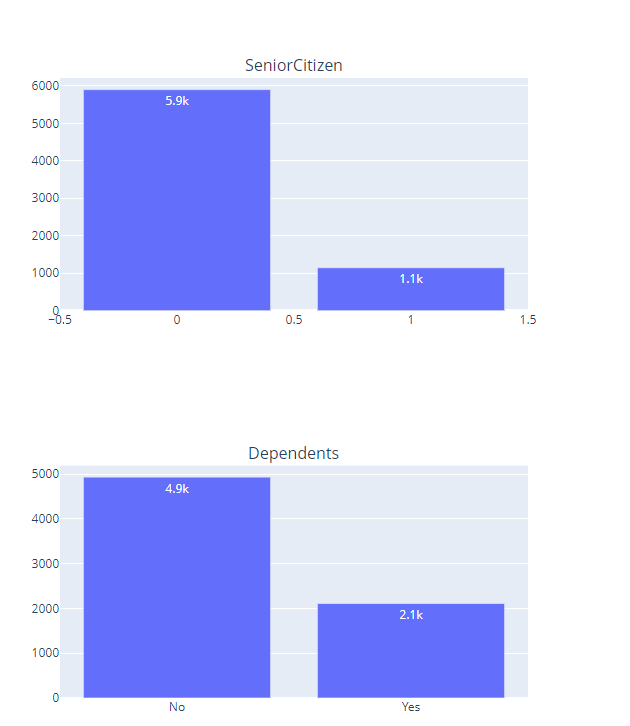
I will explore the demographic distribution using bar charts:
df.columns

demo_cols = ['gender', 'SeniorCitizen', 'Partner', 'Dependents']
fig = make_subplots(rows=2, cols=2, subplot_titles=demo_cols)

for idx, col in enumerate(demo_cols):
    temp = df.groupby(col, as_index=False)['customerID'].count()
    temp.columns = [col, 'Count']

    bar_fig = px.bar(temp,
                     x=col,
                     y='Count',
                     text_auto='.2s',
                     width=800,
                     height=600)

    # Get the trace from the created bar figure and add it to the subplot
    for trace in bar_fig['data']:
        fig.add_trace(trace, row=(idx // 2) + 1, col=(idx % 2) + 1)

fig.update_layout(height=800, width=1200, title_text="Bar Charts for Demographic Columns")
fig.show()
Key points:
Most of the customers in this dataset are younger individuals without a dependant.
There is a relatively equal distribution of user gender and marital status
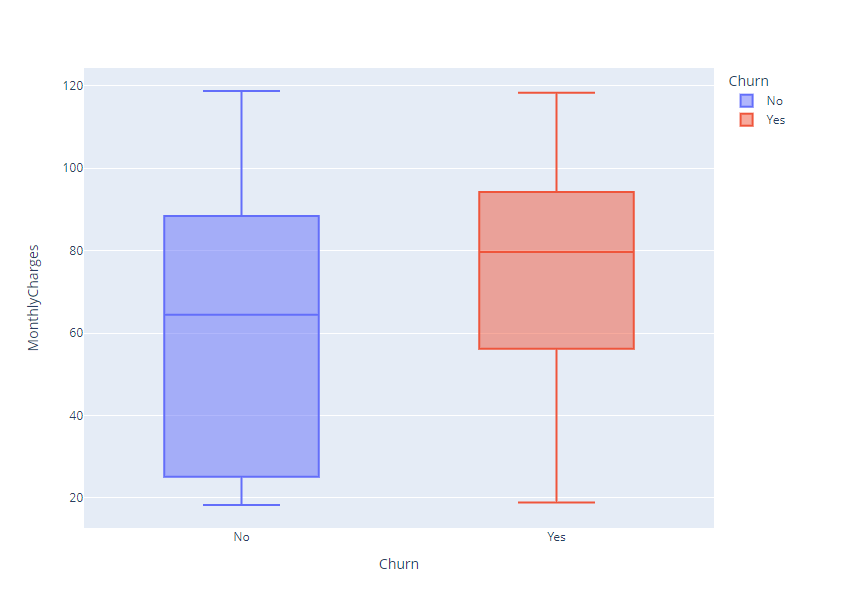
Now let's look at the relationship between cost and customer churn
fig = px.box(df,
            x = 'Churn',
            y = 'MonthlyCharges',
            color = 'Churn',
            width=800,
            height=600)
fig.show()
Key point:
- The plot above shows that customers who churn have a higher median monthly charge.
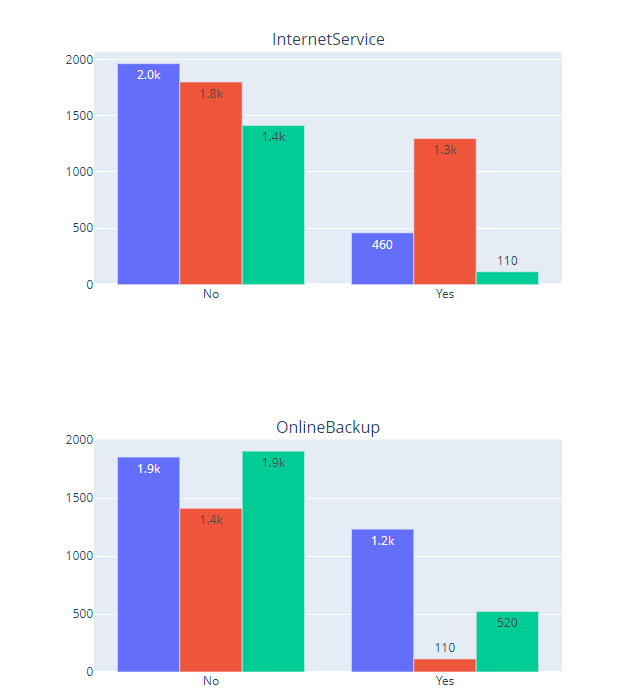
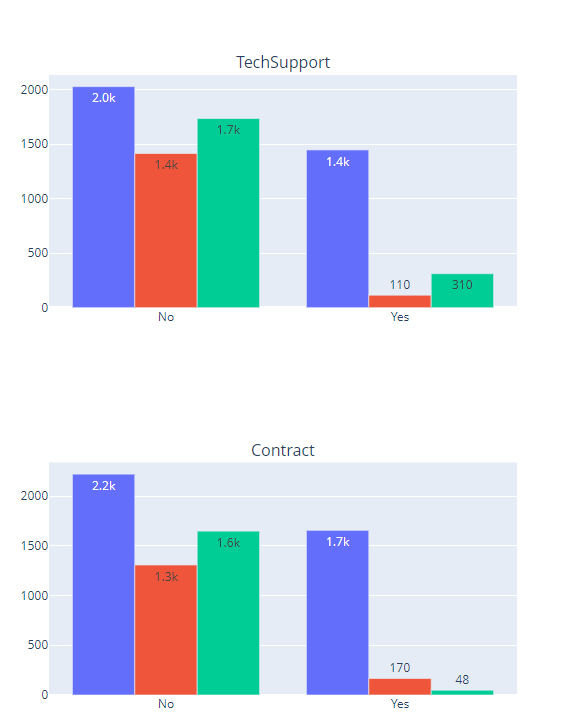
Now, I will analyse the relationship between customer churn and a few other categorical variables
import random

cat_cols = ['InternetService',"TechSupport","OnlineBackup","Contract"]
fig = make_subplots(rows=2, cols=2, subplot_titles=cat_cols)

def random_color():
    return "rgba({}, {}, {}, 0.8)".format(random.randint(0, 255), random.randint(0, 255), random.randint(0, 255))


for idx, col in enumerate(cat_cols):
    temp = df.groupby(['Churn',col], as_index=False)['customerID'].count()
    temp.columns = ['Churn', col, 'Count']
    bar_fig = px.bar(temp,
                x='Churn',
                y='Count',
                barmode='group',
                text_auto='.2s',
                color=col,
                title=col)

    # Get the trace from the created bar figure and add it to the subplot
    for trace in bar_fig['data']:
        trace.showlegend = False  # Hide the legend for individual traces
        fig.add_trace(trace, row=(idx // 2) + 1, col=(idx % 2) + 1)

fig.update_layout(height=800, width=1200)
fig.show()
Key points:
Customers using fibre optic services churn more often than others.
Customers without tech support churn more often than others.
Many customers who churned did not have online backup.
Users with monthly contract churn more often than others.
Data Preparation and Cleaning
Datatype issues
The only data issue we had was that of TotalCharges. So let's change that.
df['TotalCharges'] = pd.to_numeric(df['TotalCharges'], errors='coerce')
df['TotalCharges'].dtypes

Encoding Categorical Variables
This process involves converting qualitative data into numerical format. This ensures compatibility with machine learning algorithm.
# Import the LabelEncoder module from the preprocessing library
le = preprocessing.LabelEncoder()

# Apply the LabelEncoder to transform categorical features into
# numerical labels
df_cat = cat_features.apply(le.fit_transform)

df_cat.head()

The values before encoding:
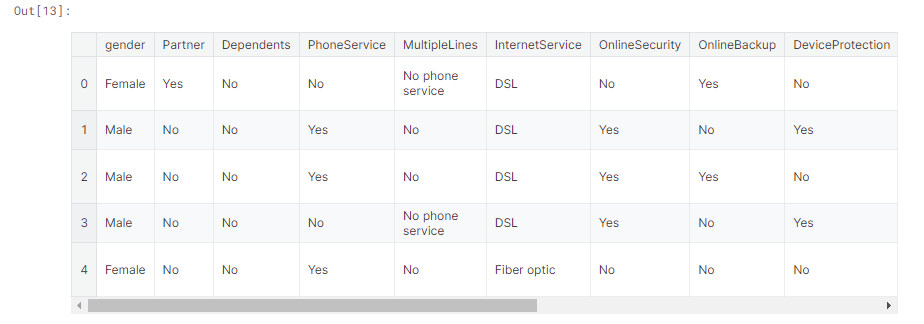
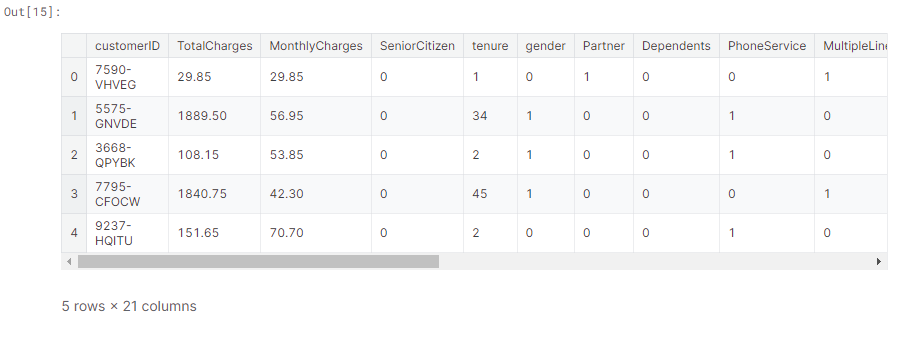
Now I will replace the categorical values with the encoded data in the dataset.
features_ = df[['customerID','TotalCharges','MonthlyCharges','SeniorCitizen','tenure']]
finaldf = pd.merge(features_ , df_cat, left_index=True, right_index=True)
finaldf.head()
Data Balancing
To address the imbalance issue identified earlier, I will implement an oversampling technique. This method involves increasing the number of instances in the minority class to match the majority class, thereby creating a balanced dataset. Oversampling can be achieved using various methods, such as the Synthetic Minority Over-sampling Technique (SMOTE) or simply duplicating existing minority class samples.
Before I do that, I will split the data into train and test because we only want to apply this technique on the train data
finaldf = finaldf.dropna()
finaldf = finaldf.drop(['customerID'],axis=1)

X = finaldf.drop(['Churn'],axis=1)
y = finaldf['Churn']
X_train, X_test, y_train, y_test = train_test_split(X, y, test_size=0.33, random_state=42)

X_train.shape, X_test.shape

# Using the SMOTE technique to oversample the data
oversample = SMOTE(k_neighbors=5)
X_smote, y_smote = oversample.fit_resample(X_train, y_train)
X_train, y_train = X_smote, y_smote

# Verify balance
y_train.value_counts()

Building the Customer Churn Prediction Model
I will be using Random forest for this prediction.
rf = RandomForestClassifier(random_state=46)
rf.fit(X_train,y_train)
To evaluate the performance of the model, I will use accuracy score.
preds = rf.predict(X_test)
print(accuracy_score(preds,y_test))

The accuracy of this model is 0.77, indicating our model is performing well.
Predict!
With our Random Forest model trained, it's time to make predictions with your model.
Conclusion
Predicting customer churn with a Random Forest classifier empowers businesses to proactively manage customer retention. By identifying at-risk customers and implementing targeted strategies, companies can minimize revenue loss and enhance customer satisfaction, contributing to long-term success.
.....
Subscribe to my newsletter
Read articles from Osahon Ohenhen directly inside your inbox. Subscribe to the newsletter, and don't miss out.
Written by

Osahon Ohenhen
Osahon Ohenhen
I build things.