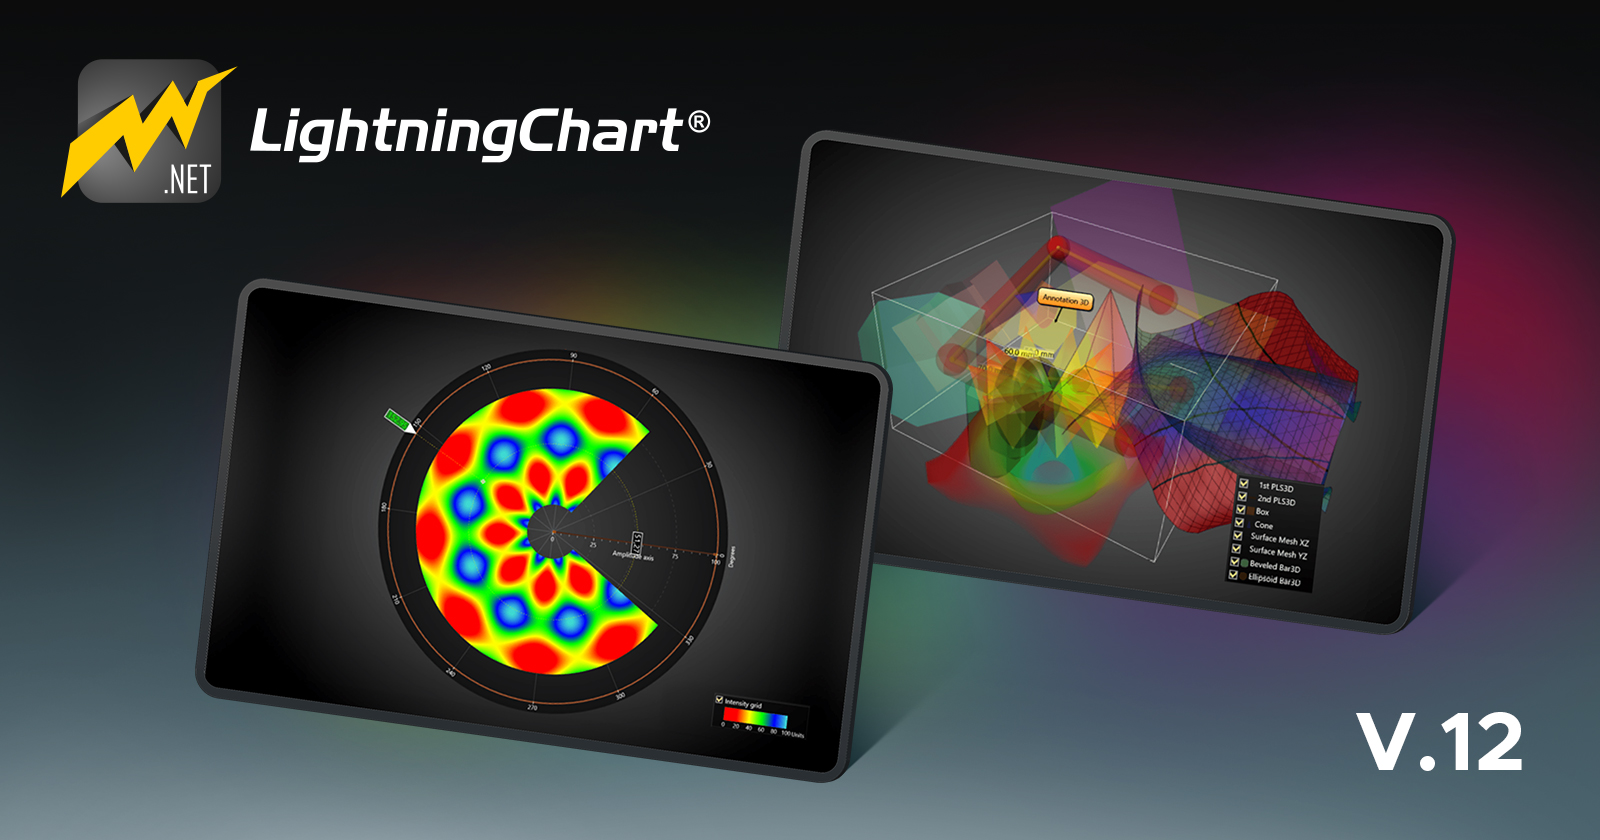
LightningChart .NET v.12 is out now!
 Omar Urbano | LightningChart
LightningChart .NET is a high-performance charting library designed for use in .NET applications. LightningChart .NET is optimized for:
high-performance applications
supports a wide range of chart types (line charts, bar charts, scatter plots, heatmaps, volume rendering, etc.)
supports real-time data processing of data-intensive applications of billion data points
cross-platform available for .NET platforms including WPF, WinForms, and UWP.
New Release
This week, LightningChart .NET has released its newest version 12, here's what it includes:
ImageLayer
ImageLayer is a new feature that can be gradually filled with smaller images which accumulation process happens in the background thread process allowing the chart UI to remain fast and responsive even when compounding ImageLayer from several smaller bitmaps requires a lot of memory.
Semiconductor Industry
This is a handy feature for the semiconductor industry (but not limited to) where optical measuring systems are used for surface analysis. The surface in question could be silicon wafers, micro-electromechanical systems (MEMS), or similar.
Polar Heatmap / IntensityGrid
We are introducing the IntensityGridSeriesPolarseries. The IntensityGrid allows visualizing an M x N array of nodes colored by an assigned value-range palette where the colors between nodes are interpolated.
The IntensityGridSeriesPolar is evenly spaced in Polar space. The data are stored in the Data property as a two-dimensional array of doubles: Angle and Amplitude.
The MinimumAmplitude and MaximumAmplitude properties define the amplitude range where the grid should fit. While the BeginAngle and EndAngle properties set a range for angles to be fitted. For streaming/real-time applications, use the Series.UpdateData() method.

DataCursor improvements
The DataCursor property for all the views included in XY, 3D, Polar, and Smith series has now a configuration property tree. Users can now control color, style, and visibility of labels for each axis interdependently.

3D TransparencyRenderMode property/feature
In this new version v.12, the TransparencyRenderMode property was added to all the remaining series: BarSeries3D, MeshModels, Polygon3D, VolumeModel and Rectangle3D.
When different types of translucent series/objects are rendered in 3D charts, the ShaderApproximation option of TransparencyRenderMode should be used.
The new feature helps to mitigate artifacts and improve translucent object handling in the chart. This new way to handle translucent surface/lines is available only when DirectX 11 renderer is used (i.e. RendererDeviceType is either HardwareOnlyD11 or SoftwareOnlyD11).

XAML Serialization Compatibility
LightningChart .NET now supports XAML serialization. This means that the .NET class XamlWriter can be used to serialize LightningChart object into XAML markup while the .NET class XamlReader reads the XAML input and creates a LightningChart object.
By using the XamlWriter.Save() and XamlReader.Load() methods, the user can save the current state of the Chart and stay the next time the user opens the application.
Note:
Series Data/Points properties are not serialized
VolumeModel properties are not serialized
Starting from this version, it is perfectly fine to create a chart in *.xaml code with the non-bindable edition of LightningChart, although if someone needs to bind chart properties, then MVVM edition of LightningChart should be used instead.

XAML string of serialized Chart
New Chart Examples
New examples have been added to the Interactives Examples App including the ExampleImageLayer, ExampleHeatMapPolar, ExampleXamlSerialization, and ExampleTranslucentChart3D.
The source code of the new examples can be extracted as non-bindable WPF or WinForms (for both .NET Framework 4.8 and .NET 6.0).
While ExampleXamlSerialization shows how the ‘state’ of the chart could be saved and restored, the Demo allows to saving XAML string of the serialized Chart of any example (button ‘Extract Xml’).
Subscribe to my newsletter
Read articles from Omar Urbano | LightningChart directly inside your inbox. Subscribe to the newsletter, and don't miss out.
Written by

Omar Urbano | LightningChart
Omar Urbano | LightningChart
Hi! I'm a Software Engineer from Mexico and a data visualization enthusiast. I'm currently writing technical articles about data visualization and high-performance charts.