Streamlining AI Deployment: Launching ChatGPT Clone App with Kubernetes, Terraform, and Jenkins CI/CD
 Saurabh Adhau
Table of contents
- Introduction
- Step 1: Set Up Terraform
- Step 2: Configure AWS
- Step 3: Clone the GitHub Repository
- Step 4: Building a Infra using terraform
- Step 5: Set Up SonarQube and Jenkins
- Step 6: CI/CD Pipeline
- Step 7: Kubernetes Cluster Creation Using Terraform via Jenkins Pipeline
- Step 8: Deployment on Kubernetes
- Step 9: Monitoring via Prometheus and Grafana
Introduction
Deploying AI solutions efficiently and securely is crucial in today's tech landscape. This guide demonstrates the deployment of a ChatGPT bot using a DevSecOps approach, integrating security into the DevOps pipeline. Leveraging Terraform, Kubernetes, and Jenkins on the AWS cloud platform, we ensure an automated, robust, and scalable deployment process. Join us as we outline the steps for a secure and effective ChatGPT bot deployment.
Step 1: Set Up Terraform
Open your terminal and execute the following commands:
# Install Terraform
snap install terraform --classic

# Verify Terraform installation
which terraform
Step 2: Configure AWS
To configure AWS, you need to have the AWS CLI installed. If you don't have it installed, you can install it using the following commands:
A. Install AWS CLI
# Install AWS CLI
sudo apt-get update
sudo apt-get install awscli -y

# Verify AWS CLI installation
aws --version
B. Configure AWS CLI
Obtain AWS Access Keys:
Log in to your AWS Management Console.
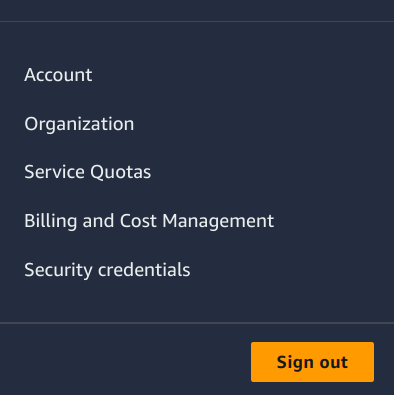
Navigate to your name in the upper right corner. Click on the drop-down and select Security credentials.
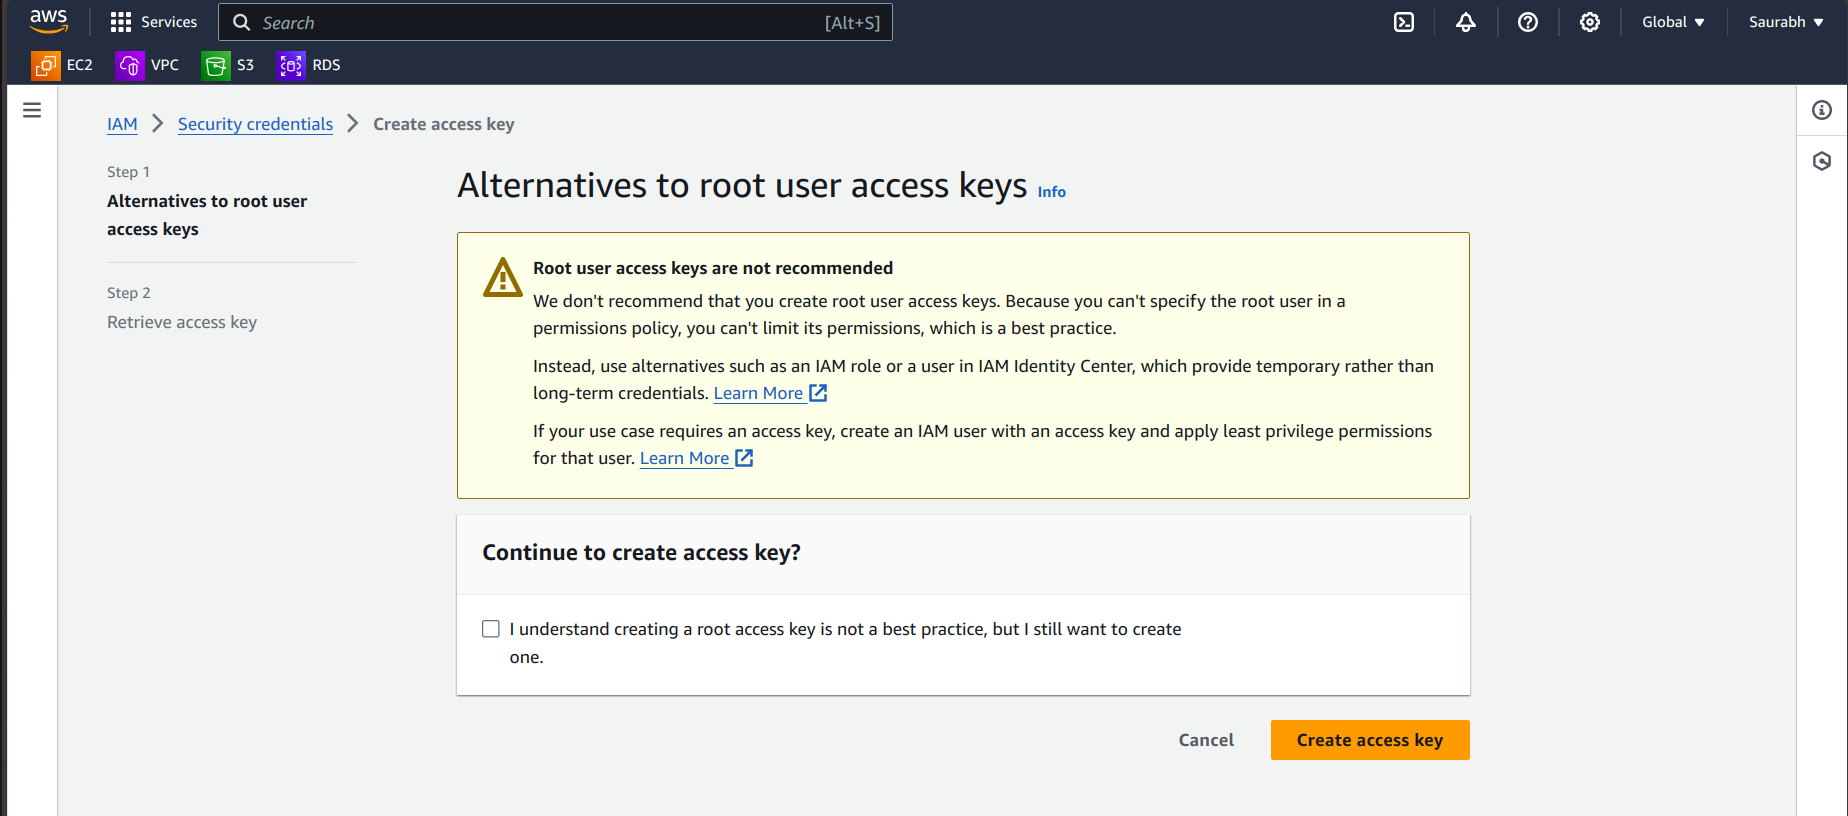
Click the Create access key.
Note down your Access Key ID and Secret Access Key.
Run the following command and follow the prompts to configure your AWS credentials:
aws configure
Enter your AWS Access Key ID.
Enter your AWS Secret Access Key.
Specify your default region name (e.g.,
us-west-2).Specify your default output format (e.g.,
json).
Your AWS CLI is configured with your credentials, allowing you to interact with AWS services from your local machine.
Step 3: Clone the GitHub Repository
Clone the repository containing the ChatGPT deployment scripts:
git clone https://github.com/Saurabh-DevOpsVoyager77/AI-Deployment.git
Step 4: Building a Infra using terraform
We'll build a simple infrastructure using Terraform. The infrastructure includes a user data script that installs Jenkins, Docker, and Trivy and starts a SonarQube container on port 9000. We'll run the Terraform commands to initialize, validate, plan, and apply the infrastructure configuration.
Run Terraform Commands:
cd Instance-terraform/
terraform init
terraform validate
terraform plan
terraform apply --auto-approve
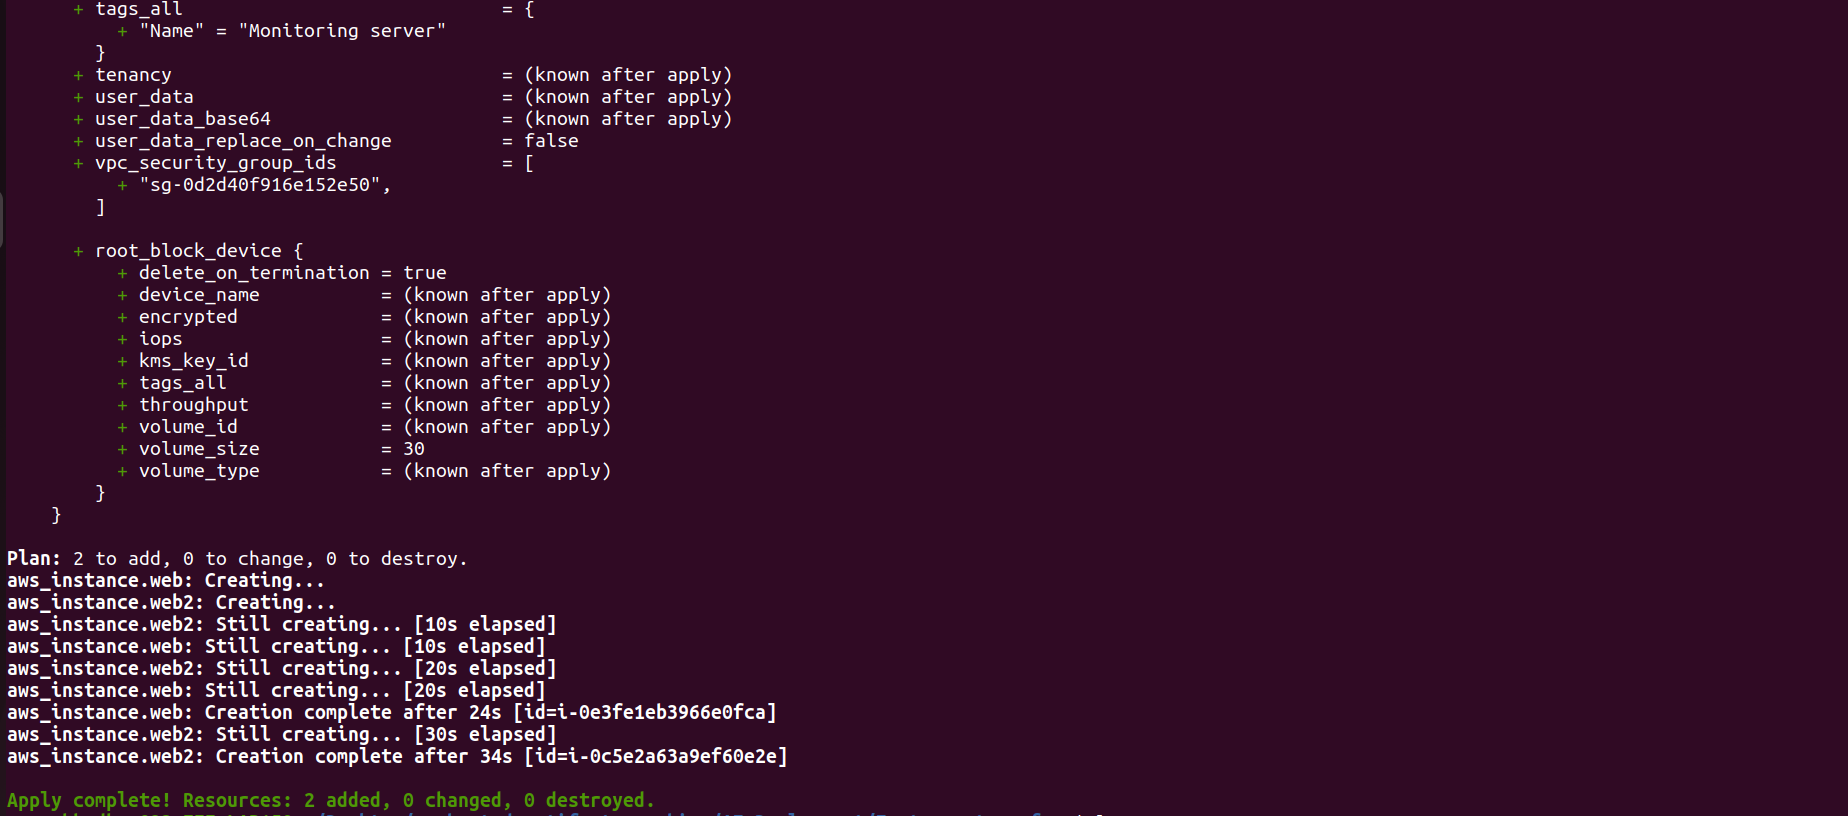
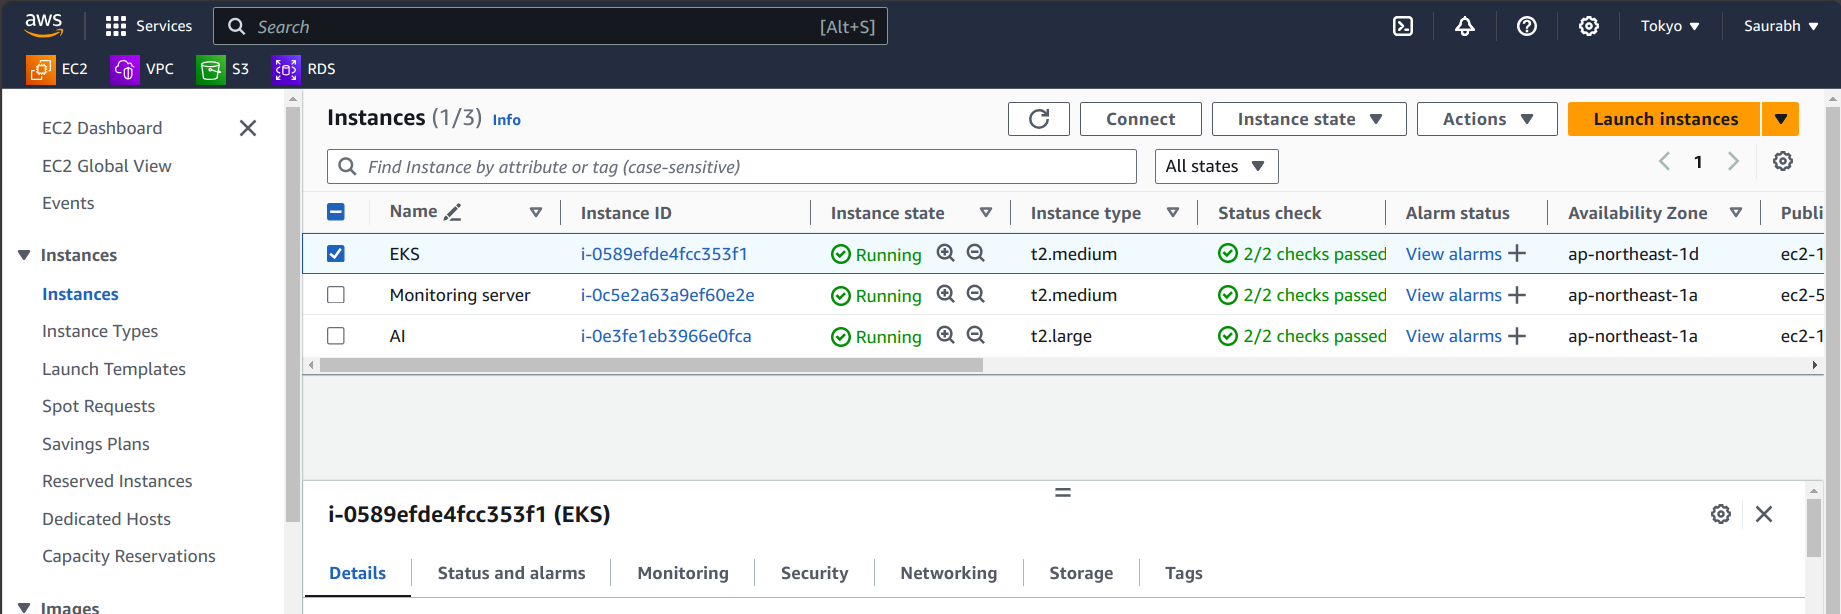
Go to the AWS Dashboard in EC2 service, where you can see the two Instances.
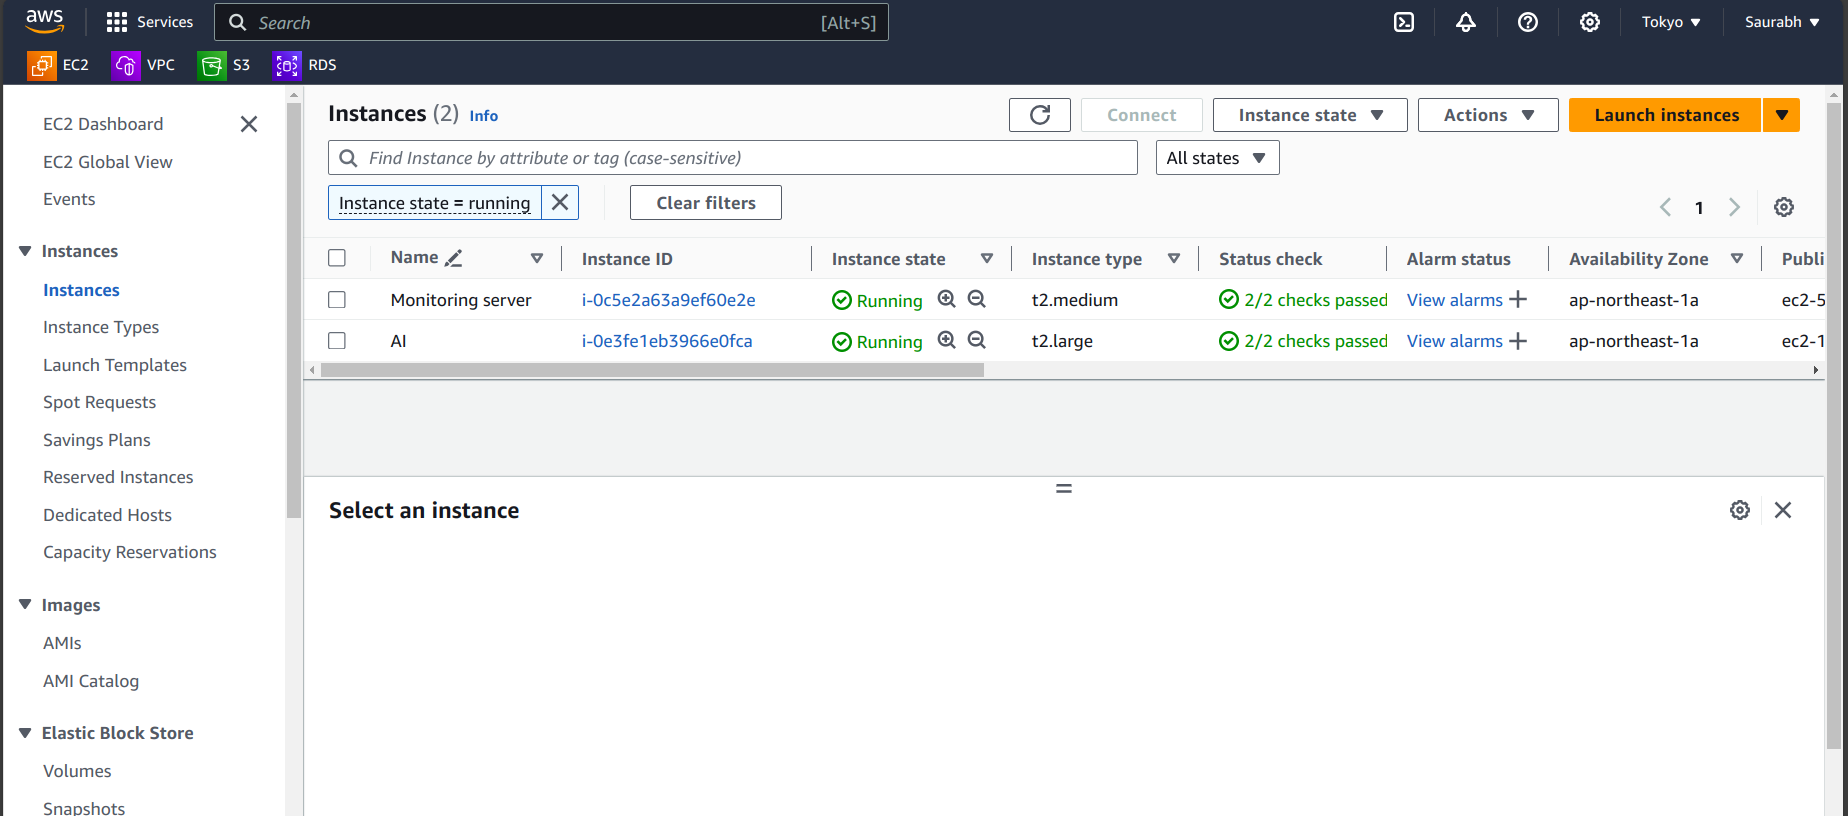
Step 5: Set Up SonarQube and Jenkins
A. SonarQube
Copy the public IP of your AI server/machine.
Open your browser and navigate to
<public-ip>:9000.

- When the SonarQube window opens, log in with the initial credentials:
Username: admin
Password: admin
Update your password with the New Password.
You will see the welcome window of SonarQube.
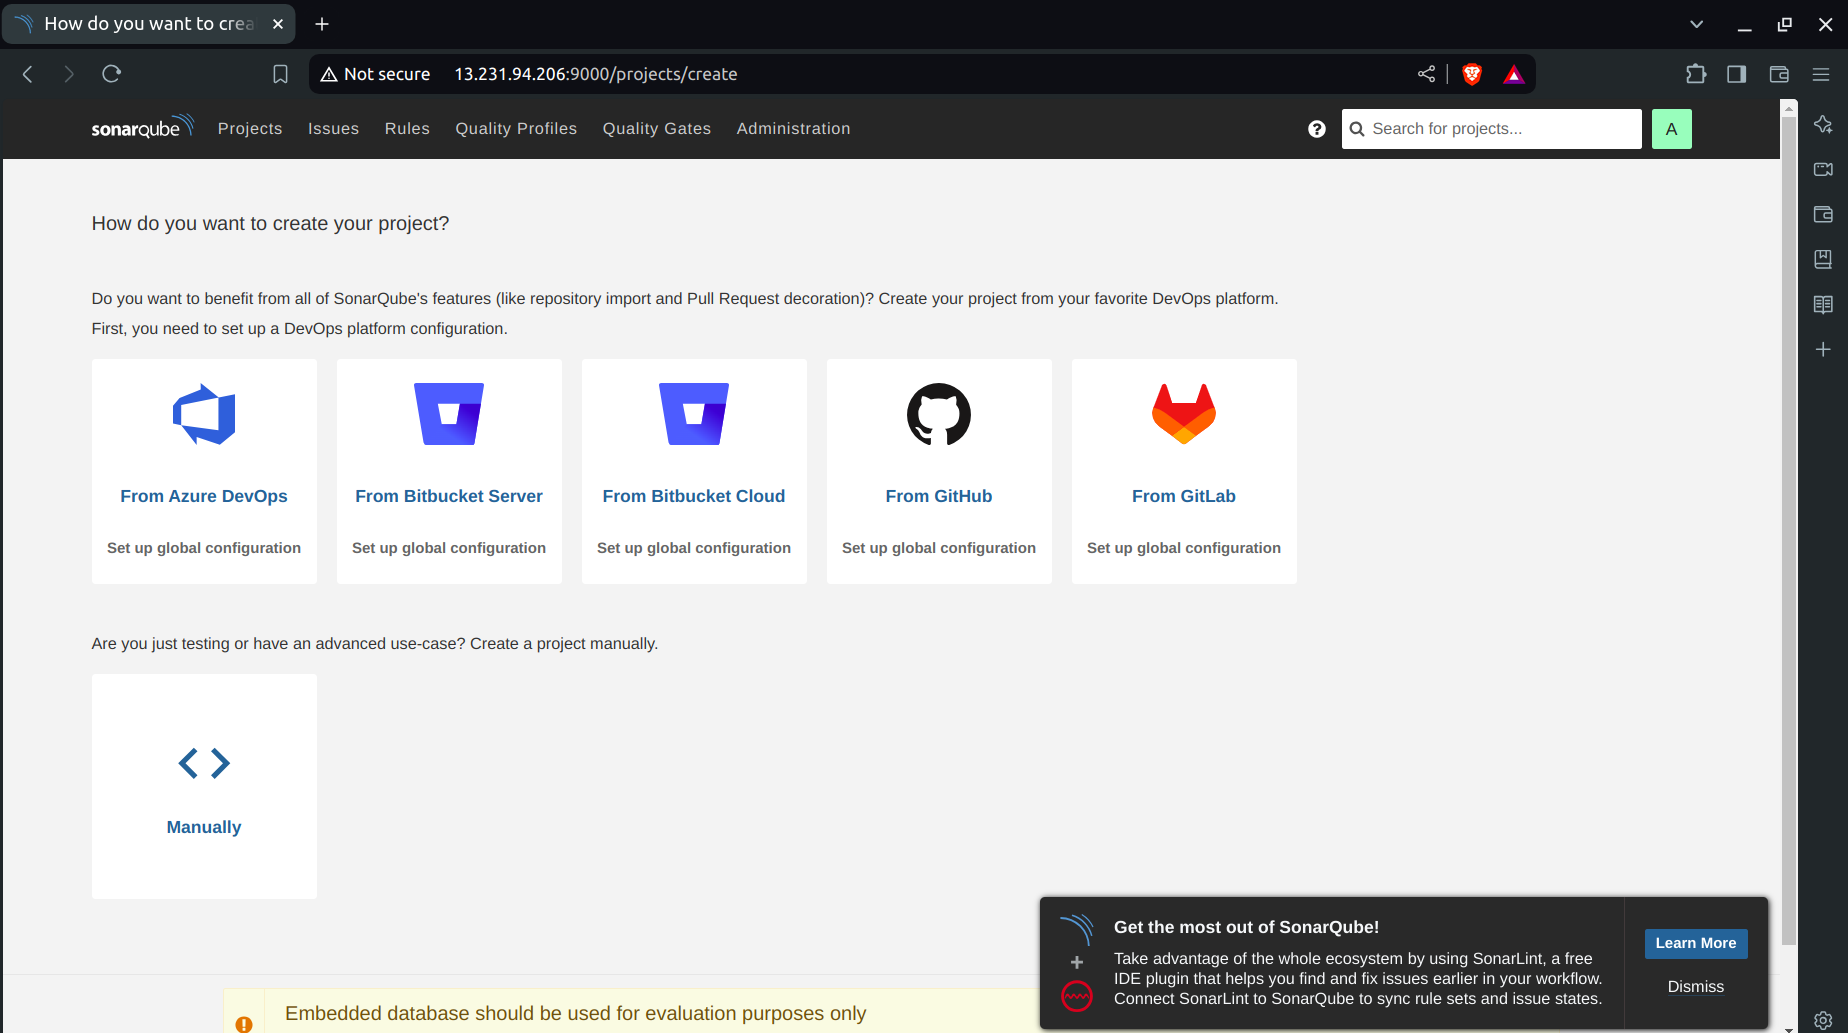
B. Jenkins
Open your browser and navigate to
<public-ip>:8080.Connect to your EC2 instance:
Run the following commands:
sudo su
cat /var/lib/jenkins/secrets/initialAdminPassword
Copy the output (this is your Jenkins initial admin password).
Paste the password into Jenkins to unlock it.
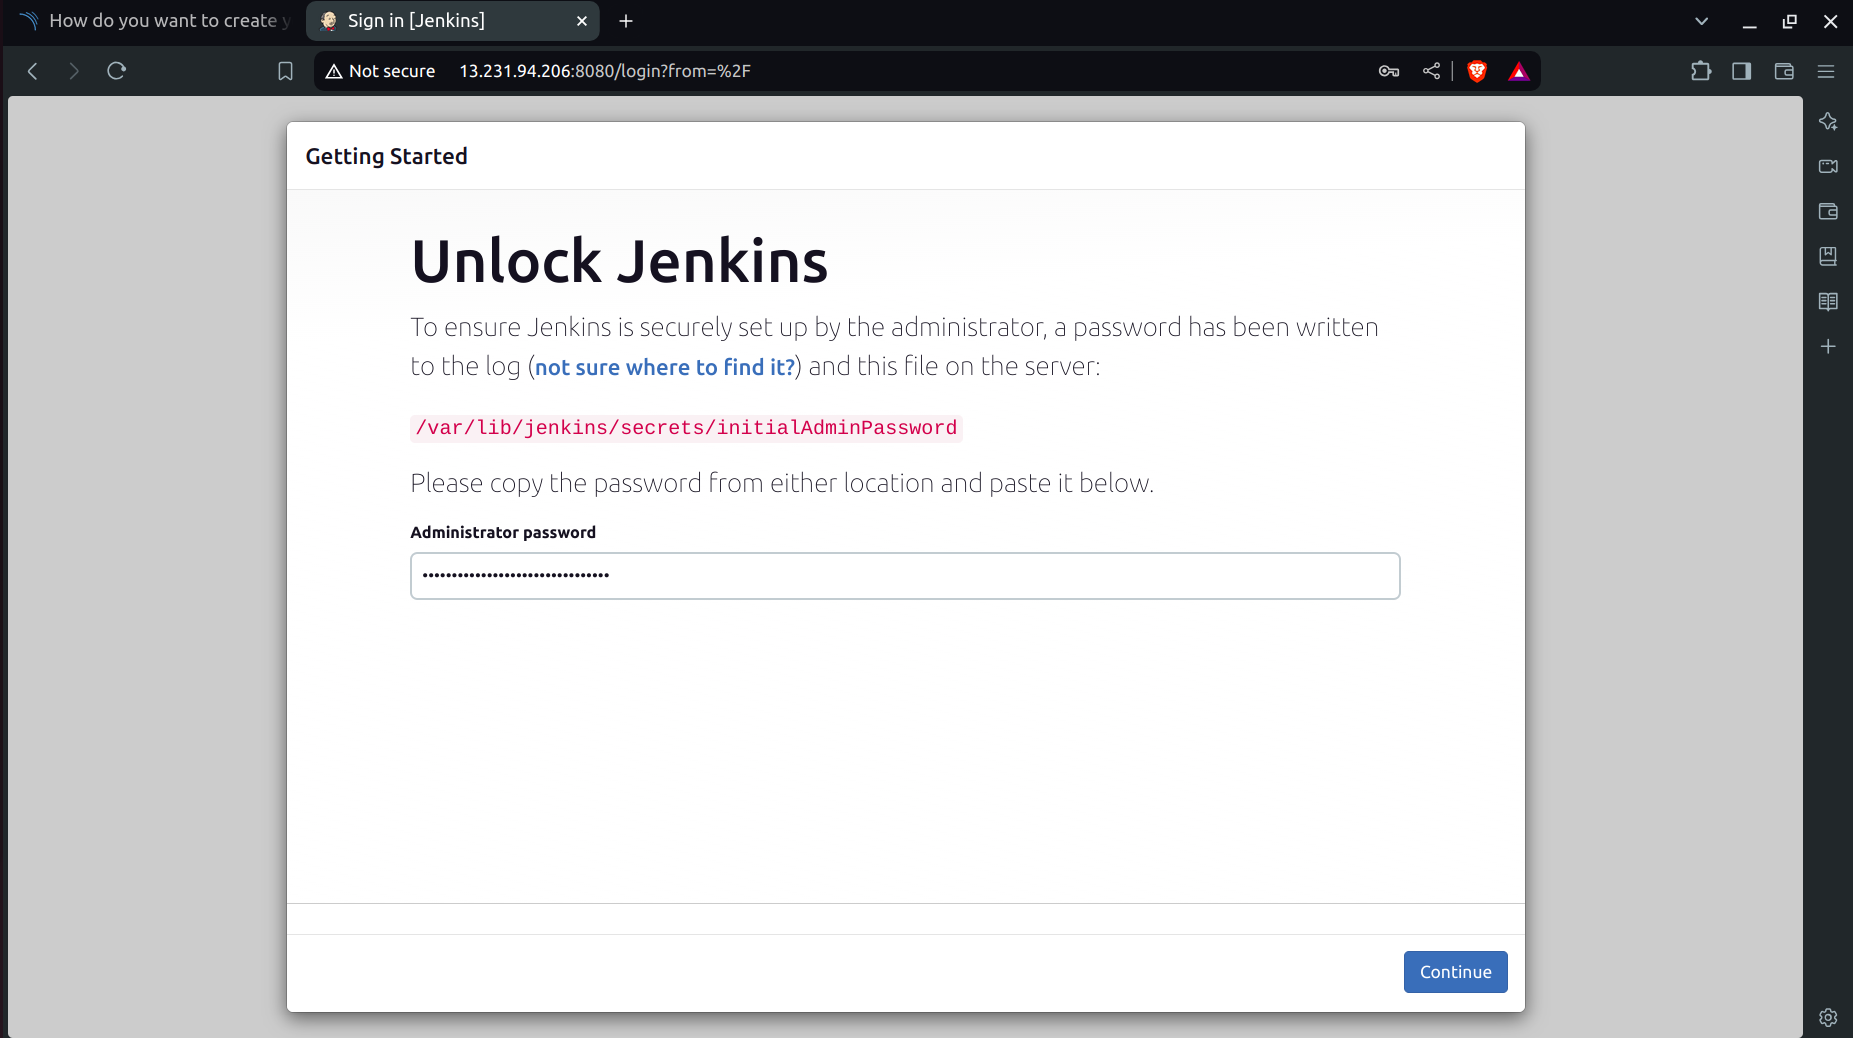
Install the suggested plugins.
Set up your Jenkins user.
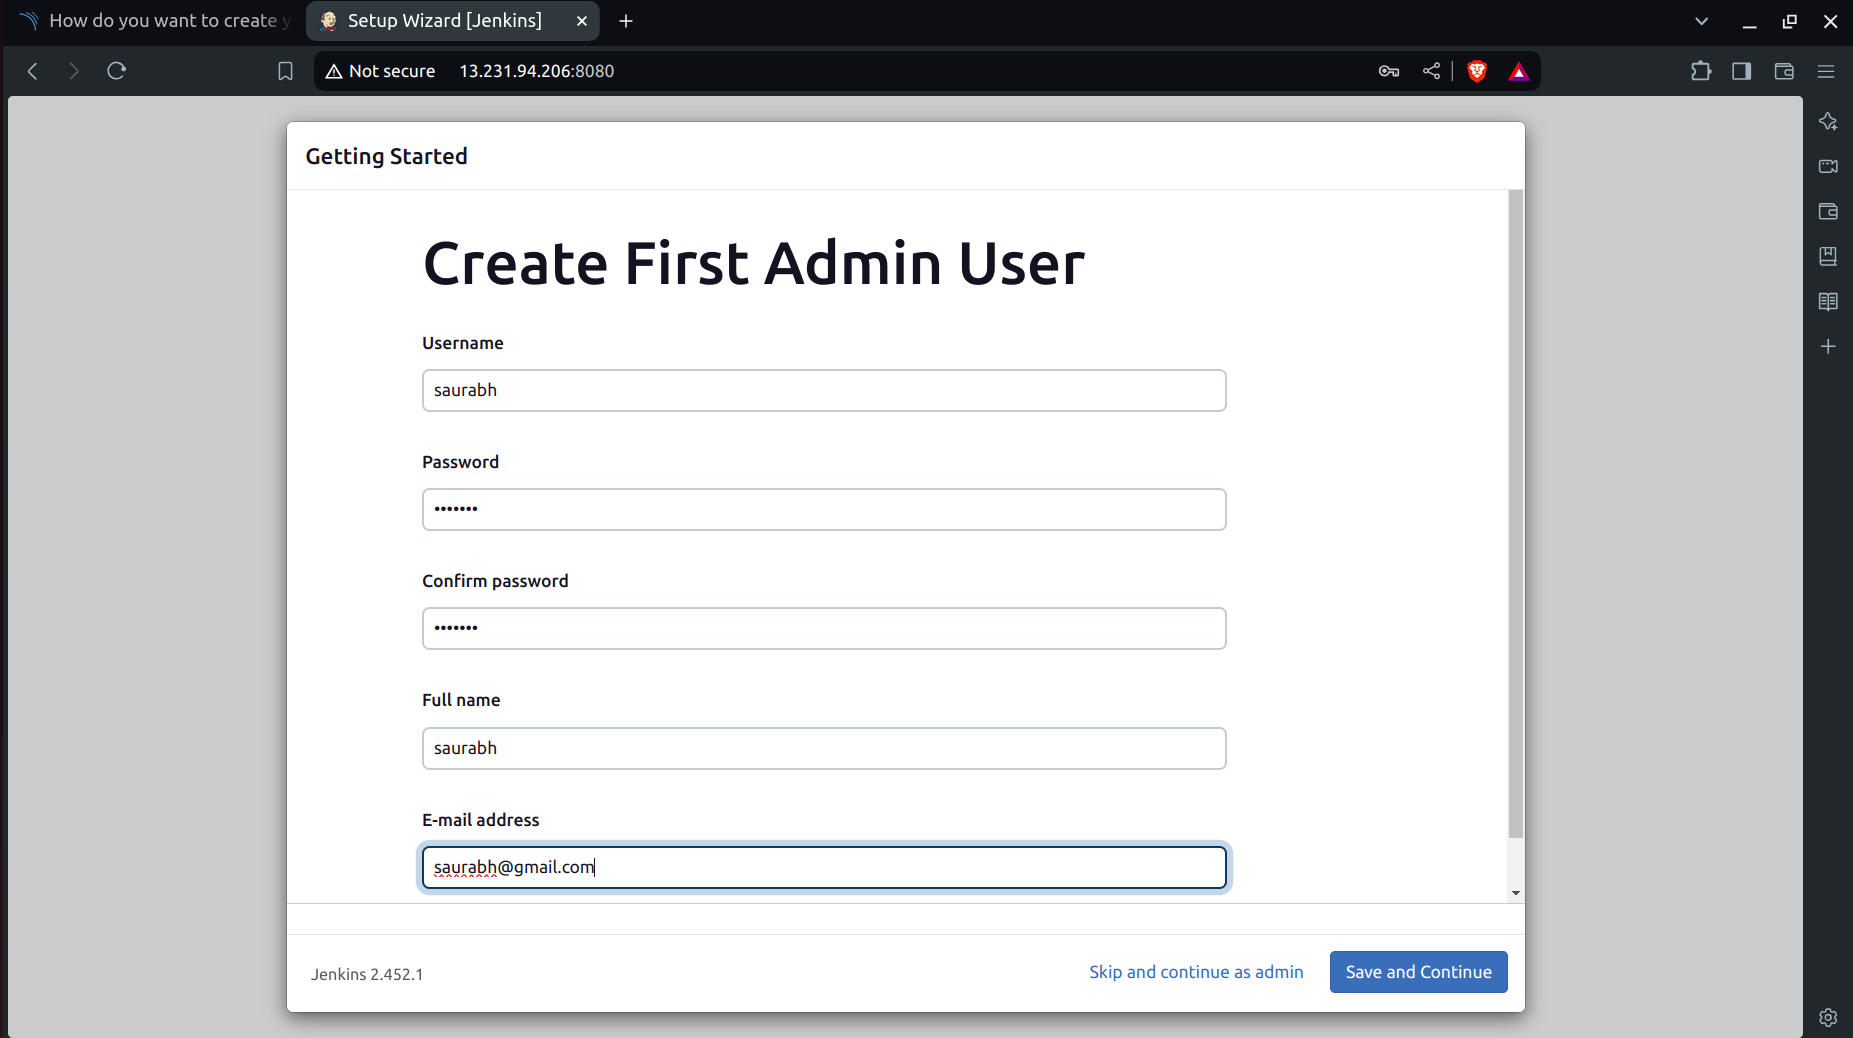
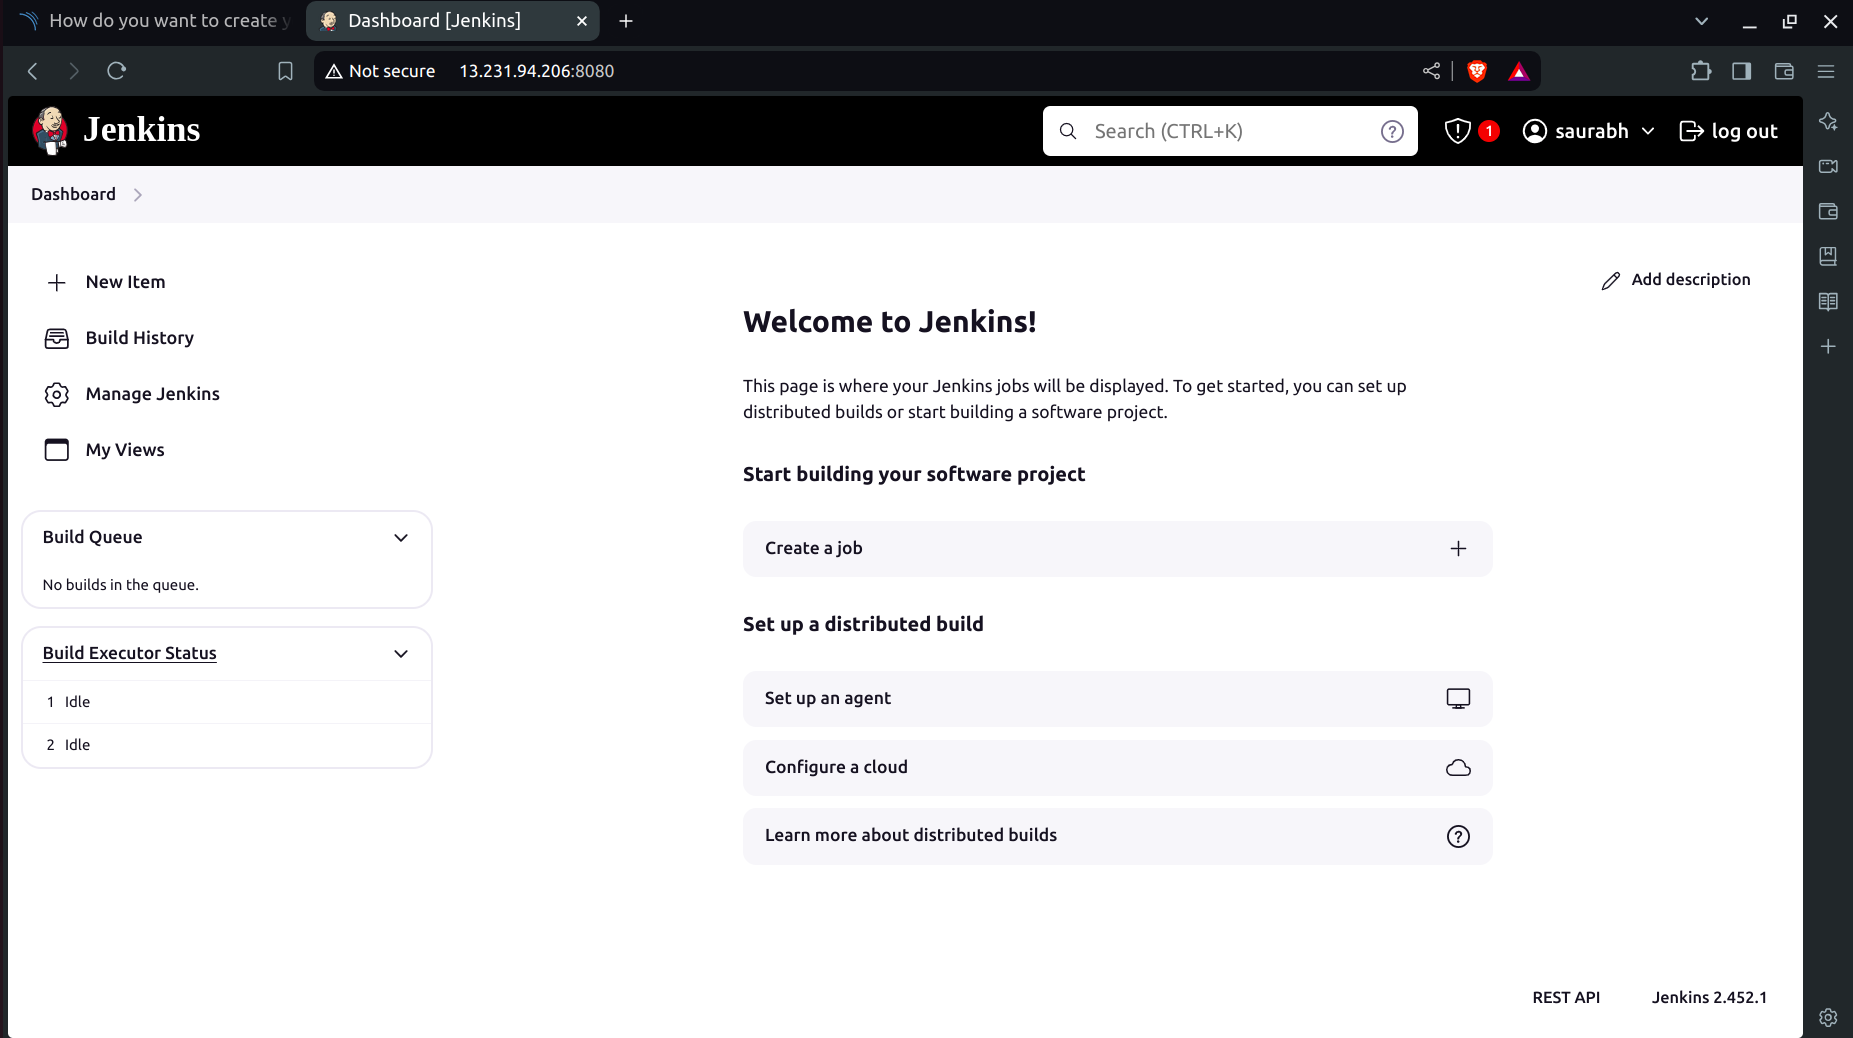
Successfully you have entered into the Jenkins dashboard!
Step 6: CI/CD Pipeline
A. Installation of Plugins
Go to the Jenkins Dashboard -> Manage Jenkins -> Plugins and Install the Following Plugins:
Eclipse Temurin Installer: Install without restart
SonarQube Scanner: Install without restart
NodeJs Plugin: Install without restart
OWASP Dependency-Check Plugin
Prometheus metrics: To monitor Jenkins on the Grafana dashboard
Download Docker-related Plugins: Docker, Docker Commons, Docker Pipeline, Docker API
Kubernetes
Kubernetes CLI
Kubernetes Client API
Kubernetes Pipeline DevOps Steps
B. Add Credentials for SonarQube and Docker
a. SonarQube Credentials Setup:
Go to http://publicip:9000.
Log in with your username and password.
Click on Security → Users → Token → Generate Token.
Set
token_nameasjenkins.
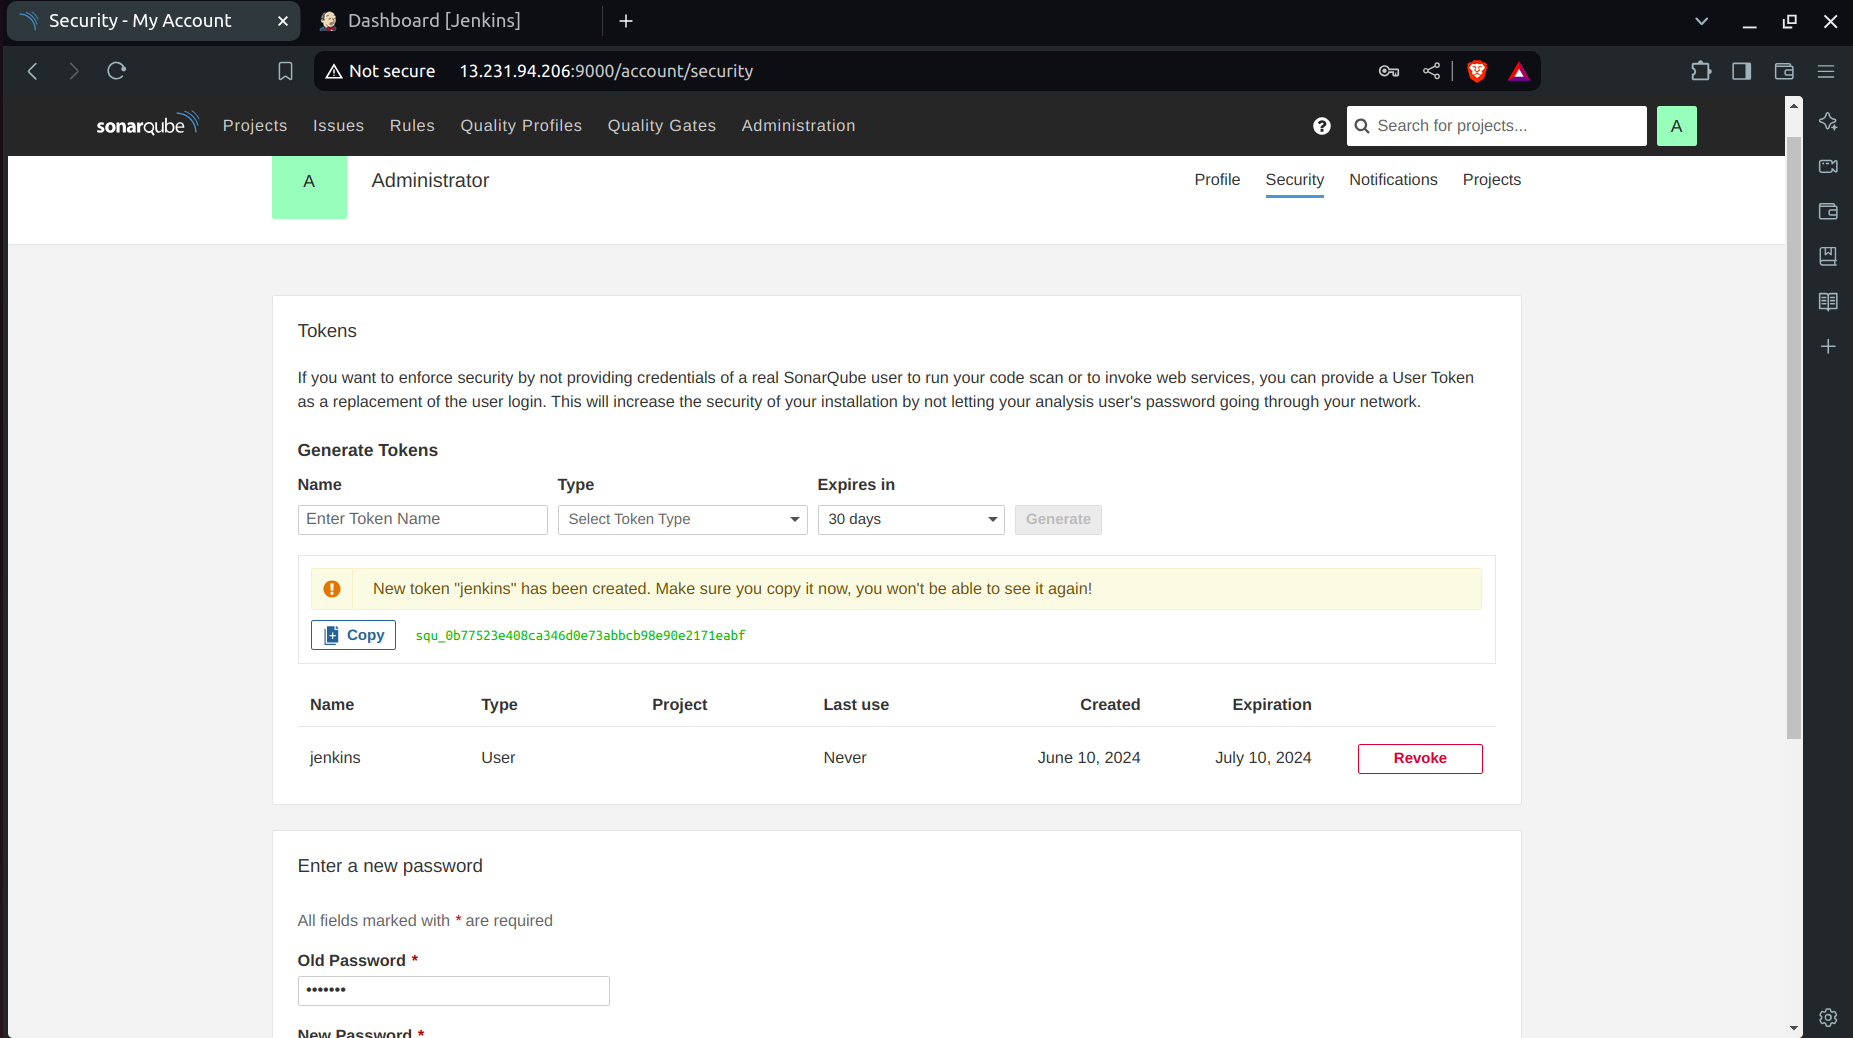
- Copy the Token.
b. Configure Jenkins:
Copy the generated token.
Go to your Jenkins dashboard.
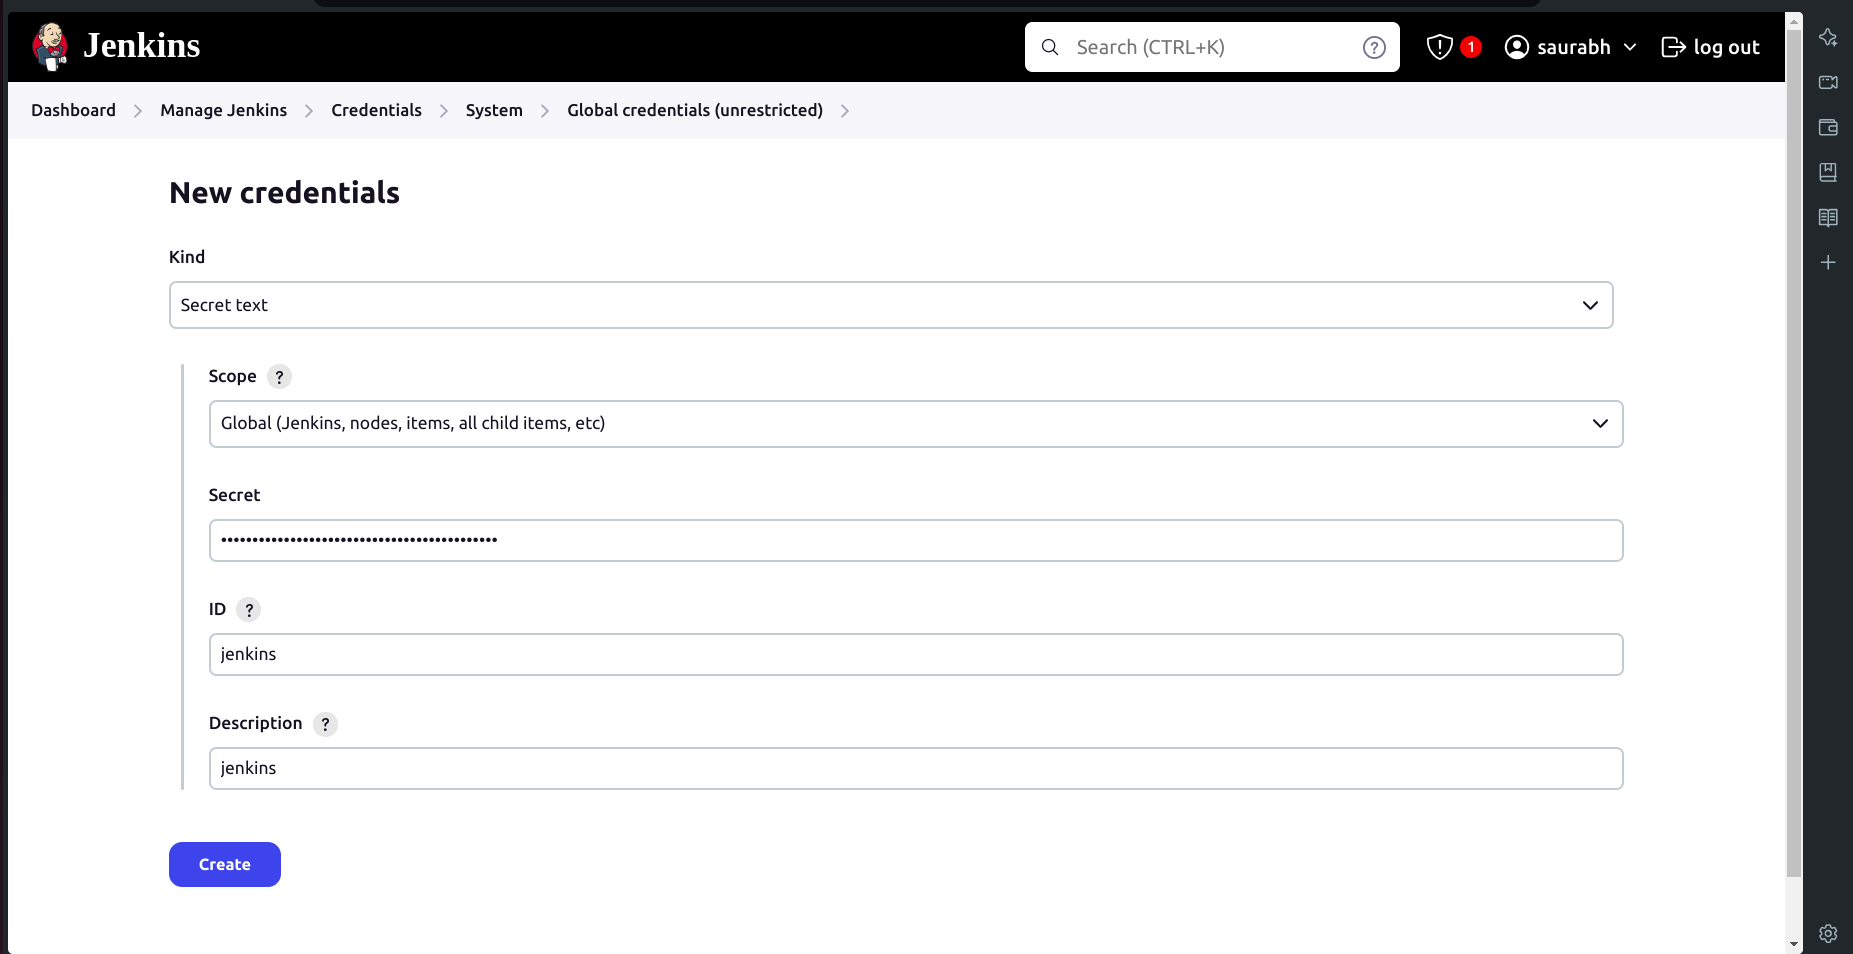
Navigate to Manage Jenkins → Credentials → System.
Click on Global → Add Credentials.
Select Secret text from the dropdown.
Set the Secret as your token.
Set the ID as
jenkins.Click on Create.
c. Setup projects in SonarQube for Jenkins
Go to your SonarQube server.
Click on projects and in the name field type
AI.Click on set up.
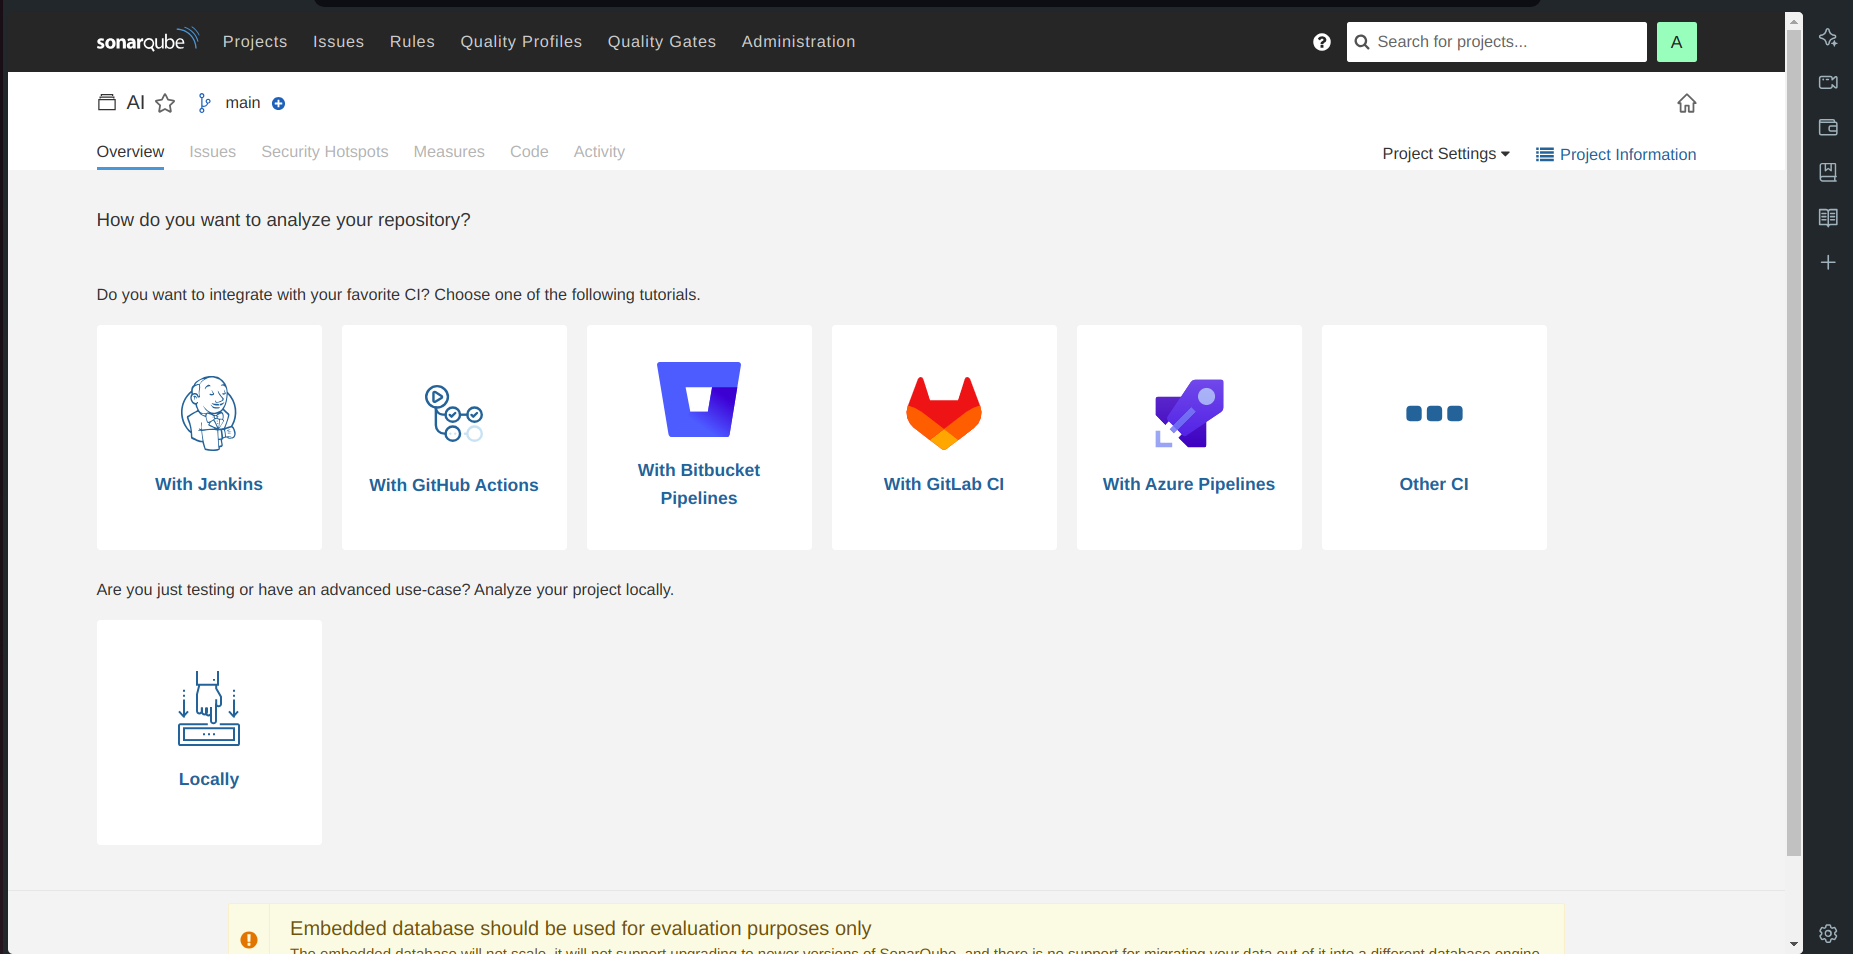
- Click on the above option i.e Locally.
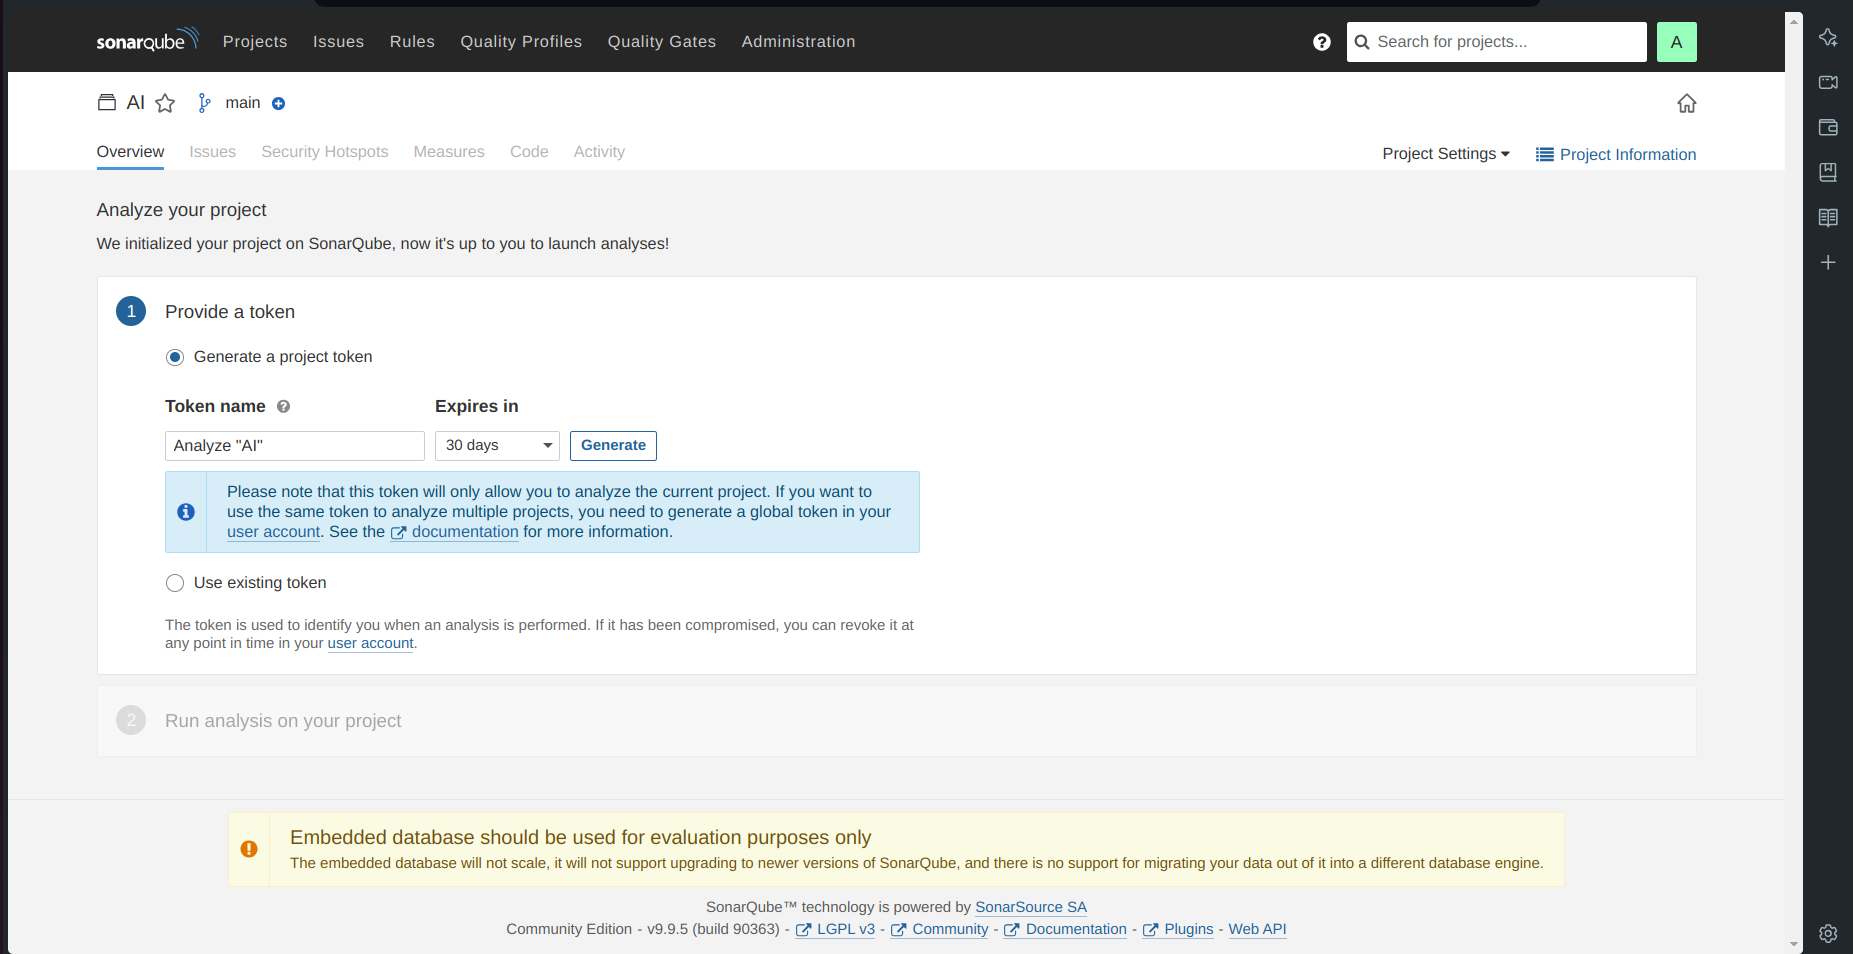
Click on Generate.
Click on continue.
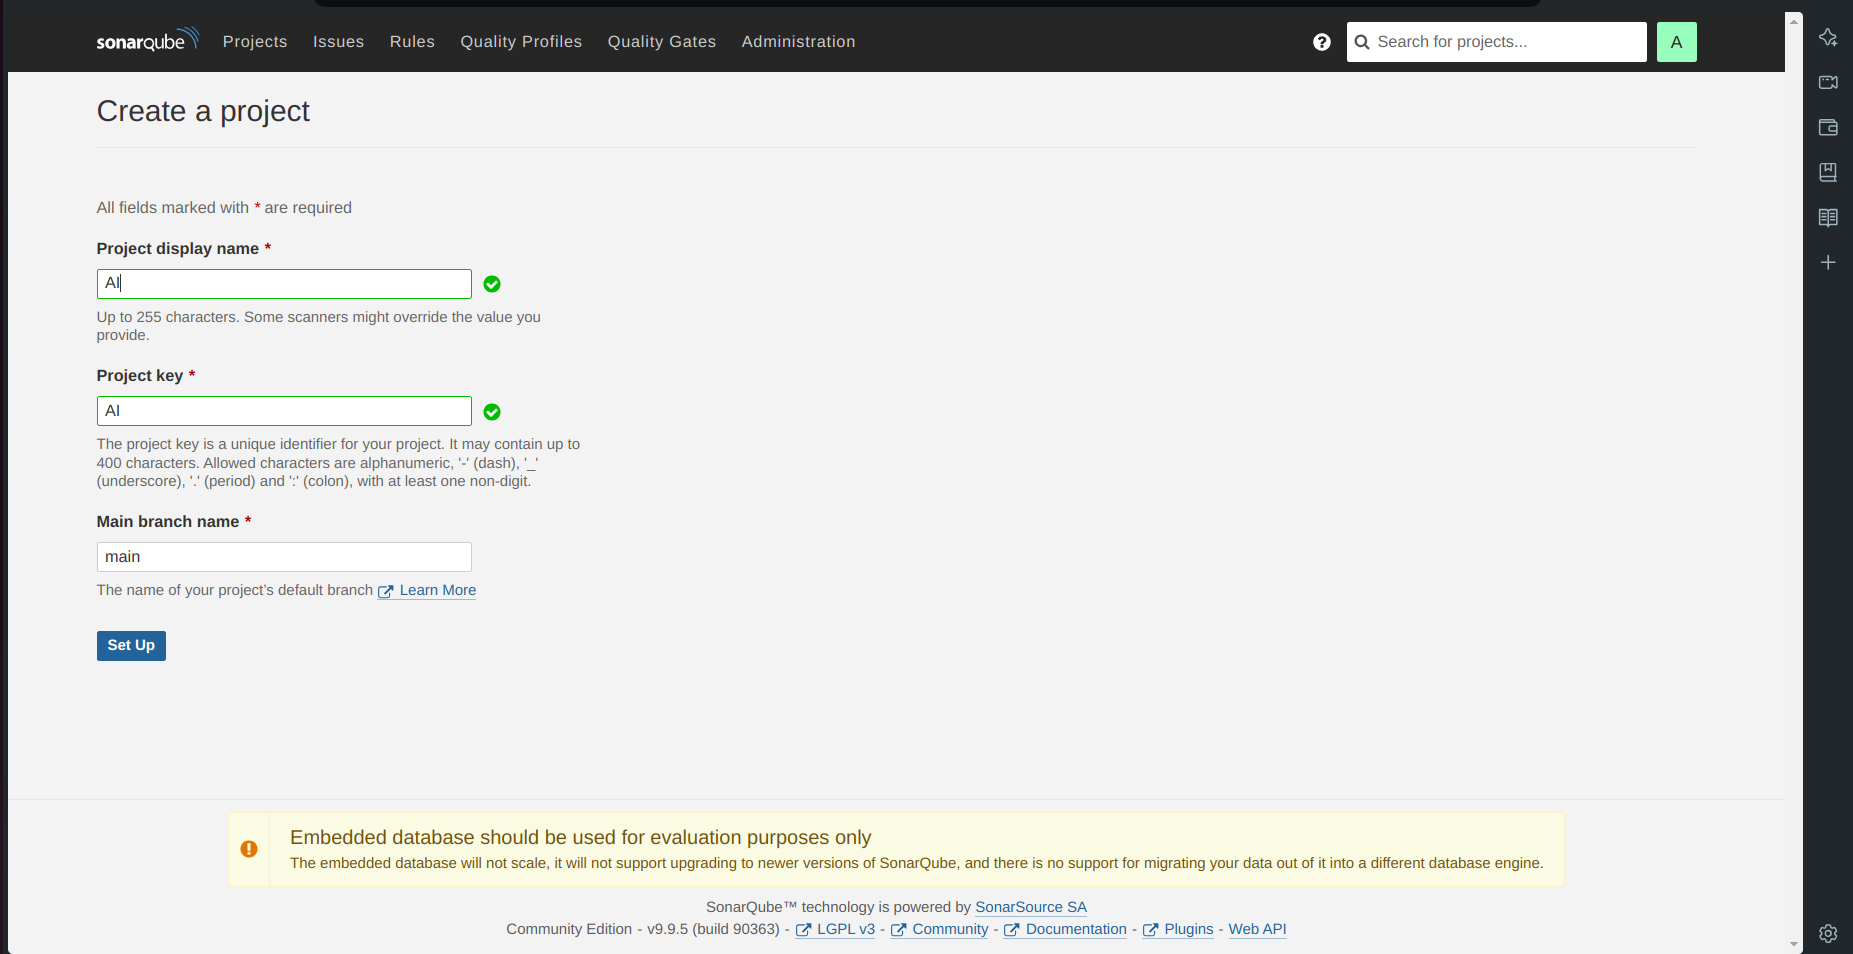
SonarQube Project for Jenkins is setup now.
d. Setup Docker Credentials
Go to your Jenkins dashboard.
Navigate to Manage Jenkins → Manage Credentials.
Click on Global → Add Credentials.
Provide your DockerHub username and password.
Set the ID as docker.
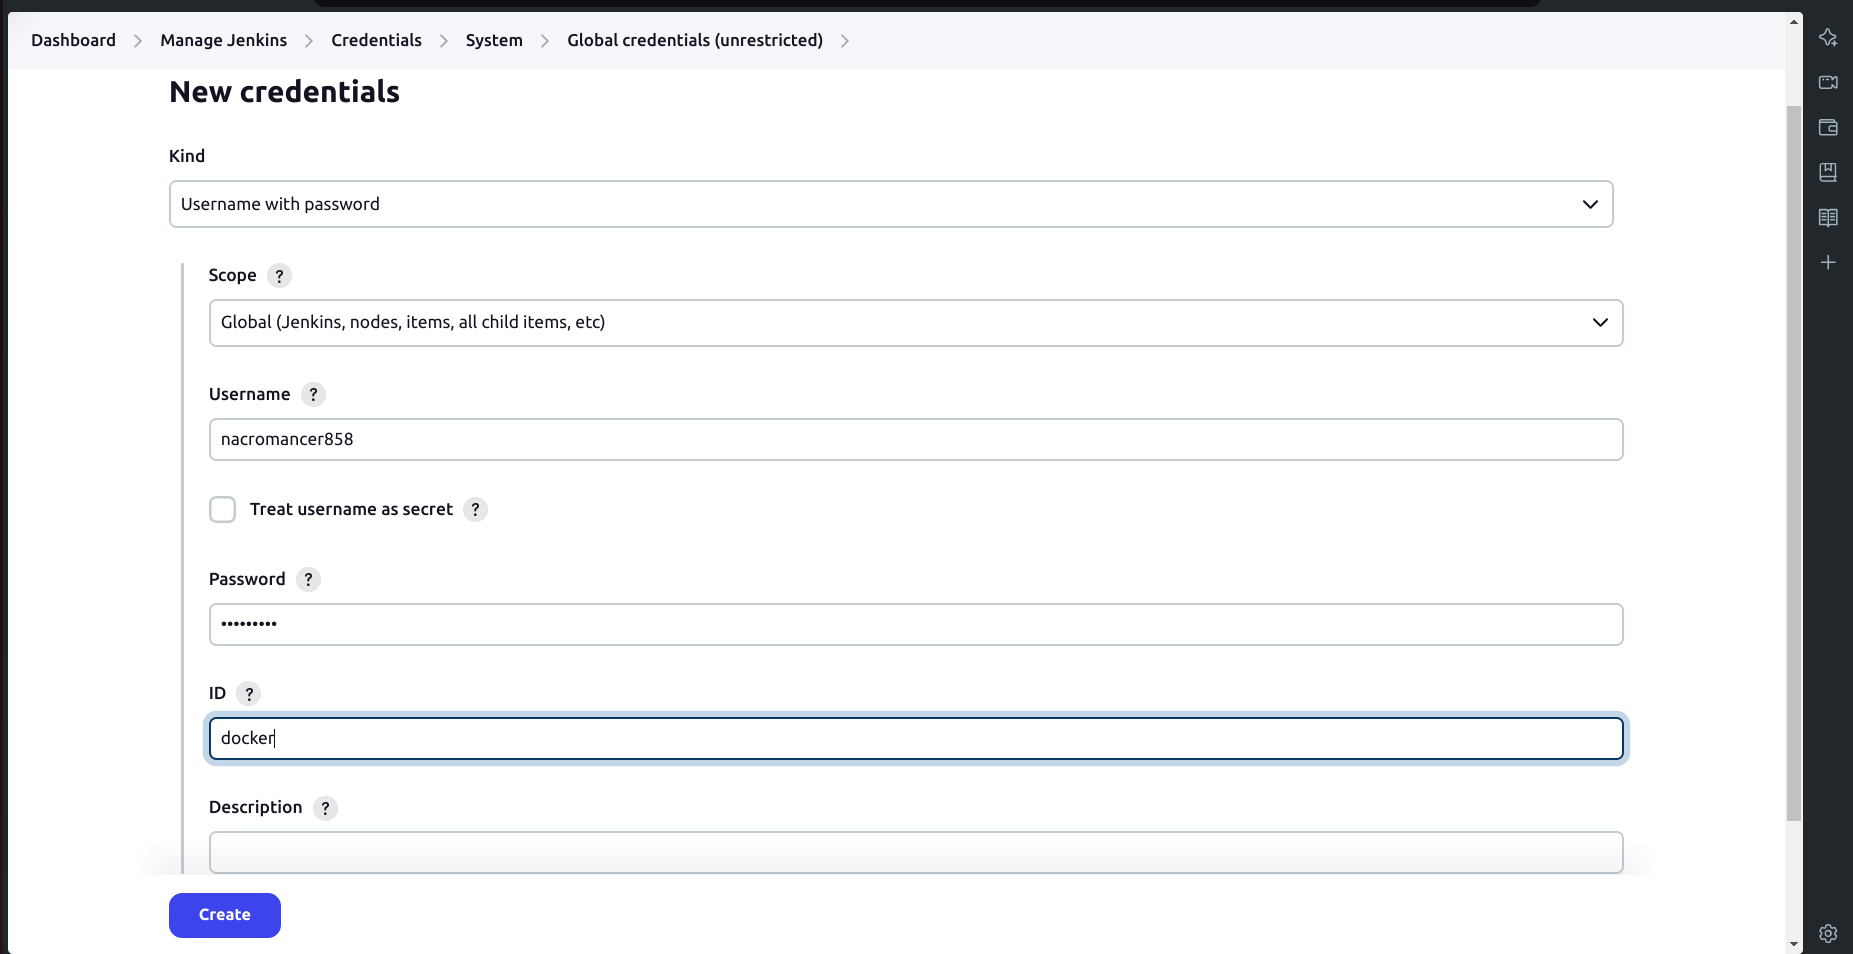
- Click on Create.
C. Setup Tools for Jenkins
a.Add JDK:
Go to Manage Jenkins → Tools.
Click on Add JDK and select the installer from adoptium.net.
Choose JDK version
17.0.8.1+1and name it asjdk17.
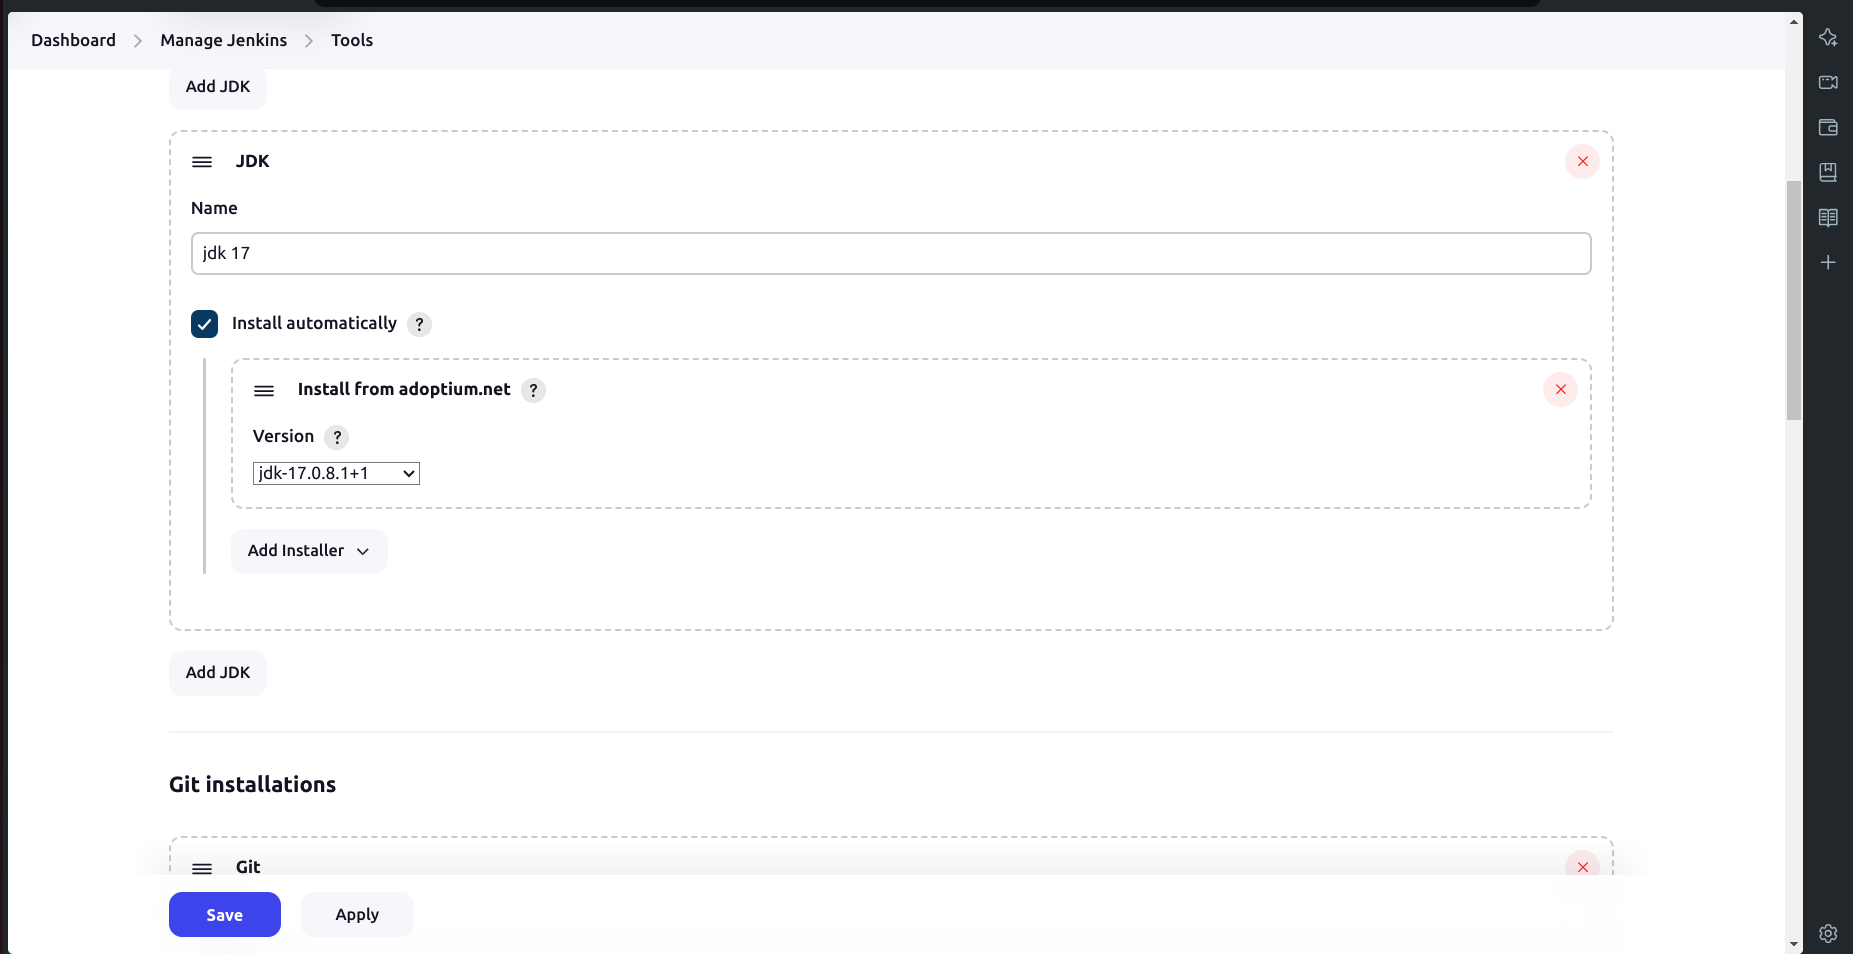
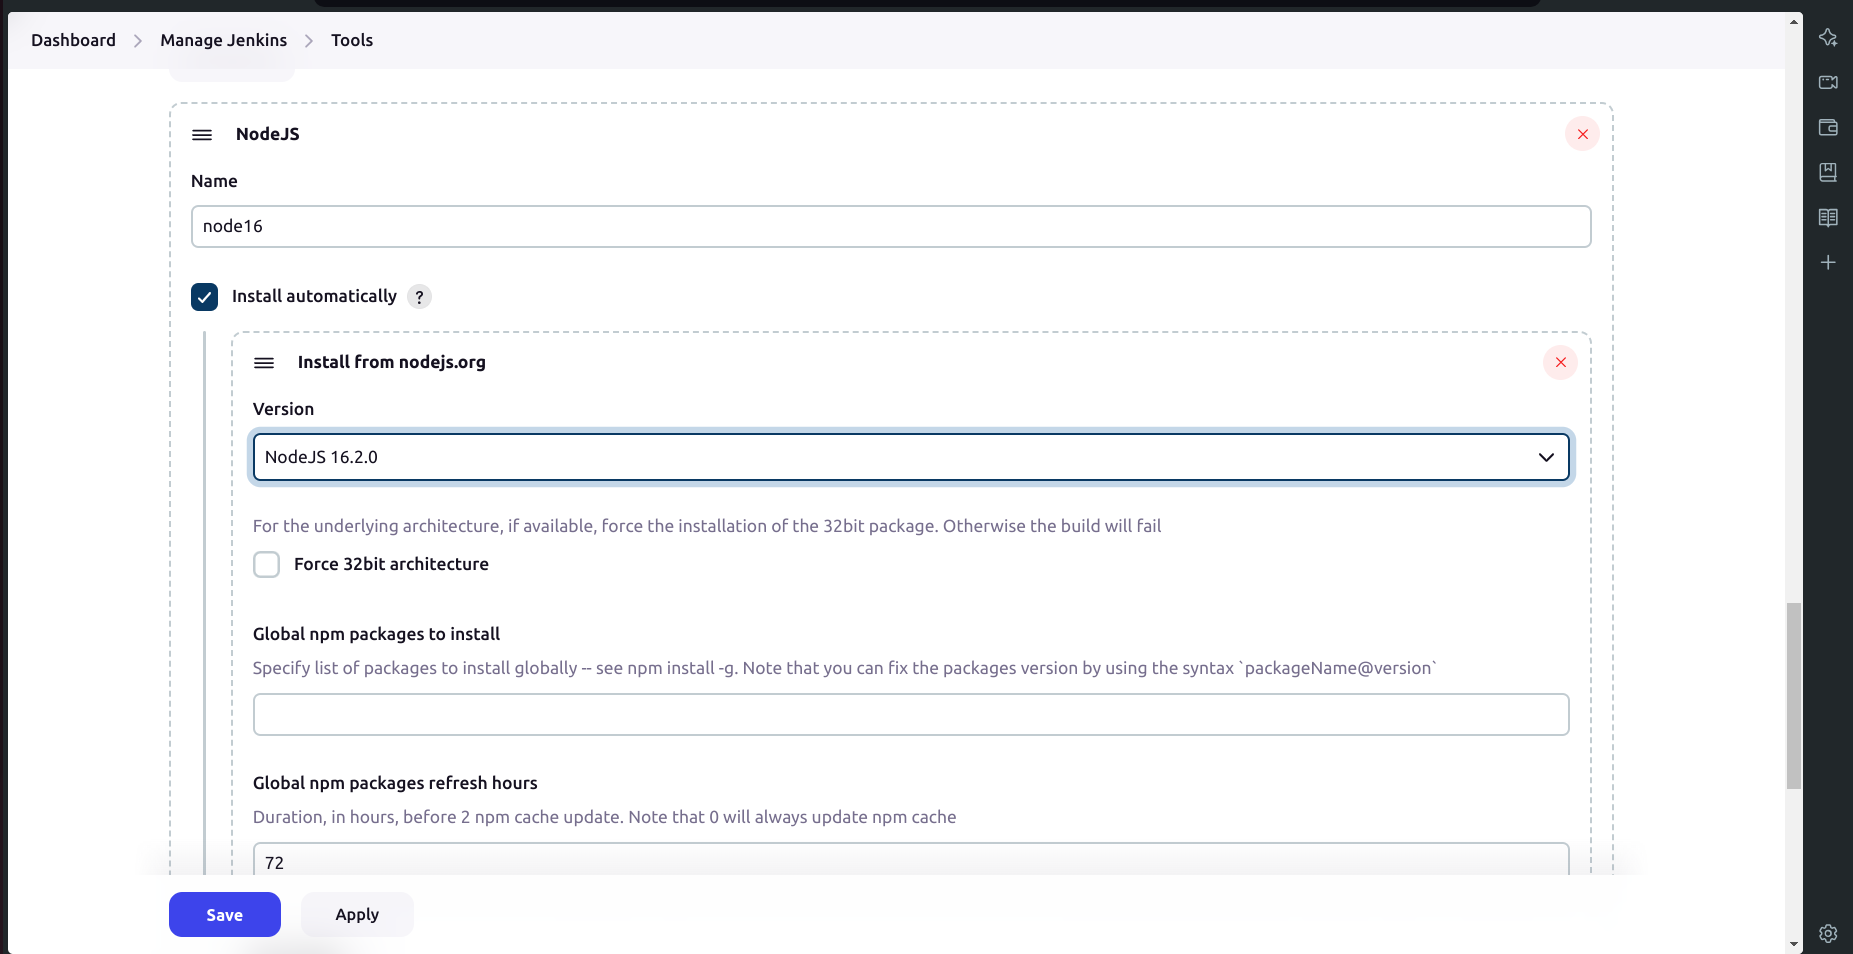
b. Add Node.js:
Click on Add NodeJS.
Name it as
node16.Choose Node.js version
16.2.0.
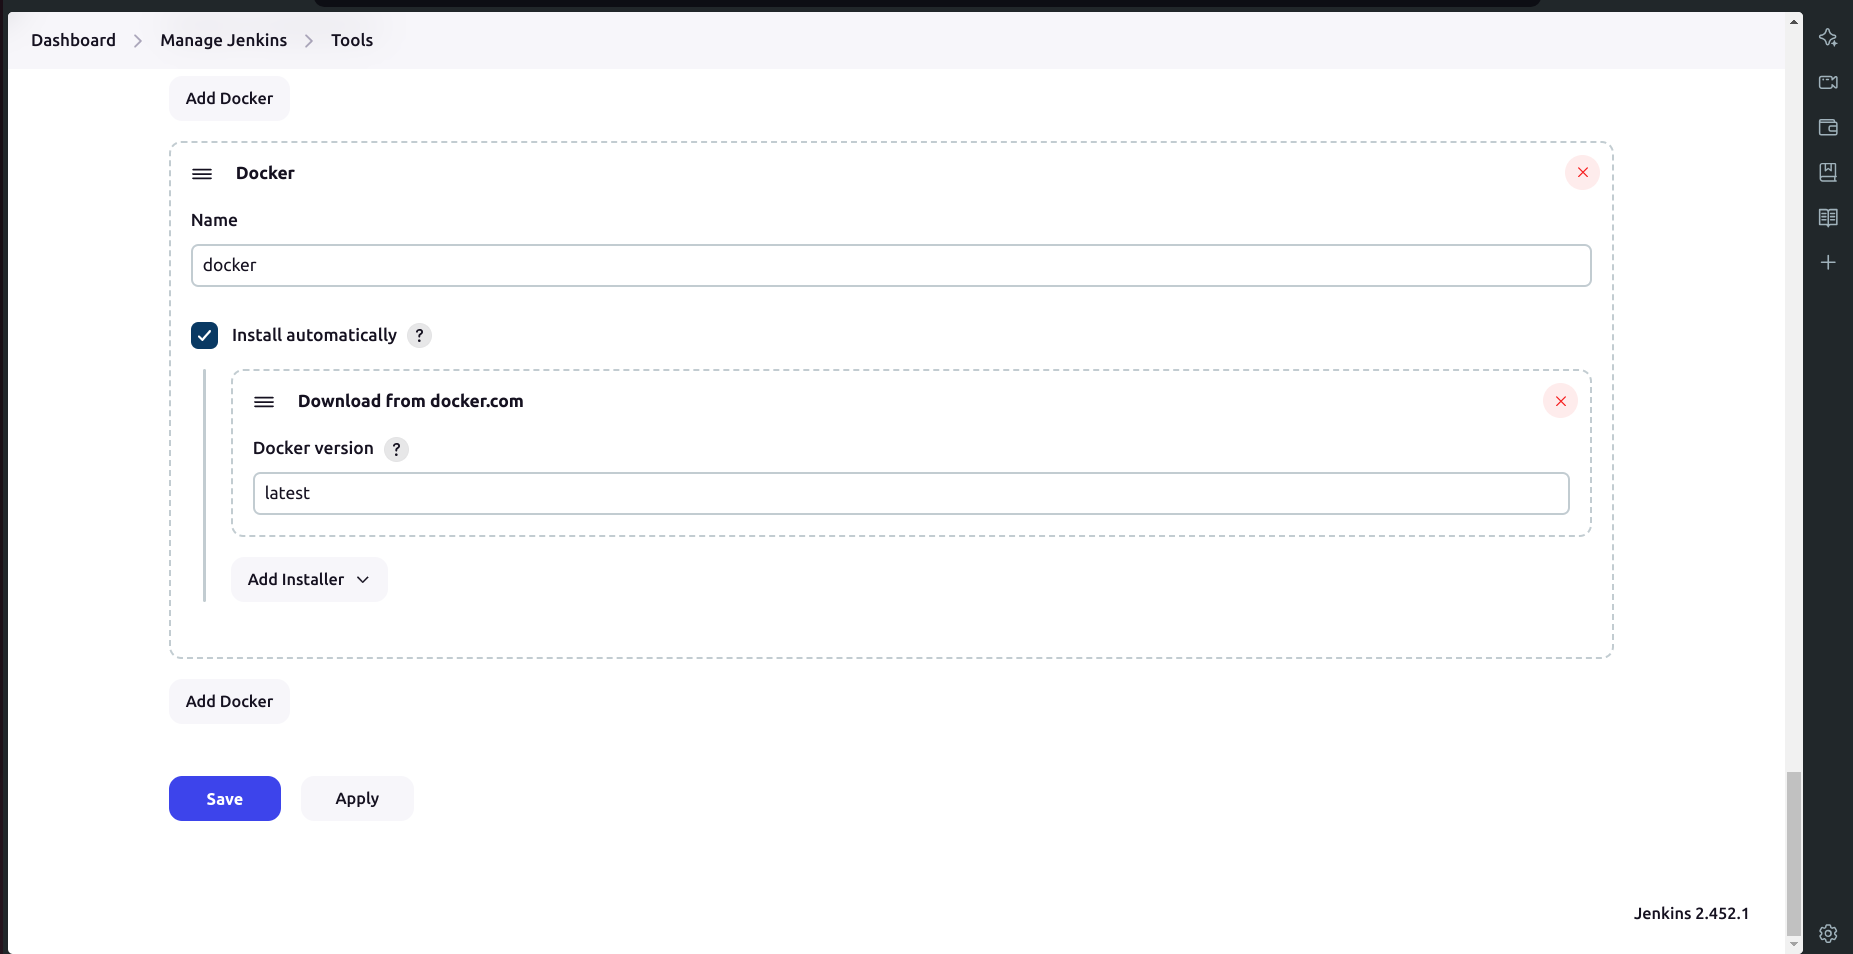
c. Add Docker:
Click on Add Docker.
Set the name as
docker.Choose the installer option to download from docker.com.
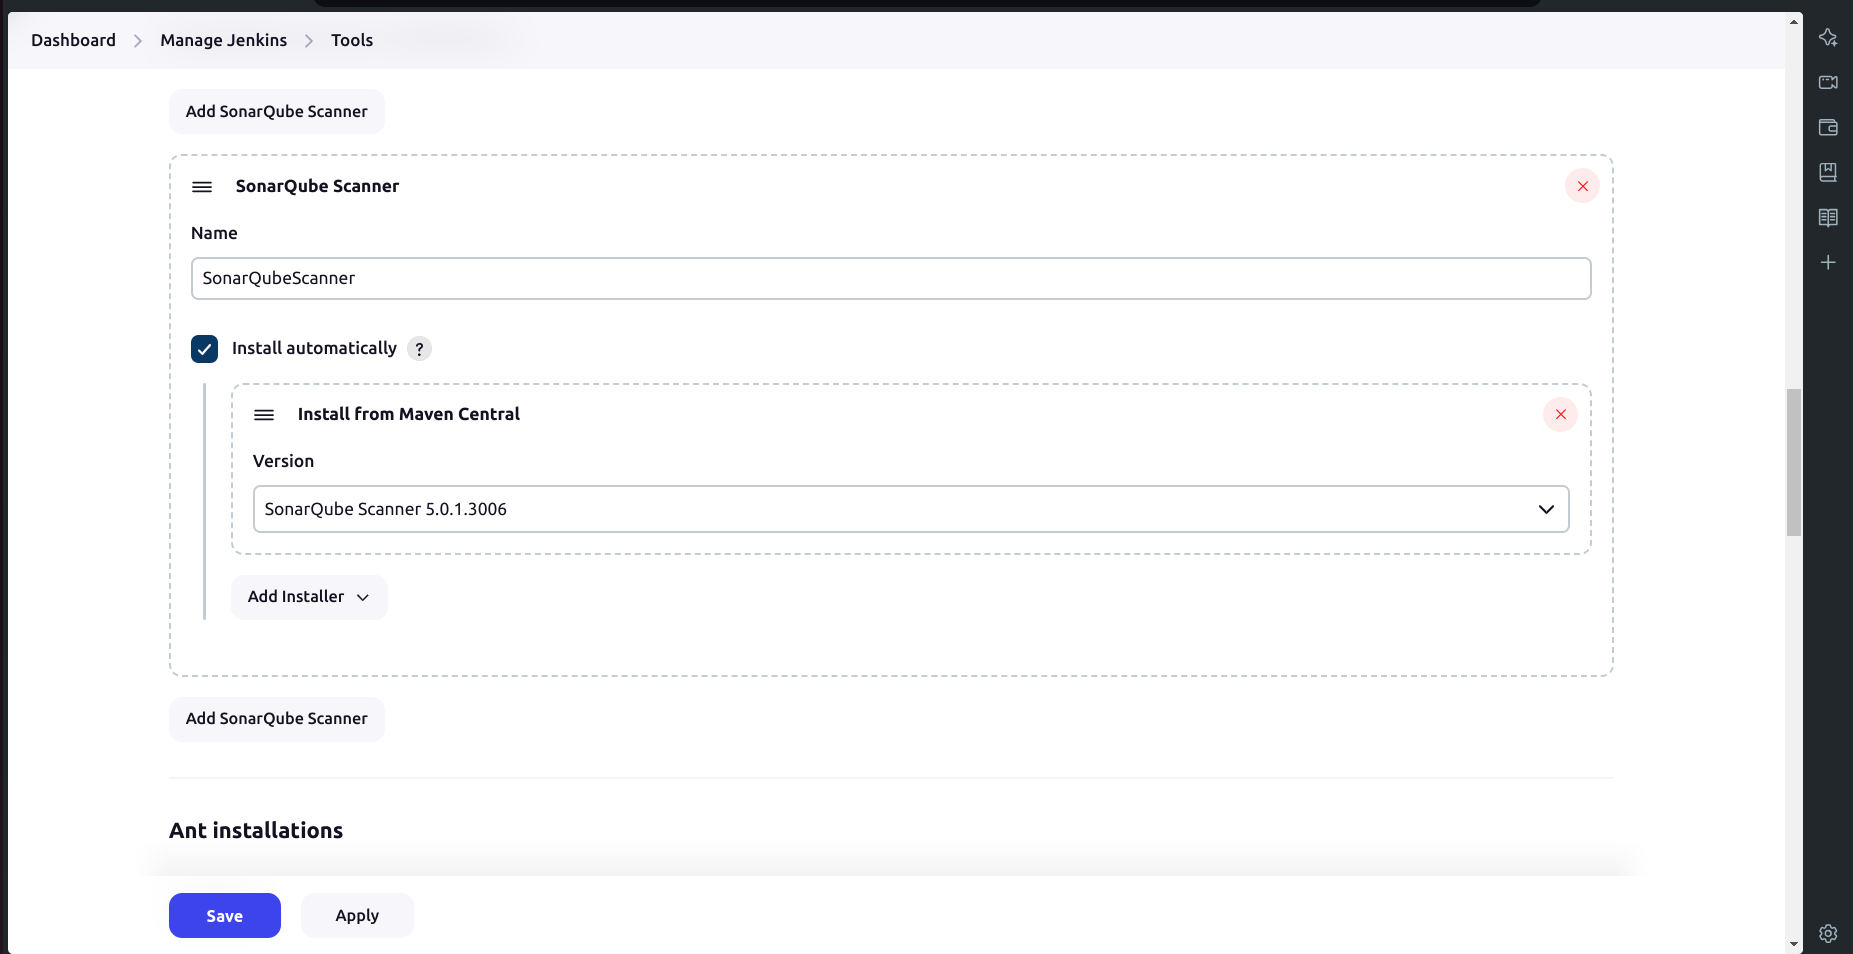
d. Add SonarQube Scanner:
Add Sonar Scanner.
Name it as
sonar-scanner/SonarQubeScanner.
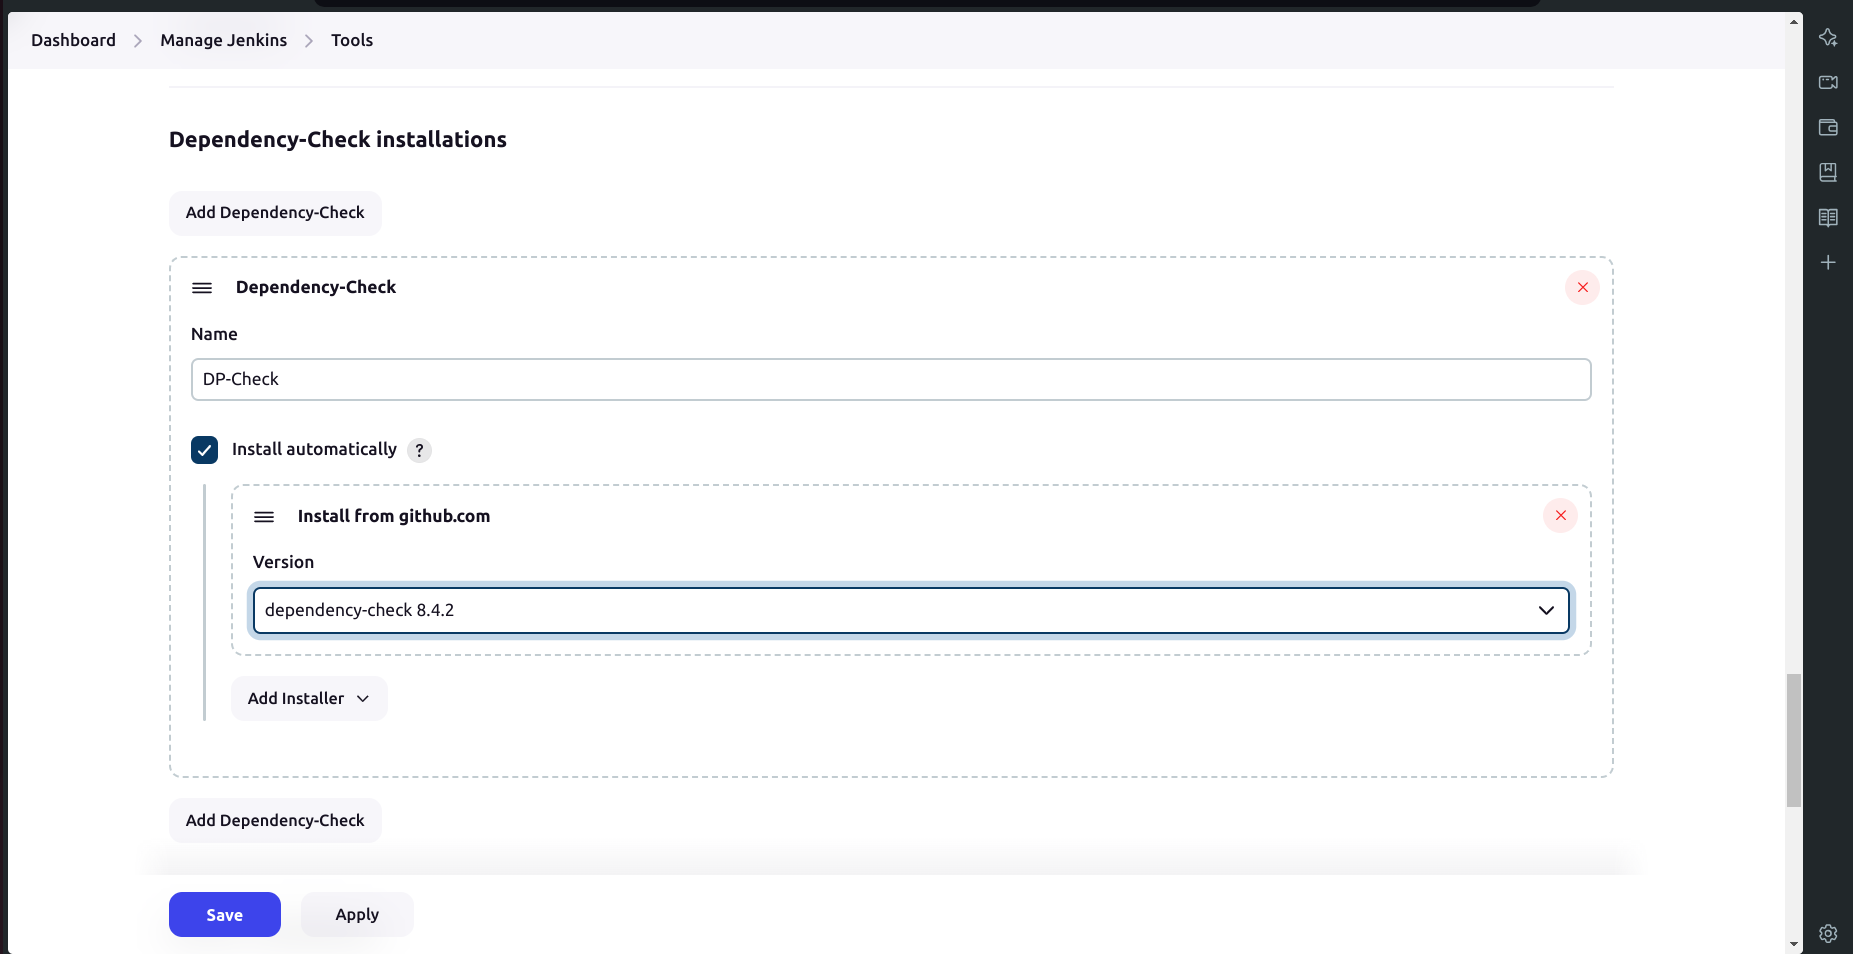
e. Add OWASP Dependency-Check:
Add Dependency Check.
Name it as
DP-Check.Select the installer option to install from github.com.
- Click Apply & Save.
D. Configure Global Settings for SonarQube and Setup Webhooks:
a. Configure Global Settings:
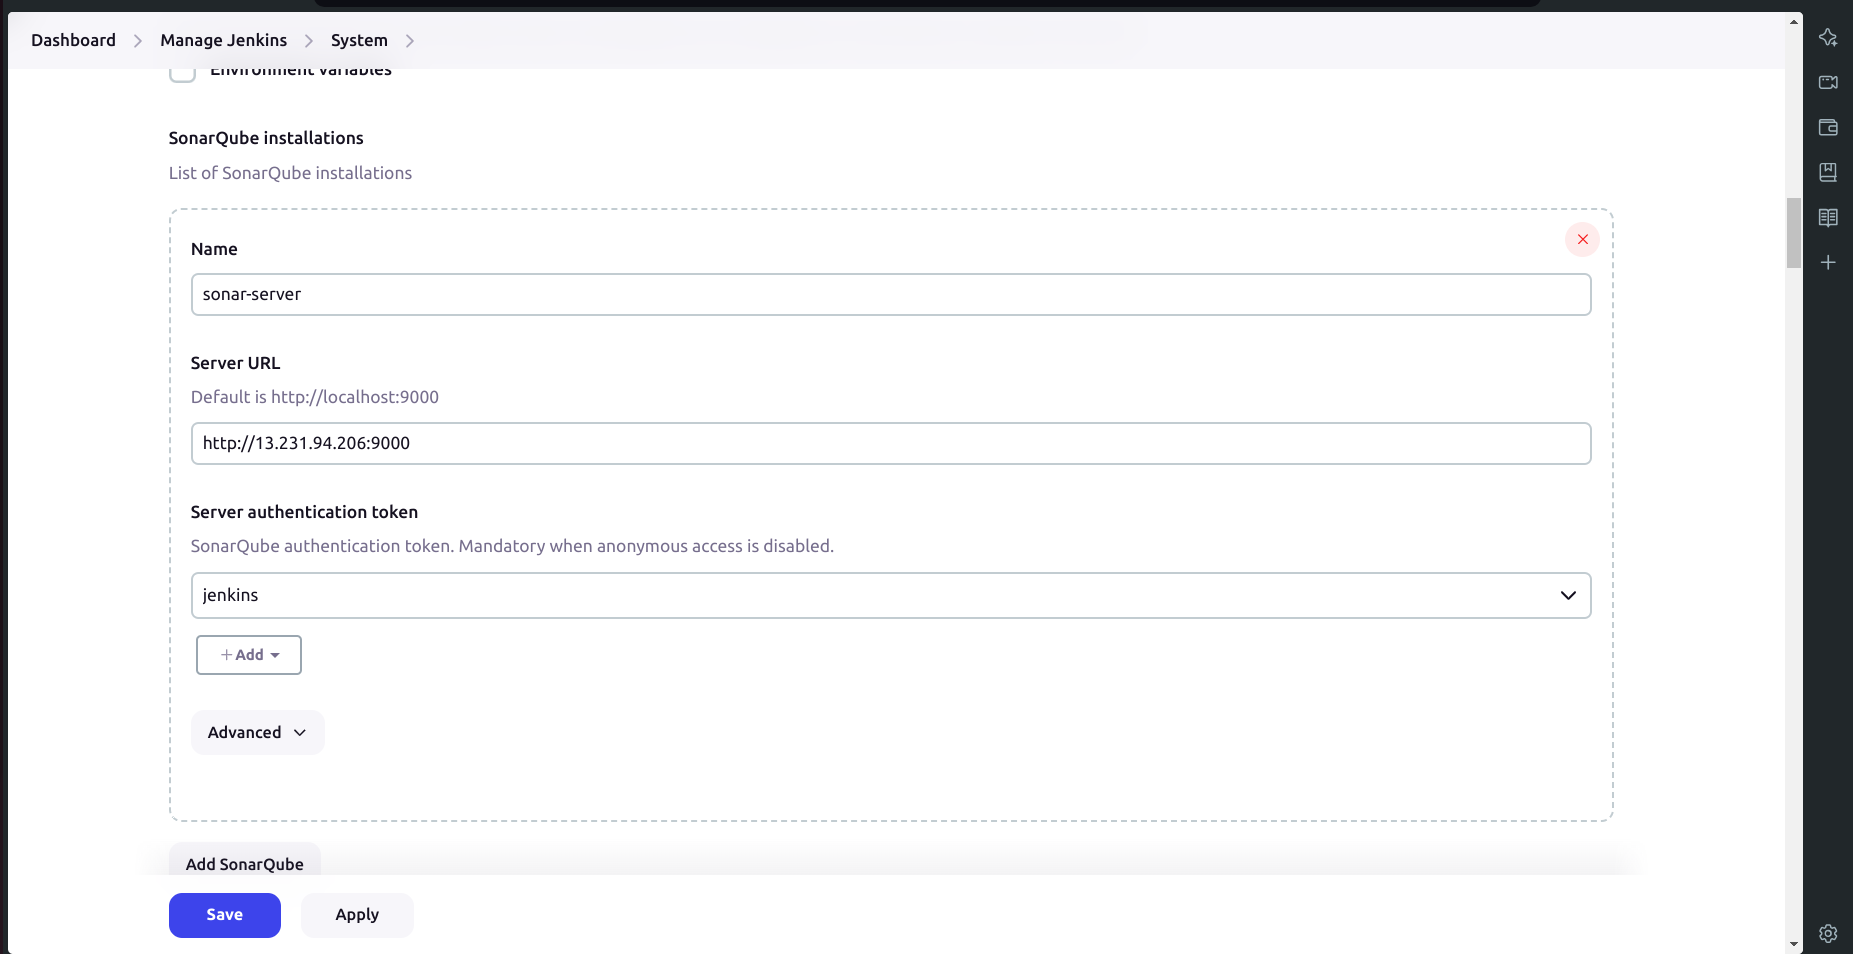
Go to Manage Jenkins → System → Add SonarQube Servers.
Set the name as
sonar-server.Set the server URL as
http://public_ip:9000.Set the server authentication token as
jenkins(It is created in sonarqube security configuration).
b. Setup Webhooks in SonarQube:
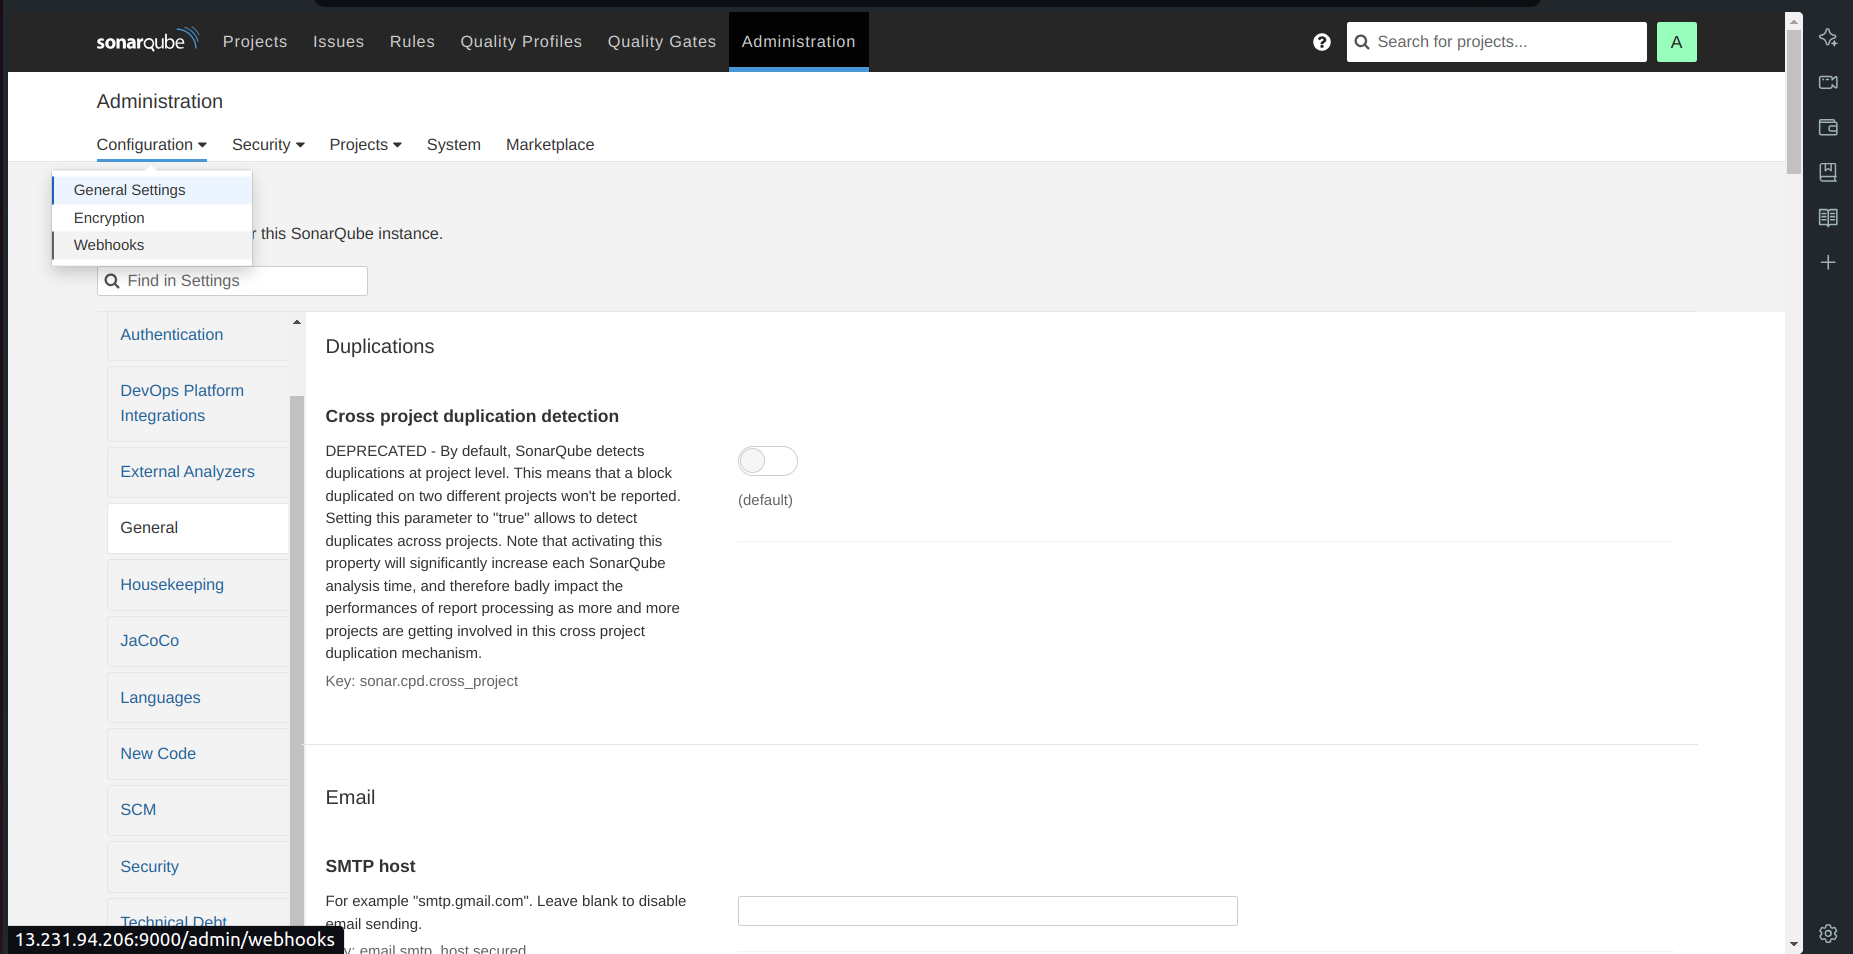
- Go to Administration → Configuration → Webhooks.
Create a webhook.
Enter the URL as
http://jenkins-public-ip:8080/sonarqube-webhook/.
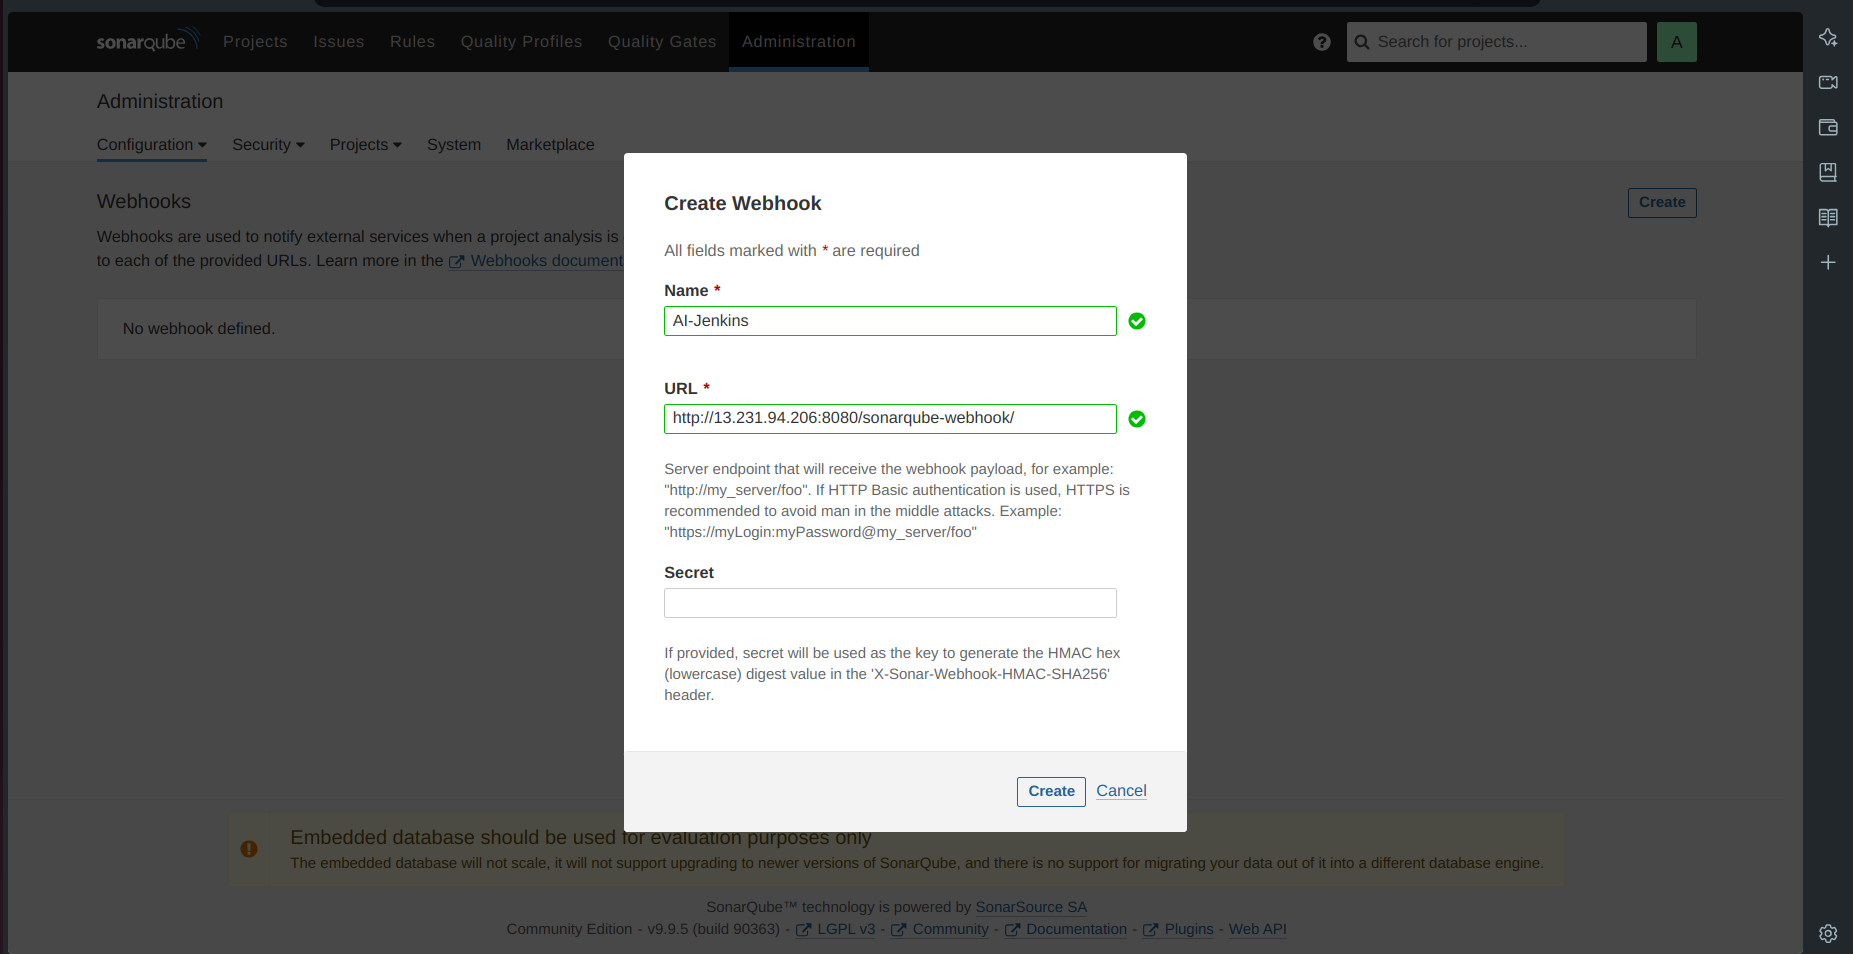
- Click on Create.
E. Running the Pipeline
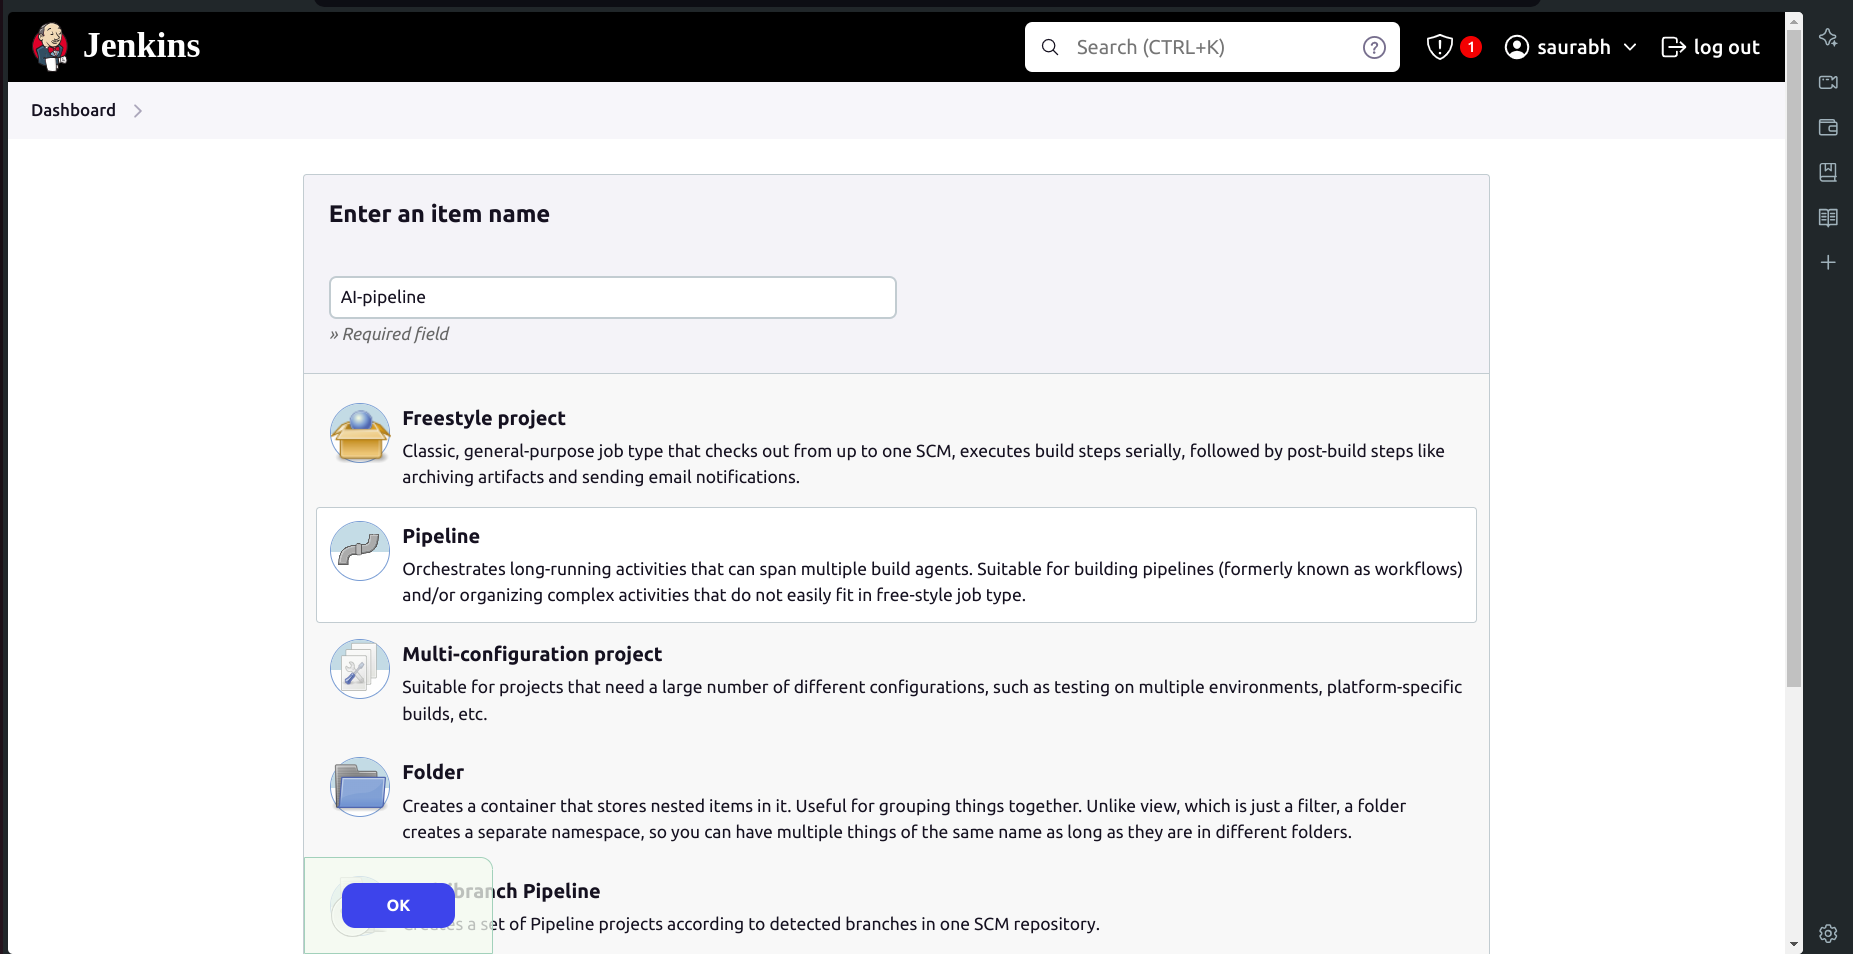
Create a New Pipeline:
Go to New Item → Select Pipeline.
Name it as
AI-pipeline.
- Scroll down to the pipeline script and copy-paste the following code:
pipeline{
    agent any
    tools{
        jdk 'jdk 17'
        nodejs 'node16'
    }
    environment {
        SCANNER_HOME=tool 'sonar-scanner'
    }
    stages {
        stage('Checkout from Git'){
            steps{
                git branch: 'main', url: 'https://github.com/Saurabh-DevOpsVoyager77/AI-Deployment.git'
            }
        }
        stage('Install Dependencies') {
            steps {
                sh "npm install"
            }
        }
        stage("Sonarqube Analysis "){
            steps{
                withSonarQubeEnv('sonar-server') {
                    sh ''' $SCANNER_HOME/bin/sonar-scanner -Dsonar.projectName=Chatbot \
                    -Dsonar.projectKey=Chatbot '''
                }
            }
        }
        stage("quality gate"){
           steps {
                script {
                    waitForQualityGate abortPipeline: false, credentialsId: 'Sonar-token'
                }
            }
        }
        stage('OWASP FS SCAN') {
            steps {
                dependencyCheck additionalArguments: '--scan ./ --disableYarnAudit --disableNodeAudit', odcInstallation: 'DP-Check'
                dependencyCheckPublisher pattern: '**/dependency-check-report.xml'
            }
        }
        stage('TRIVY FS SCAN') {
            steps {
                sh "trivy fs . > trivyfs.json"
            }
        }
        stage("Docker Build & Push"){
            steps{
                script{
                   withDockerRegistry(credentialsId: 'docker', toolName: 'docker'){
                       sh "docker build -t chatbot ."
                       sh "docker tag chatbot nacromancer858/chatbot:latest "
                       sh "docker push nacromancer858/chatbot:latest "
                    }
                }
            }
        }
        stage("TRIVY"){
            steps{
                sh "trivy image nacromancer858/chatbot:latest > trivy.json"
            }
        }
        stage ("Remove container") {
            steps{
                sh "docker stop chatbot | true"
                sh "docker rm chatbot | true"
             }
        }
        stage('Deploy to container'){
            steps{
                sh 'docker run -d --name chatbot -p 3000:3000 nacromancer858/chatbot:latest'
            }
        }
    }
}
Run the Pipeline:
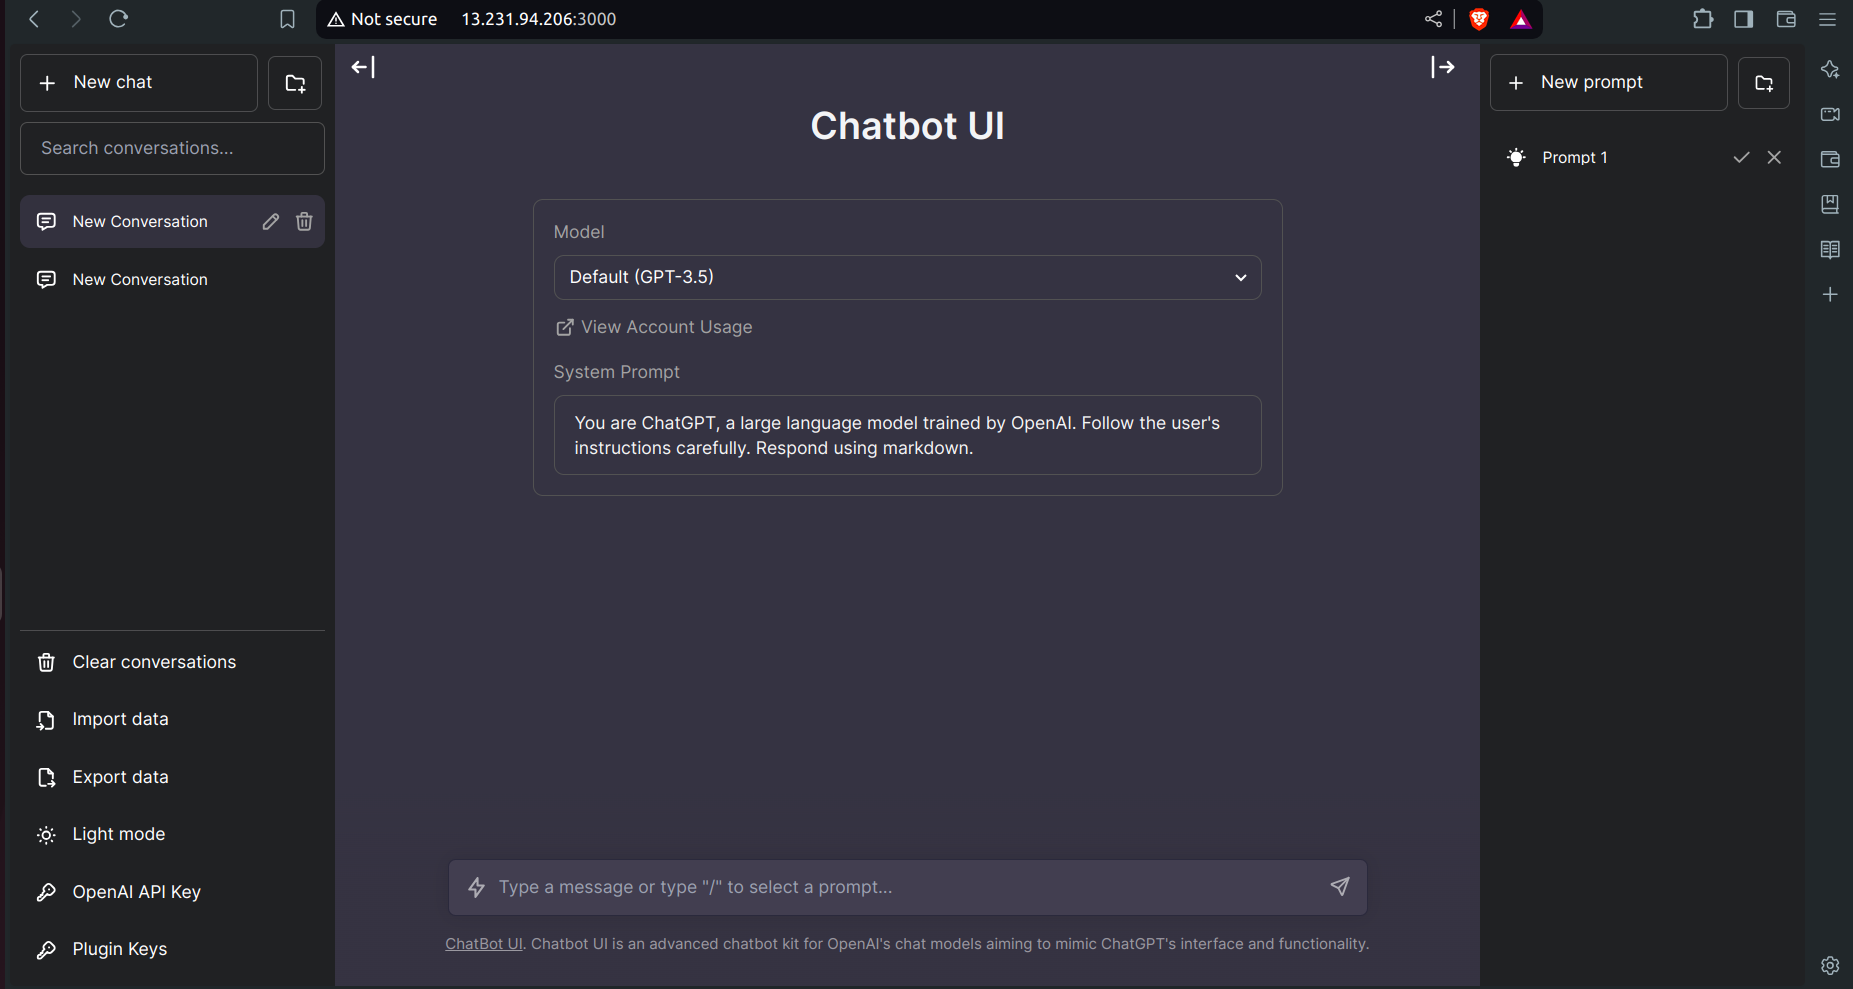
- Your application is now successfully deployed. Check DockerHub, and to access your application, go to your browser and type
http://your_public_ip:3000.
- Your application is now successfully deployed. Check DockerHub, and to access your application, go to your browser and type
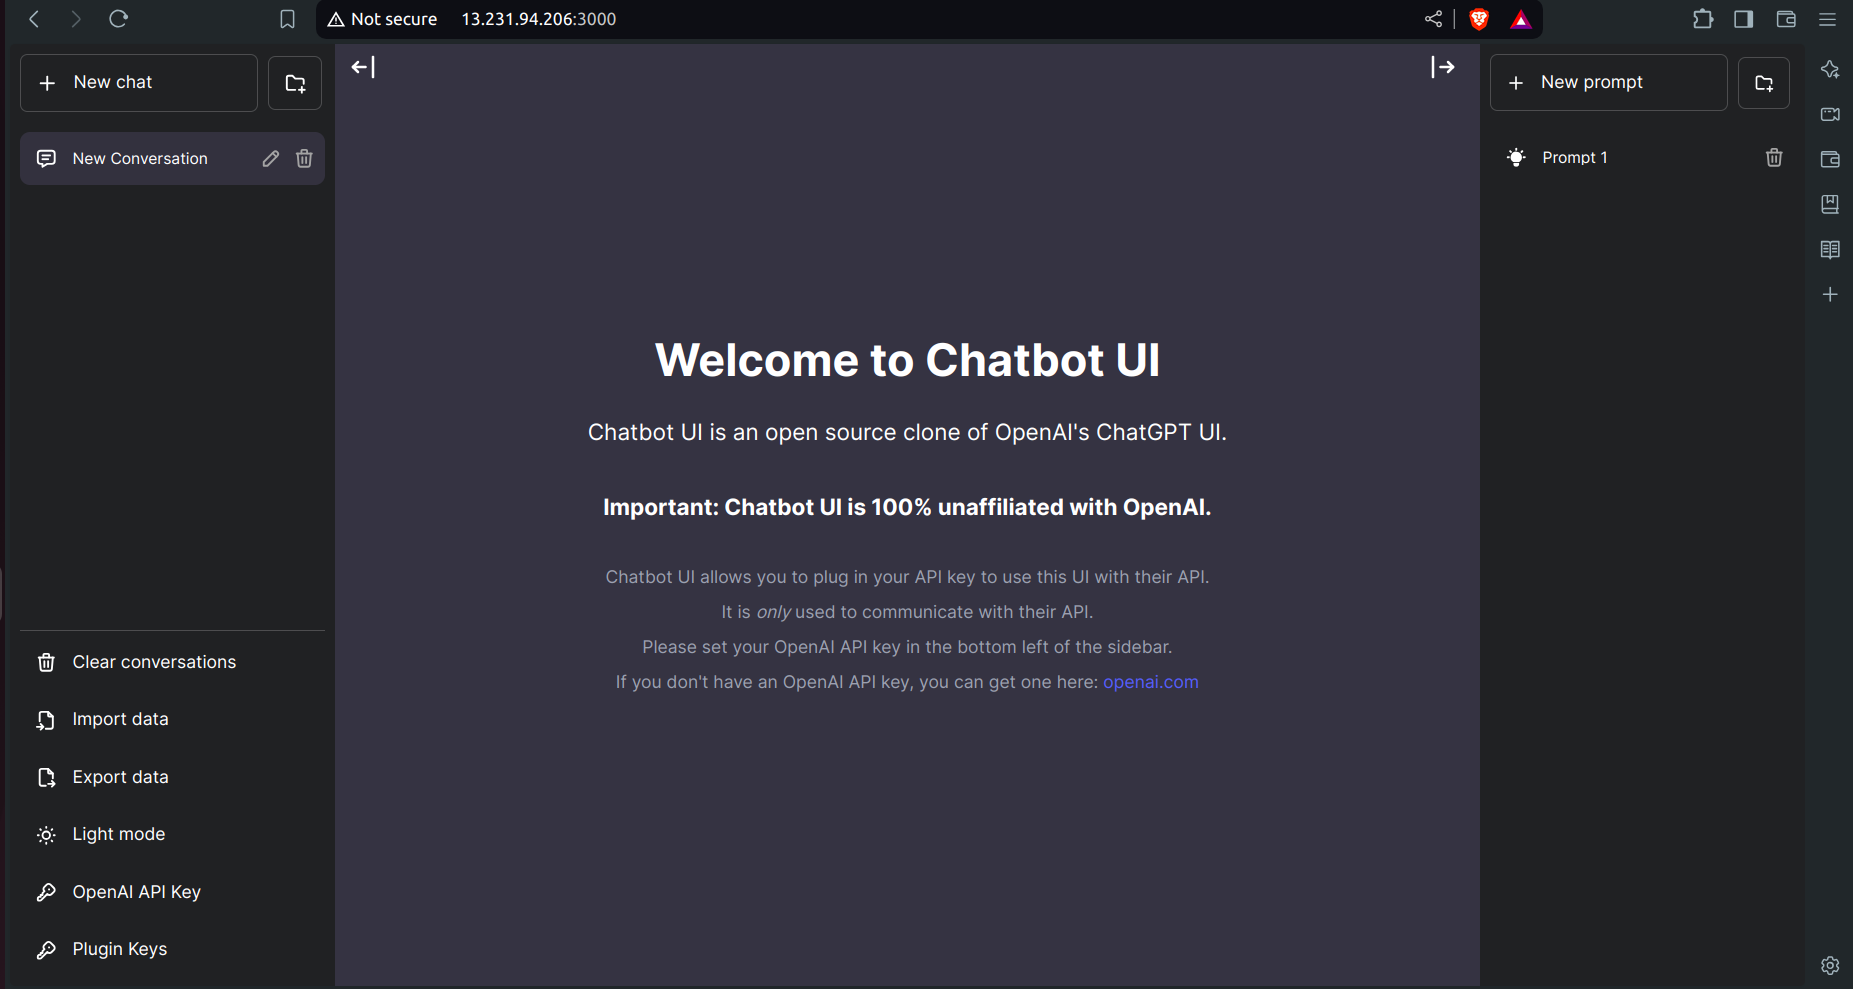
Now, you need an API to connect your application to OpenAI.
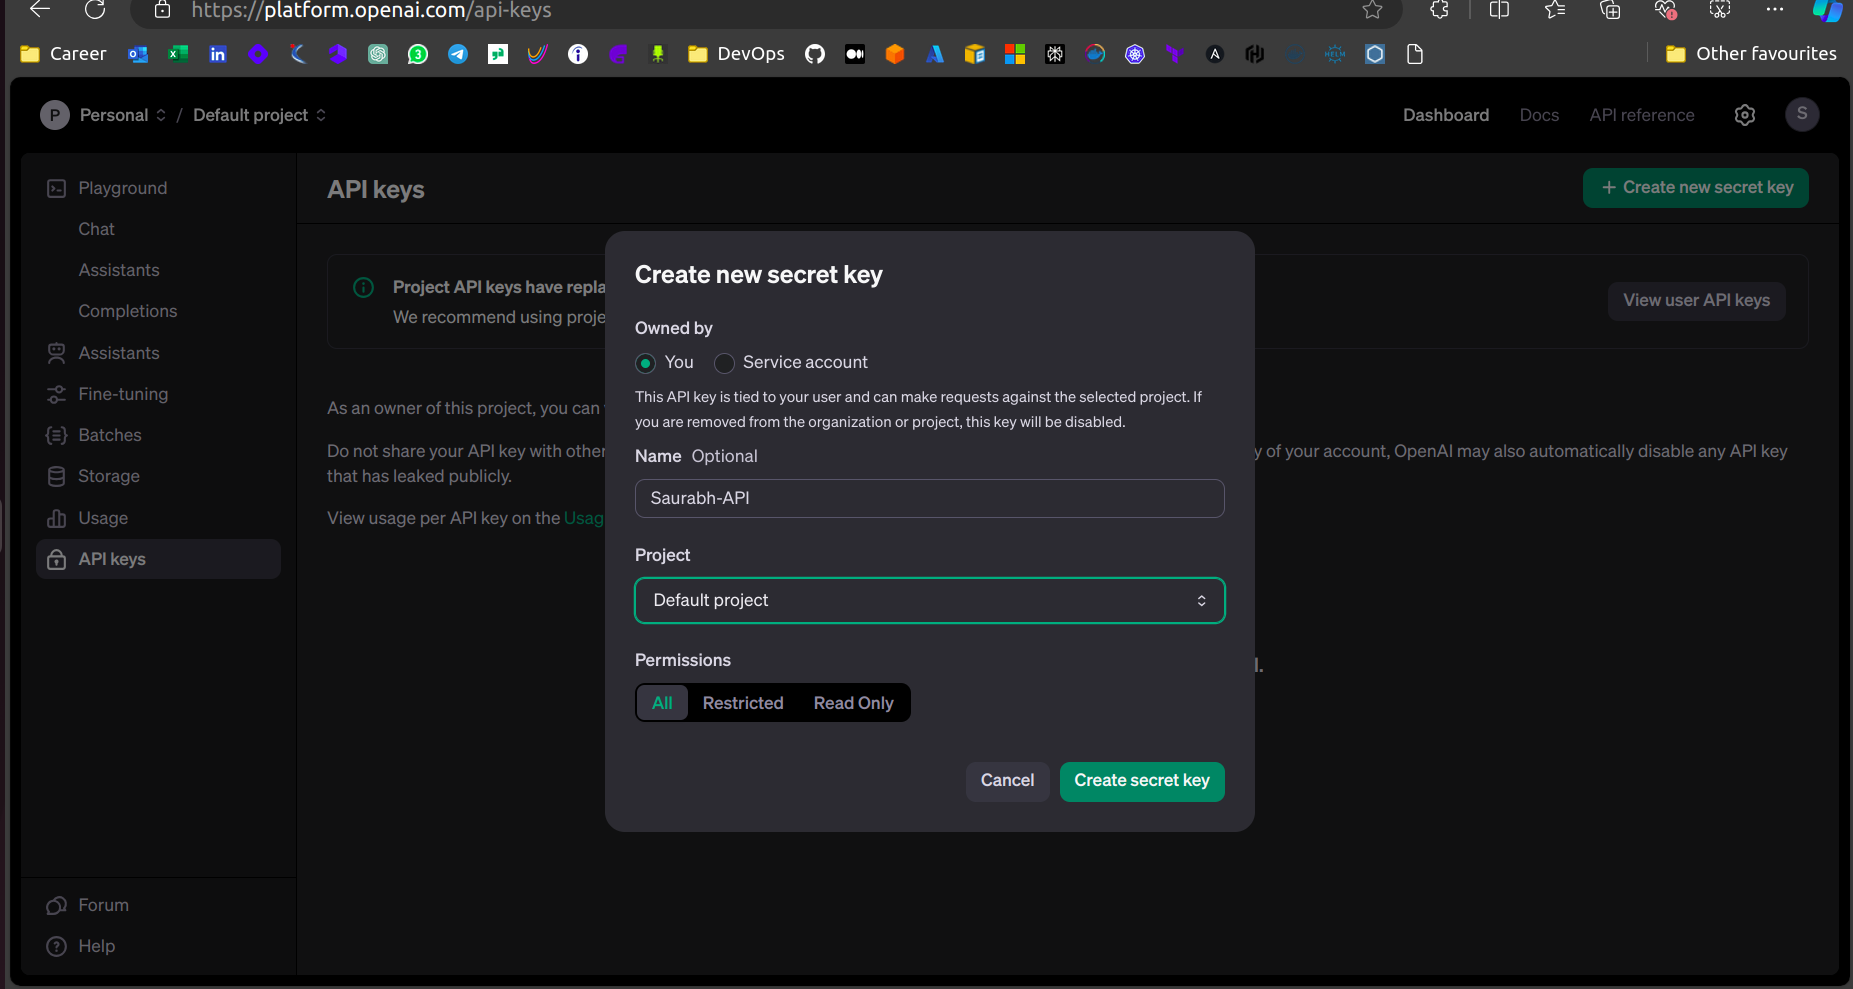
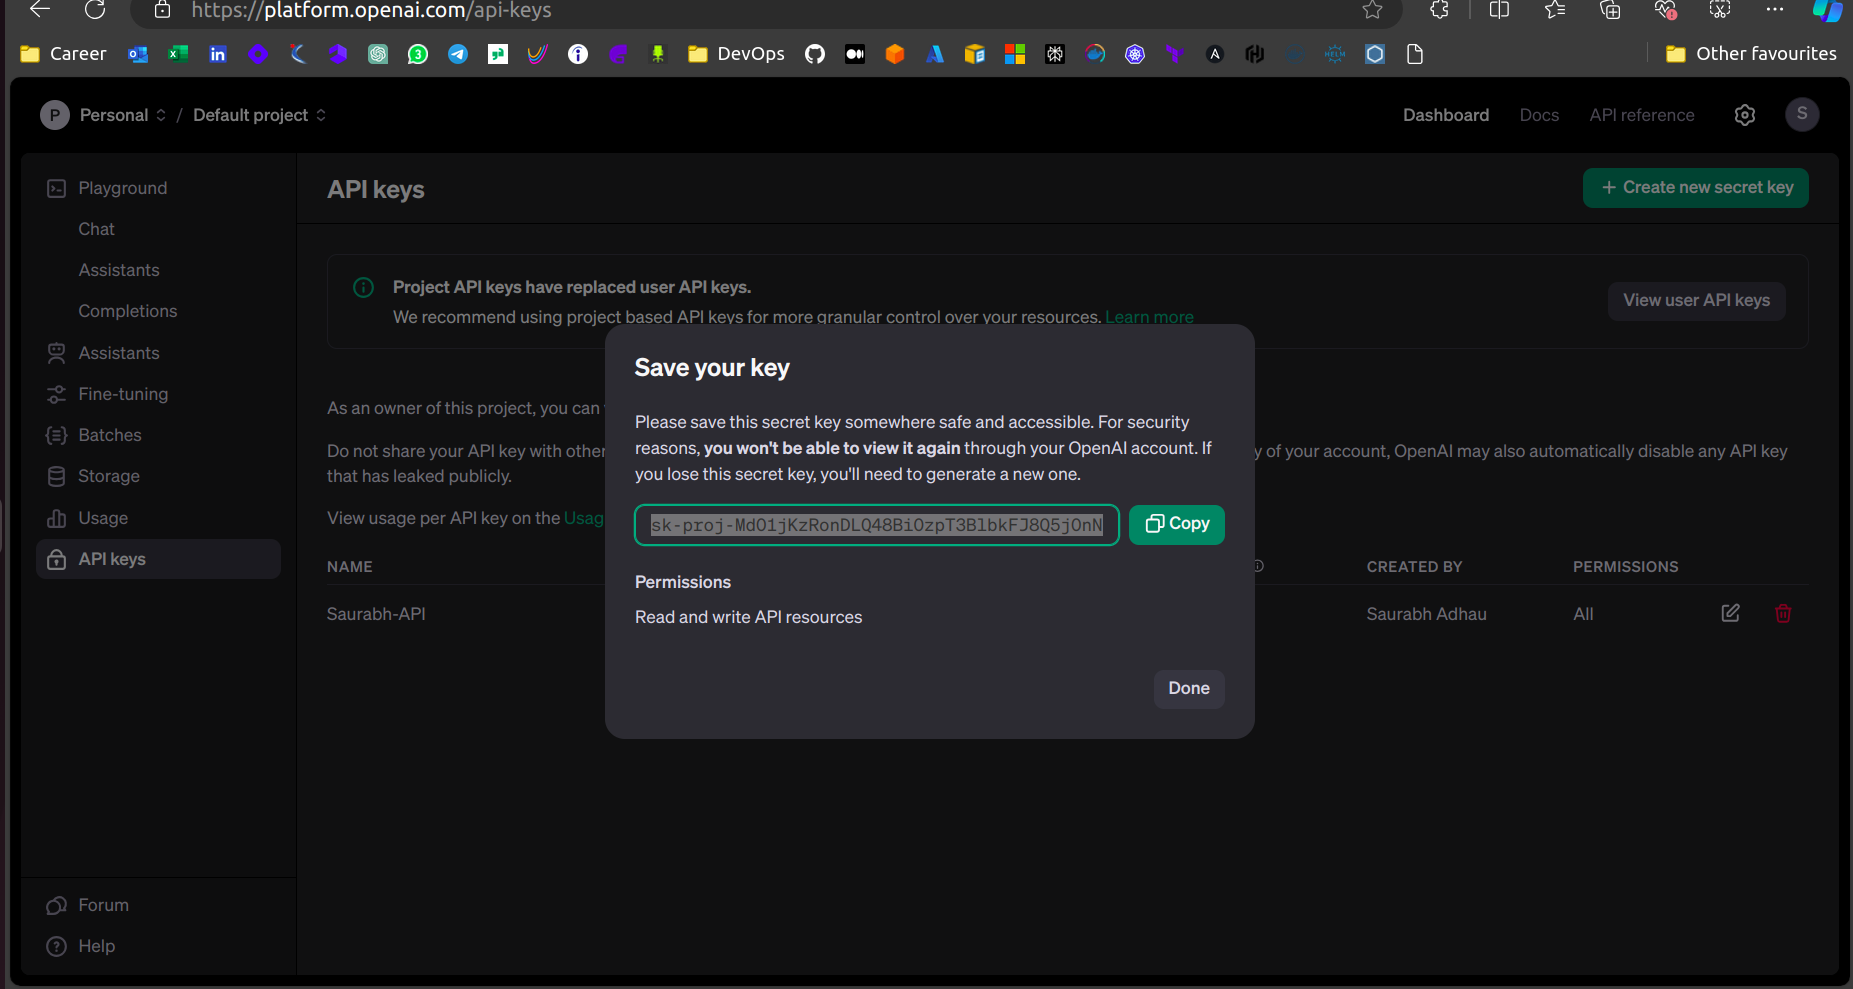
Go to https://platform.openai.com/api-keys → Create a new secret access key → Provide the name and click on create new secret key → Copy the secret access key.
- Come back to your application and click on the OpenAI API key present in the bottom left corner → Paste your API key.
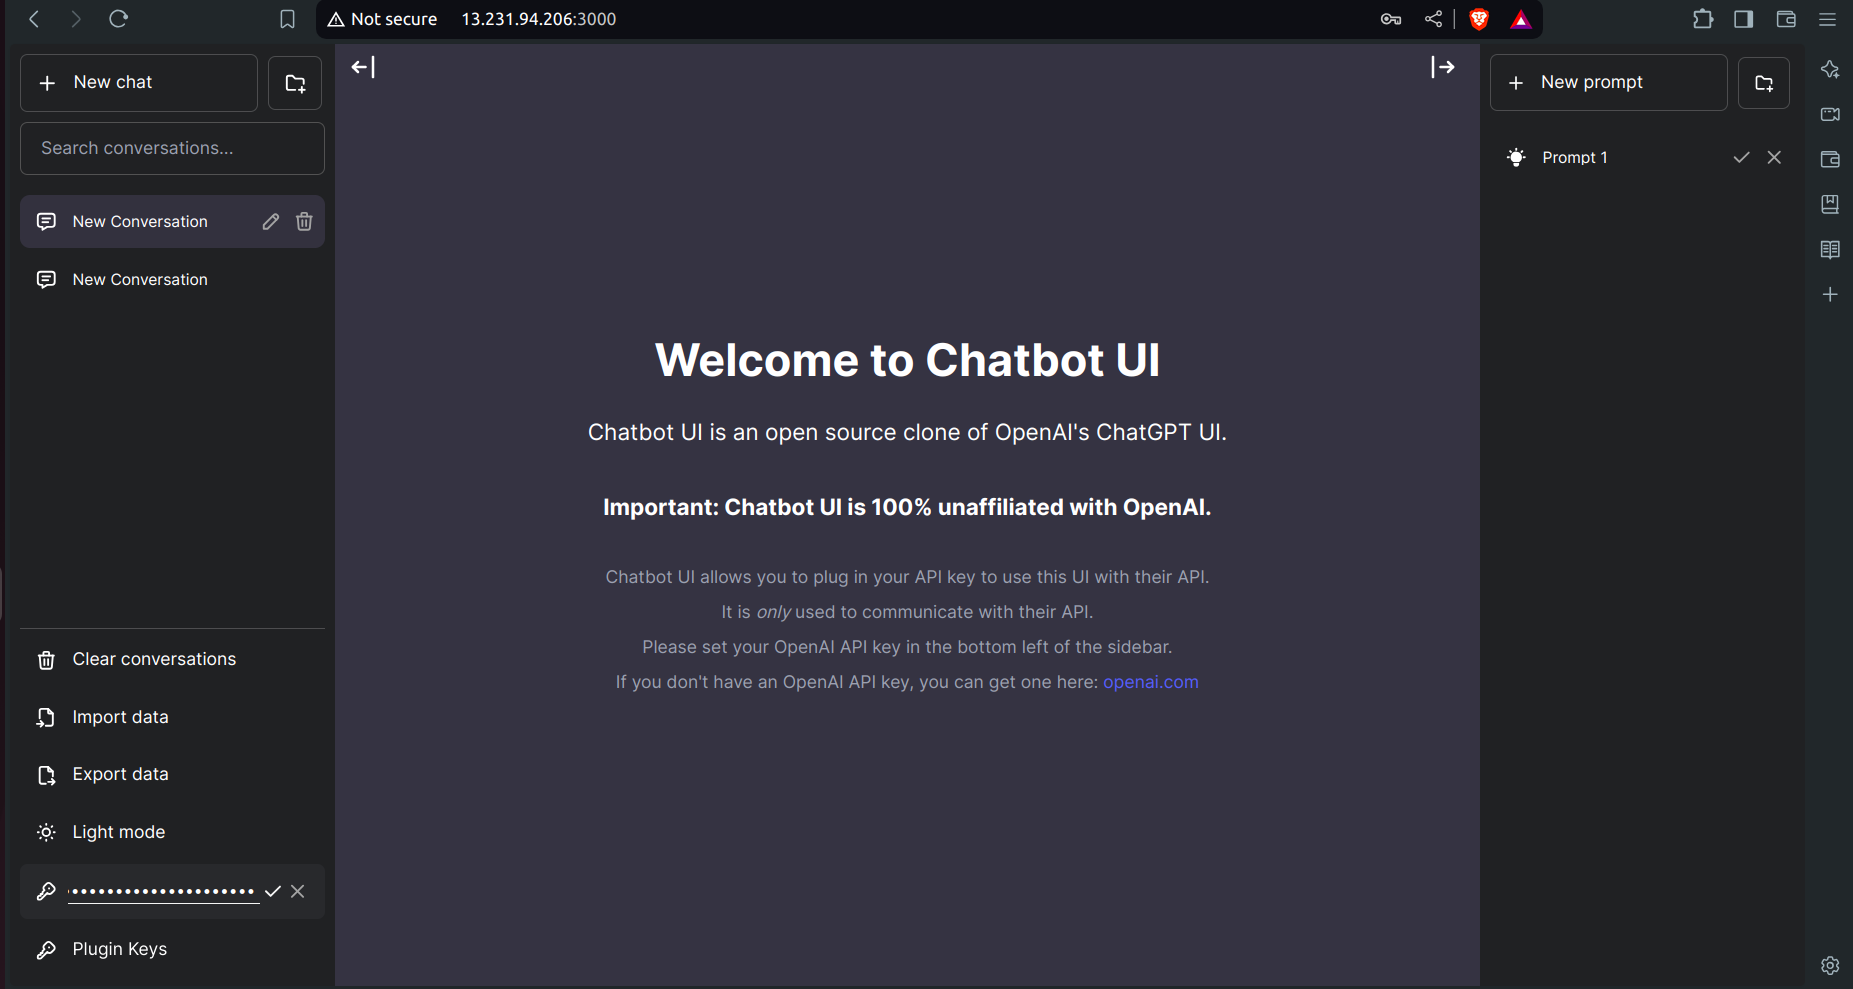
- Your application is now ready to use.
Step 7: Kubernetes Cluster Creation Using Terraform via Jenkins Pipeline
Create a New Pipeline:
Create a new pipeline named
eks-terraform.Scroll down and select "This project is parameterized".
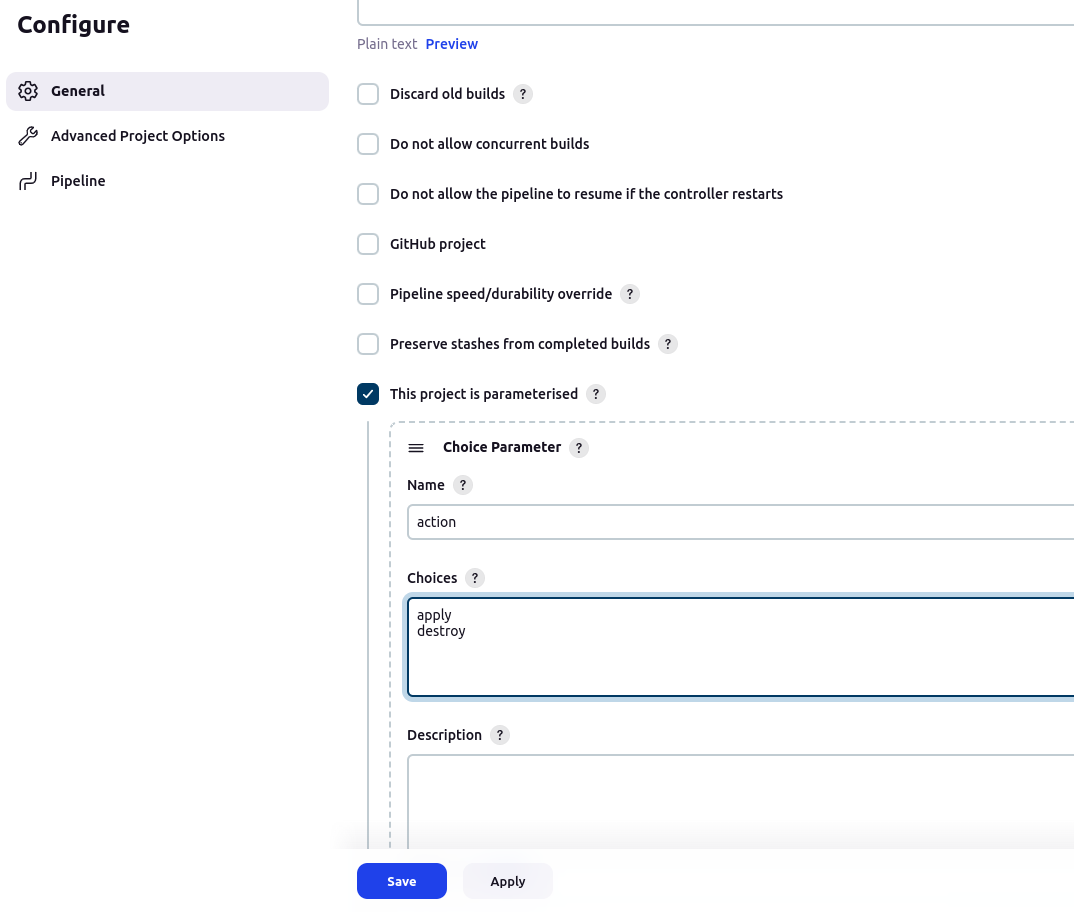
- Scroll down to the pipeline script and paste the below pipeline script.
pipeline{
    agent any
    stages {
        stage('Checkout from Git'){
            steps{
                git branch: 'main', url: 'https://github.com/Saurabh-DevOpsVoyager77/AI-Deployment.git'
            }
        }
        stage('Terraform init'){
             steps{
                 dir('Eks-terraform') {
                      sh 'terraform init'
                   }
             }
        }
        stage('Terraform validate'){
             steps{
                 dir('Eks-terraform') {
                      sh 'terraform validate'
                   }
             }
        }
        stage('Terraform plan'){
             steps{
                 dir('Eks-terraform') {
                      sh 'terraform plan'
                   }
             }
        }
        stage('Terraform apply/destroy'){
             steps{
                 dir('Eks-terraform') {
                      sh 'terraform ${action} --auto-approve'
                   }
             }
        }
    }
}
Click on Apply and then save.
Now click on the build with parameters option and then on apply.
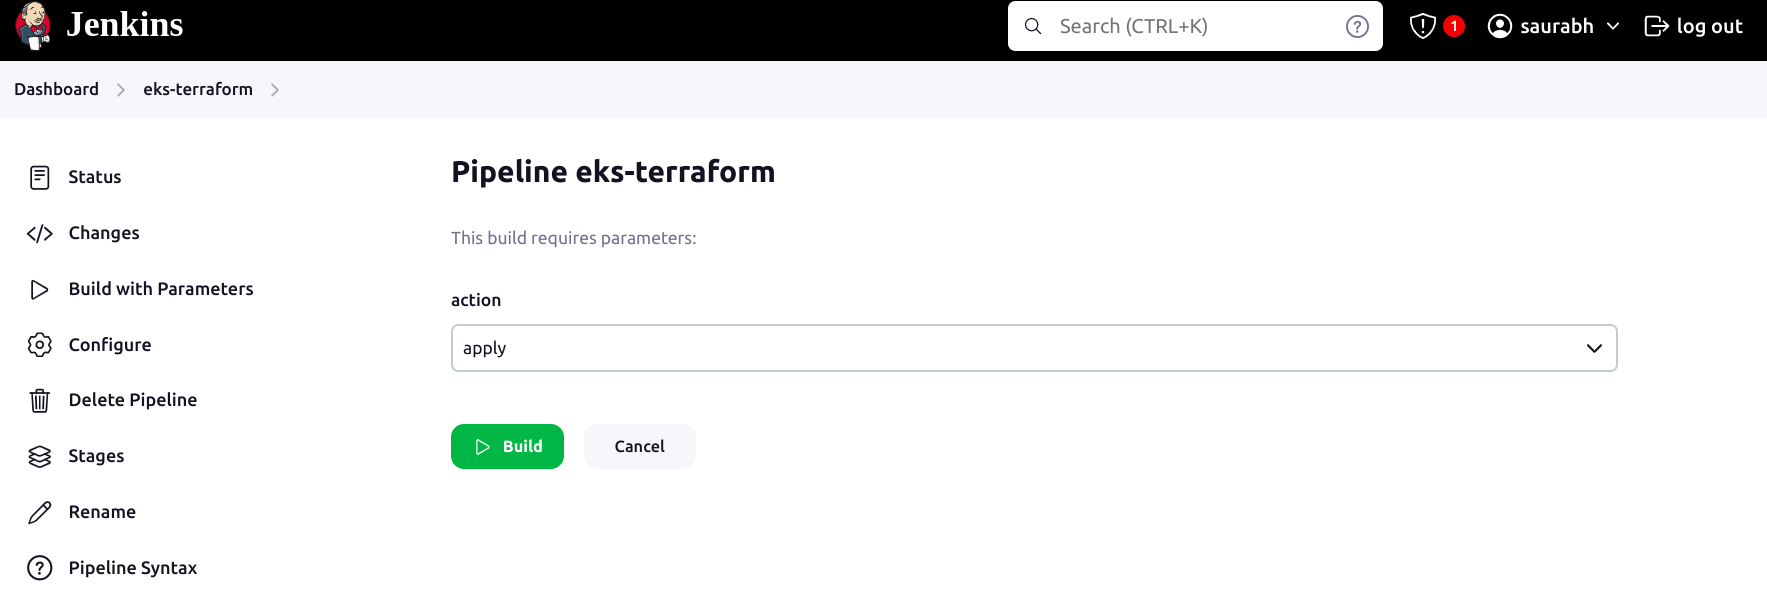
Wait for 10-15 mins, Cluster will be created.
Your pipeline is completed now go to your AWS console and search for EKS.
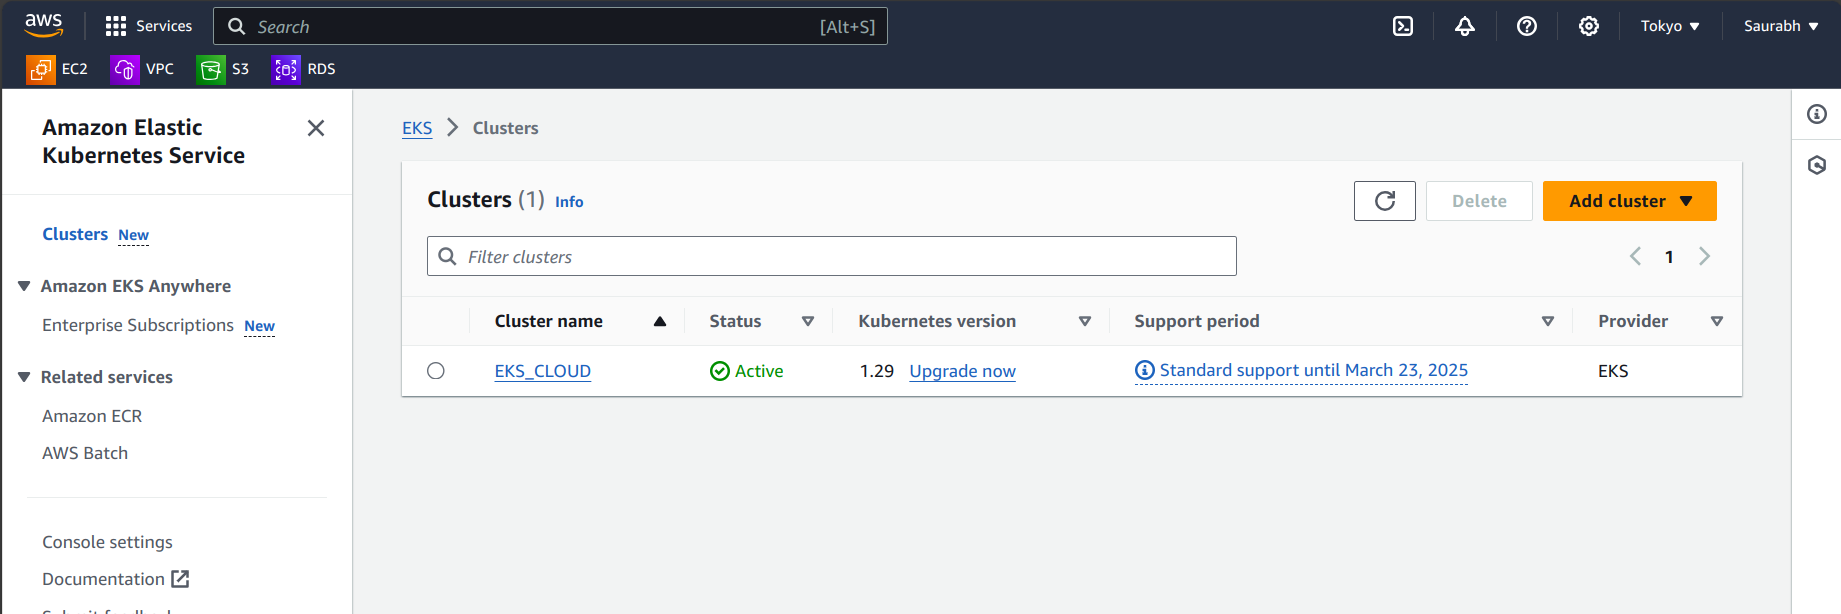
- Check for the node groups →Go to your EC2 instances.
Step 8: Deployment on Kubernetes
A. Back to yourAI-instance, run the following command:
aws eks update-kubeconfig --name <clustername> --region <region>
[Note: Replace <clustername> and <region> with your actual cluster name and region.]
B. Clone the Repository on Your EC2:
git clone https://github.com/Saurabh-DevOpsVoyager77/AI-Deployment.git
C. Navigate to the Kubernetes Folder:
cd /AI-Deployment/k8s
D. Deploy the Application to Kubernetes:
kubectl apply -f chatbot-ui.yaml
kubectl get all
E. Access the Application:
- Copy the load balancer external IP.

- Paste it into your browser.
F. Verify Deployment:
- You've now redeployed the application on Kubernetes.
Step 9: Monitoring via Prometheus and Grafana
Prometheus acts as a constant observer of your software, gathering performance data such as speed and user traffic. On the other hand, Grafana serves as a dashboard designer, transforming the data collected by Prometheus into visually appealing charts and graphs. This allows you to quickly assess the performance of your software and identify any issues.
In essence, Prometheus collects information while Grafana presents it in a comprehensible manner, enabling you to make informed decisions about your software. Together, they are commonly used for monitoring and managing applications and infrastructure.
A. Setup Server for Monitoring
Login into the 2nd server which we created earlier. Run the below script.
#!/bin/bash

# Create system user 'prometheus' if not exists
if ! id -u prometheus &>/dev/null; then
    sudo useradd --system --no-create-home --shell /bin/false prometheus
fi

# Download Prometheus release
wget https://github.com/prometheus/prometheus/releases/download/v2.47.1/prometheus-2.47.1.linux-amd64.tar.gz

# Extract Prometheus files
tar -xvf prometheus-2.47.1.linux-amd64.tar.gz
cd prometheus-2.47.1.linux-amd64/

# Move Prometheus binaries to /usr/local/bin/
sudo mv prometheus promtool /usr/local/bin/

# Move contents of consoles and console_libraries to /etc/prometheus/
sudo mkdir -p /etc/prometheus/consoles
sudo mkdir -p /etc/prometheus/console_libraries
sudo mv consoles/* /etc/prometheus/consoles/
sudo mv console_libraries/* /etc/prometheus/console_libraries/

# Move prometheus.yml to /etc/prometheus/
sudo mv prometheus.yml /etc/prometheus/prometheus.yml

# Change ownership of Prometheus directories
sudo chown -R prometheus:prometheus /etc/prometheus/

# Create /data directory if not exists
sudo mkdir -p /data

# Create Prometheus service file
sudo tee /etc/systemd/system/prometheus.service <<EOF
[Unit]
Description=Prometheus
Wants=network-online.target
After=network-online.target
StartLimitIntervalSec=500
StartLimitBurst=5

[Service]
User=prometheus
Group=prometheus
Type=simple
Restart=on-failure
RestartSec=5s
ExecStart=/usr/local/bin/prometheus \
  --config.file=/etc/prometheus/prometheus.yml \
  --storage.tsdb.path=/data \
  --web.console.templates=/etc/prometheus/consoles \
  --web.console.libraries=/etc/prometheus/console_libraries \
  --web.listen-address=0.0.0.0:9090 \
  --web.enable-lifecycle

[Install]
WantedBy=multi-user.target
EOF

# Enable and start Prometheus service
sudo systemctl enable prometheus
sudo systemctl start prometheus
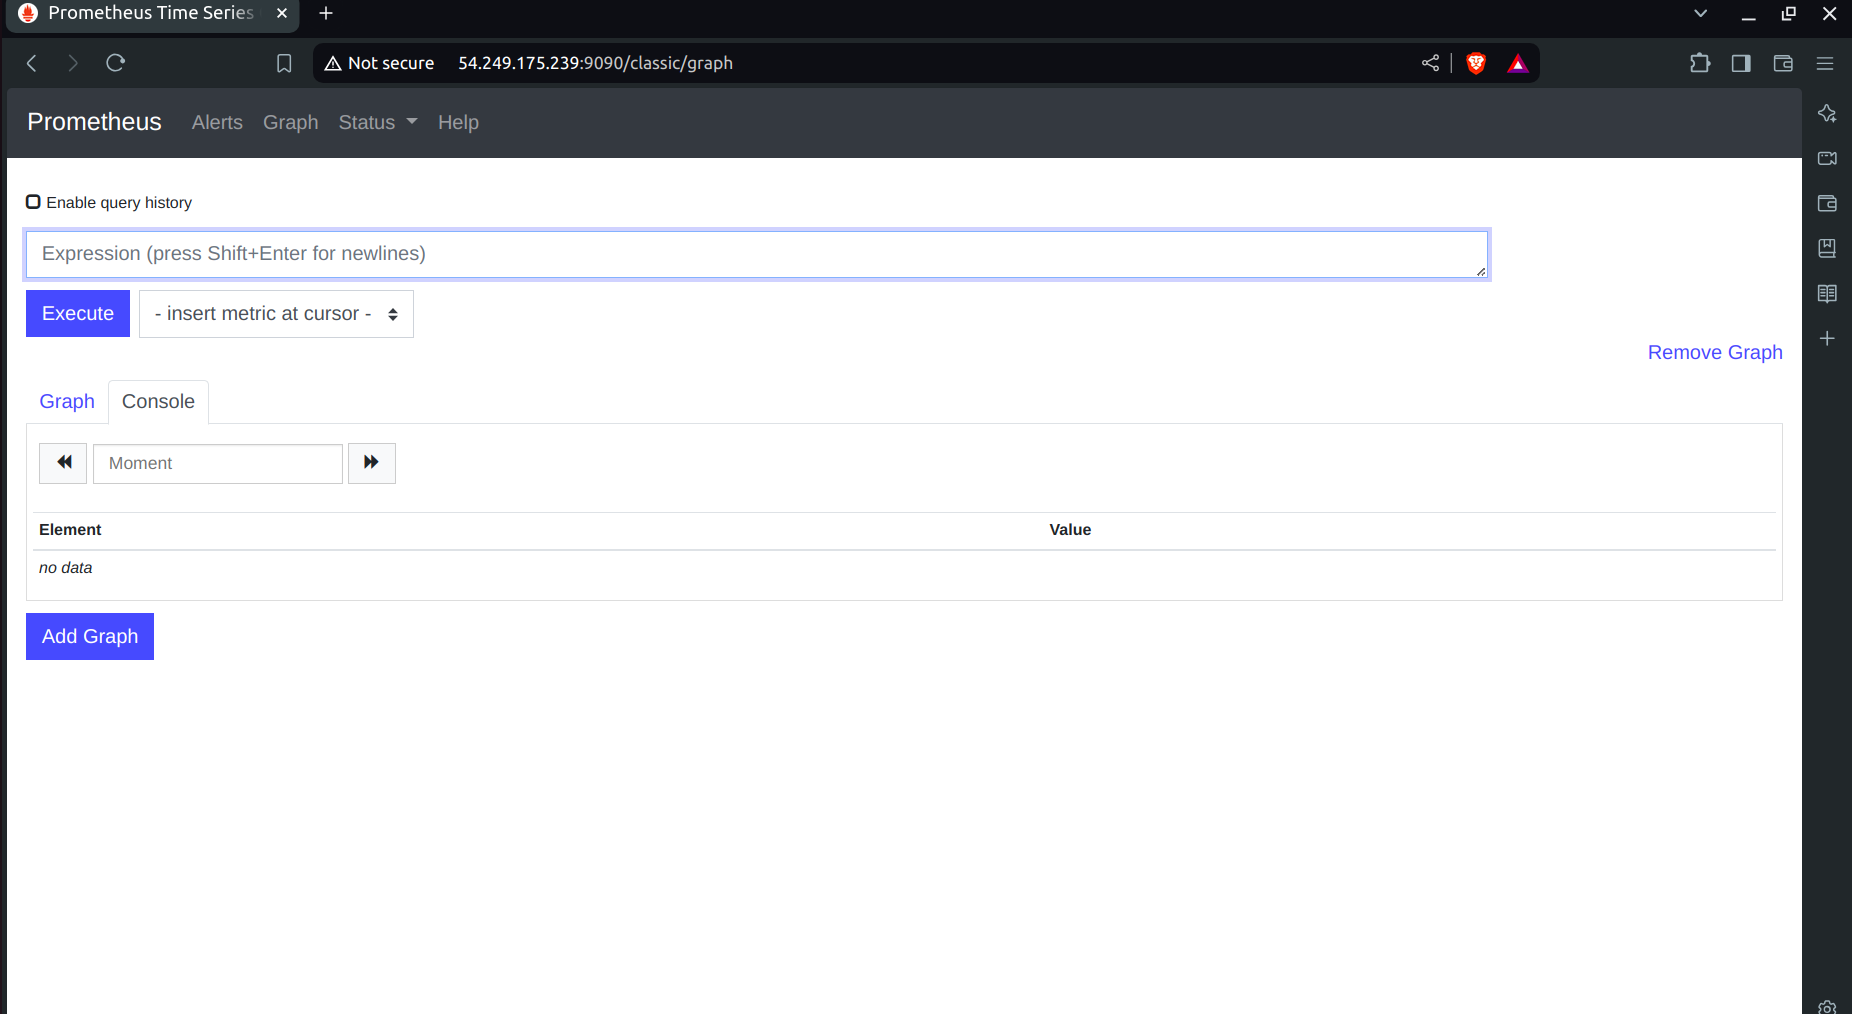
Now go to your security group of your ec2 to enable port 9090 in which Prometheus will run
Go to → http://public_ip:9090 to see the webpage of Prometheus
B. Installing Node Exporter
Node Exporter serves as a "reporter" tool for Prometheus, facilitating the collection and provision of information about a computer (node) for Prometheus monitoring. It gathers essential data like CPU usage, memory usage, disk space, and network activity on the computer.
A Node Port Exporter, a specific type of Node Exporter, focuses on collecting information about network ports on a computer. It informs Prometheus about the status of network ports, including data transfer activity. This data is invaluable for monitoring network-related activities and ensuring the smooth and secure operation of applications and services.
Run the following script to install Node Exporter:
#!/bin/bash

# Create system user 'node_exporter'
sudo useradd --system --no-create-home --shell /bin/false node_exporter

# Download Node Exporter release
wget https://github.com/prometheus/node_exporter/releases/download/v1.6.1/node_exporter-1.6.1.linux-amd64.tar.gz

# Extract Node Exporter files
tar -xvf node_exporter-1.6.1.linux-amd64.tar.gz

# Move Node Exporter binary to /usr/local/bin/
sudo mv node_exporter-1.6.1.linux-amd64/node_exporter /usr/local/bin/

# Clean up downloaded files
rm -rf node_exporter*

# Create Node Exporter service file
sudo tee /etc/systemd/system/node_exporter.service <<EOF
[Unit]
Description=Node Exporter
After=network.target

[Service]
User=node_exporter
Group=node_exporter
Type=simple
ExecStart=/usr/local/bin/node_exporter

[Install]
WantedBy=default.target
EOF

# Create user 'node_exporter'
sudo useradd -m -s /bin/bash node_exporter

# Change ownership of Node Exporter binary
sudo chown node_exporter:node_exporter /usr/local/bin/node_exporter

# Reload systemd manager configuration
sudo systemctl daemon-reload

# Start and enable Node Exporter service
sudo systemctl start node_exporter
sudo systemctl enable node_exporter

# Check Node Exporter service status
sudo systemctl status node_exporter
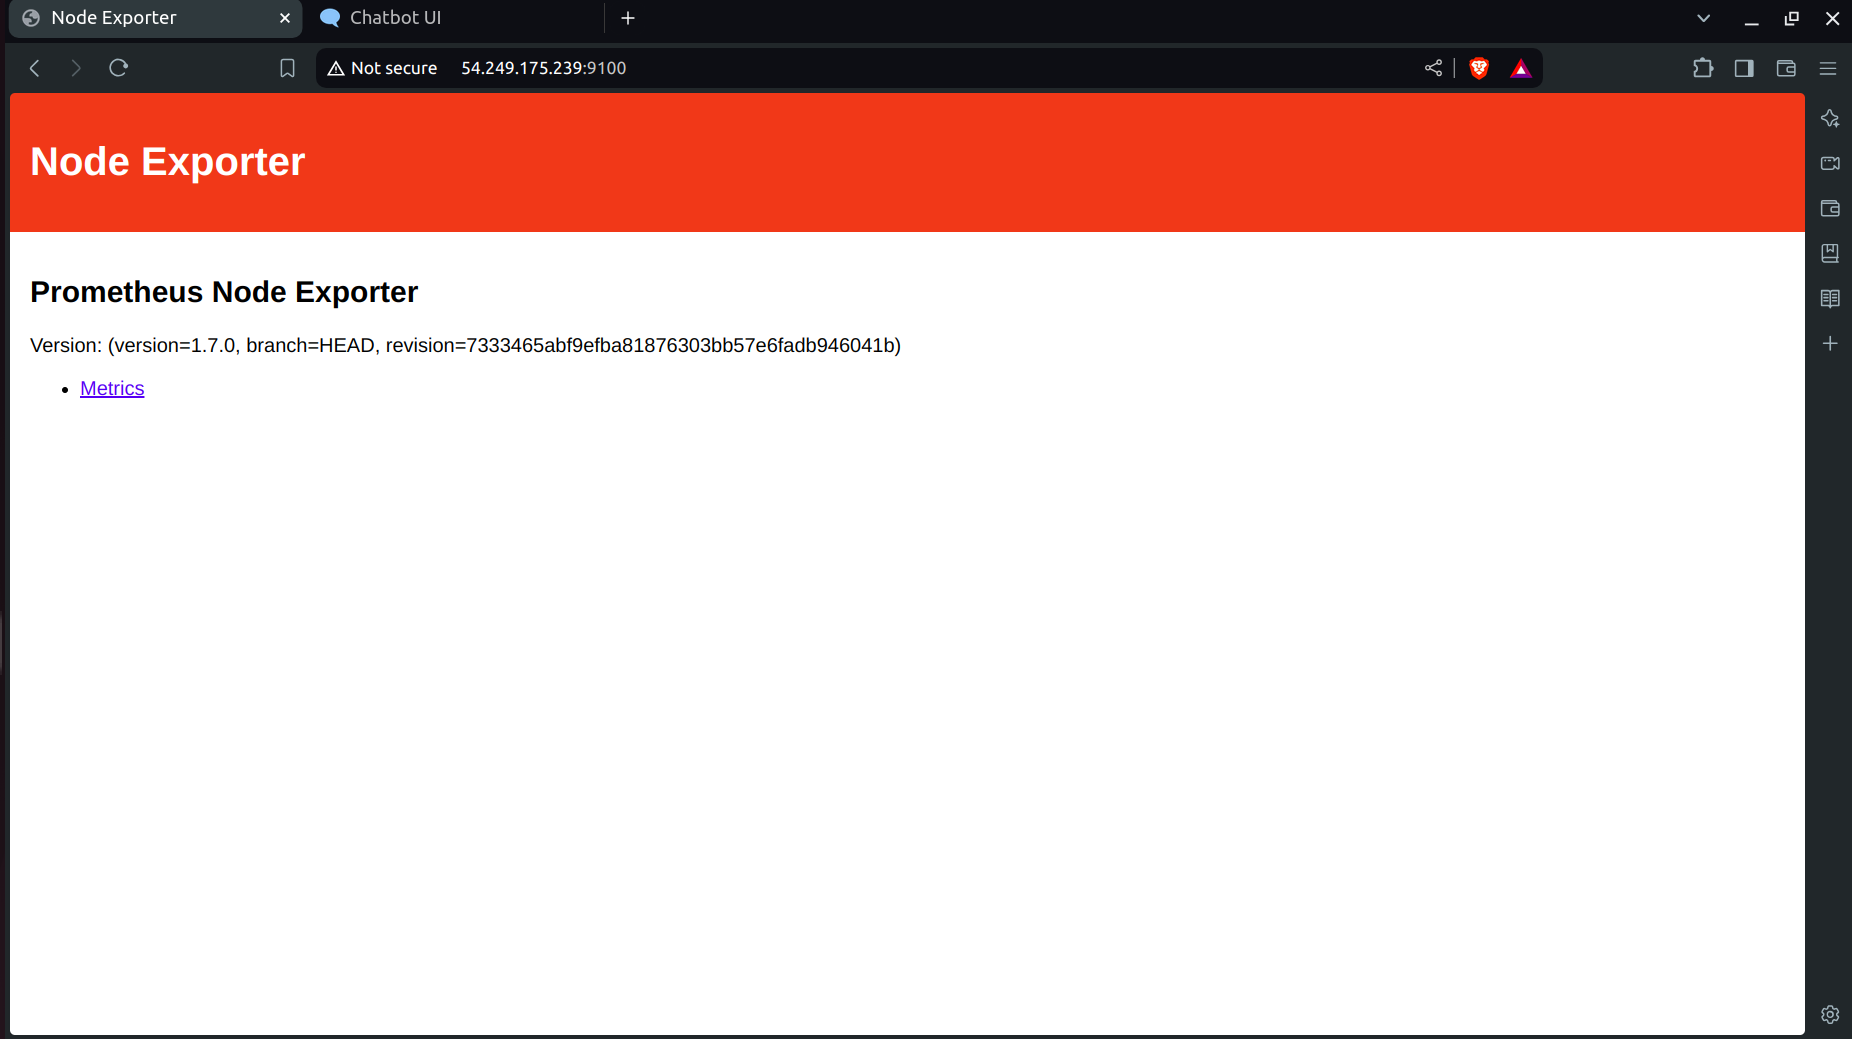
node exporter service is now running
You can access Node Exporter metrics in Prometheus on http://publicip:9100
C. Configure Prometheus Plugin Integration:
A. Go to your EC2 and run:
cd /etc/prometheus
B. you have to edit the prometheus.yml file to monitor anything.
scrape_configs:
  - job_name: 'node_exporter'
    static_configs:
      - targets: ['localhost:9100']
  - job_name: 'jenkins'
    metrics_path: '/prometheus'
    static_configs:
      - targets: ['<your-jenkins-ip>:<your-jenkins-port>']
Add the above code with proper indentation.
C. Check the validity of the configuration file
promtool check config /etc/prometheus/prometheus.yml
o/p

D. Reload the Prometheus configuration without restarting →
curl -X POST http://localhost:9090/-/reload
Go to your Prometheus tab again, click on status, and select targets you will there is three targets present as we enter in the yaml file for monitoring.

Prometheus targets dashboard
D . Setup Grafana
sudo apt-get update
sudo apt-get install -y apt-transport-https software-properties-common
wget -q -O —  https://packages.grafana.com/gpg.key | sudo apt-key add -
echo “deb https://packages.grafana.com/oss/deb stable main” | sudo tee — a /etc/apt/sources.list.d/grafana.list
sudo apt-get update
sudo apt-get -y install grafana
sudo systemctl enable grafana-server
sudo systemctl start grafana-server
sudo systemctl status grafana-server
Now go to your ec2 security group and open port no. 3000 in which Grafana runs
Go and browse http://public_ip:3000to access your Grafana web interface
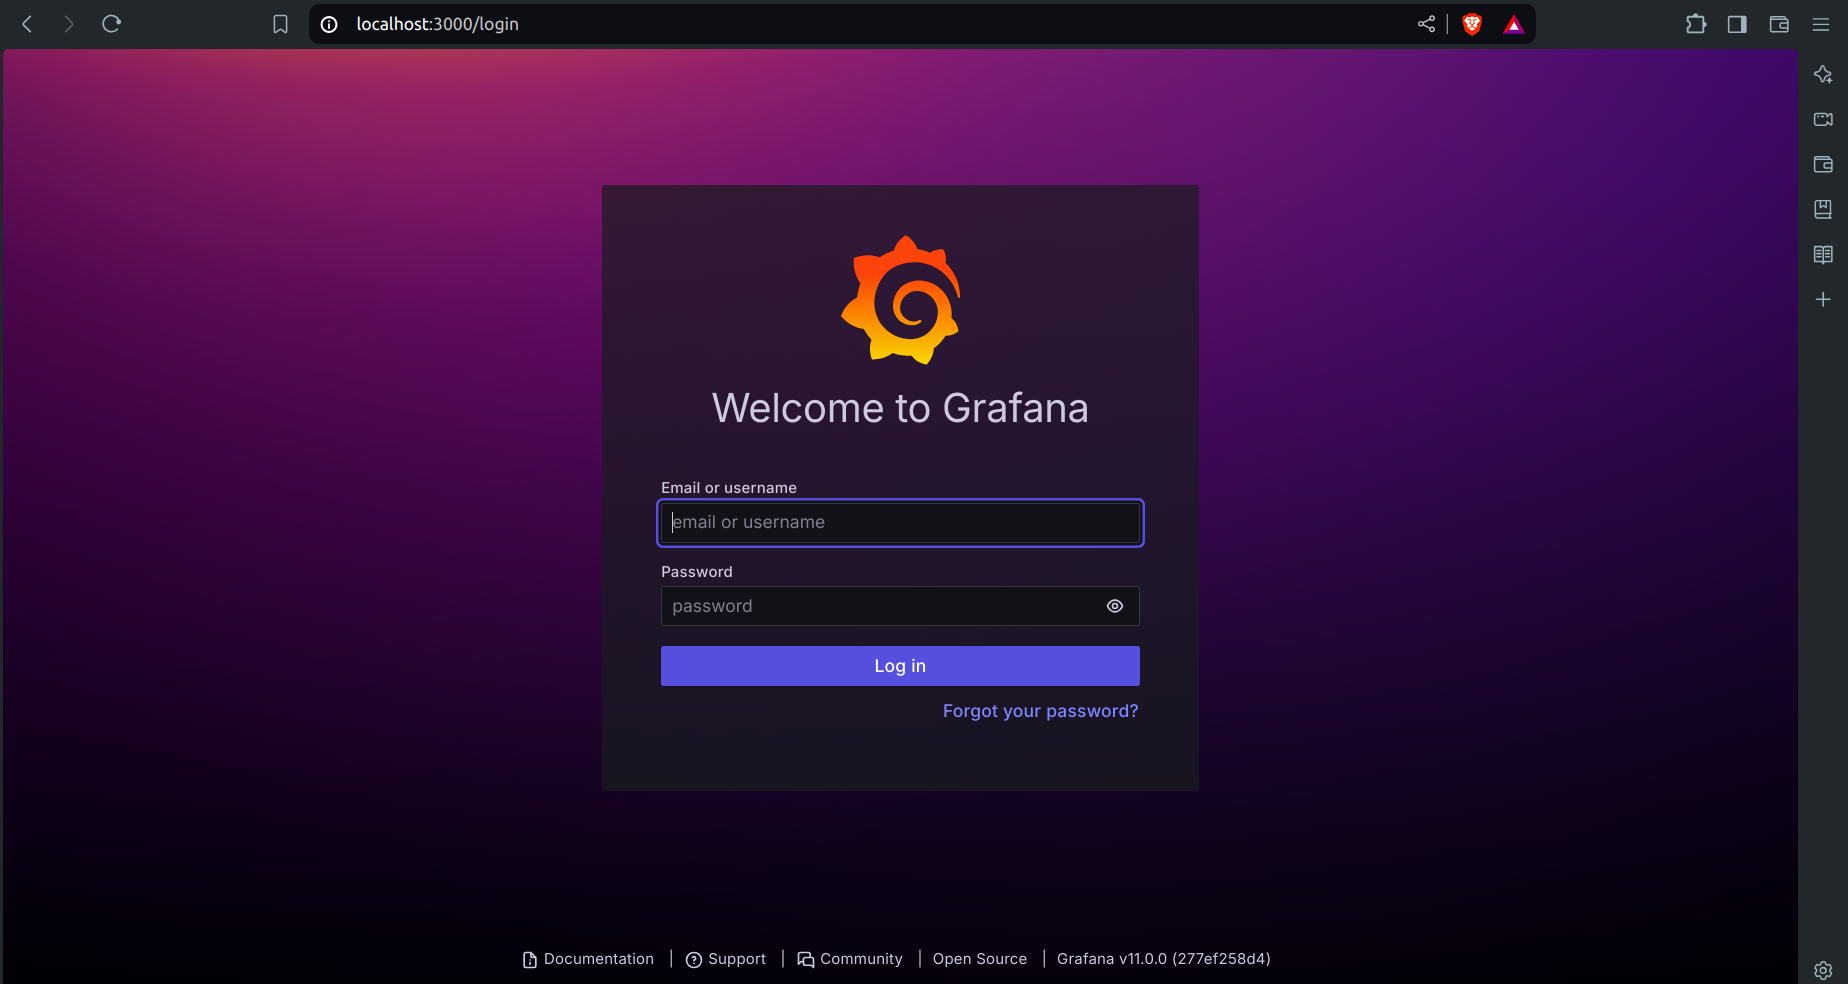
username = admin, password =admin
E . Add Prometheus Data Source
Visualizing Metrics with Grafana
To visualize the metrics collected by Prometheus, you need to add Prometheus as a data source in Grafana. Follow these steps:
Open Grafana:
- Navigate to your Grafana dashboard in your browser.
Add a Data Source:
Click on the gear icon (⚙️) in the left sidebar to open the “Configuration” menu.
Select “Data Sources.”
Click on the “Add data source” button.
Configure Prometheus as the Data Source:
Select "Prometheus" from the list of available data sources.
In the "HTTP" section, enter the URL where Prometheus is running (e.g.,
http://localhost:9090or your Prometheus server URL).Click on the "Save & Test" button to verify the connection.

F. Importing a Dashboard in Grafana
Importing a dashboard in Grafana is like using a ready-made template to quickly create a set of charts and graphs for monitoring your data, without having to build them from scratch.
Click on the “+” (plus) icon in the left sidebar to open the “Create” menu.
Select “Dashboard.”
Click on the “Import” dashboard option.
Enter the dashboard code you want to import (e.g., code
1860).Click the “Load” button.
Select the data source you added (Prometheus) from the dropdown.
Click on the “Import” button.
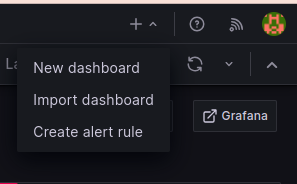
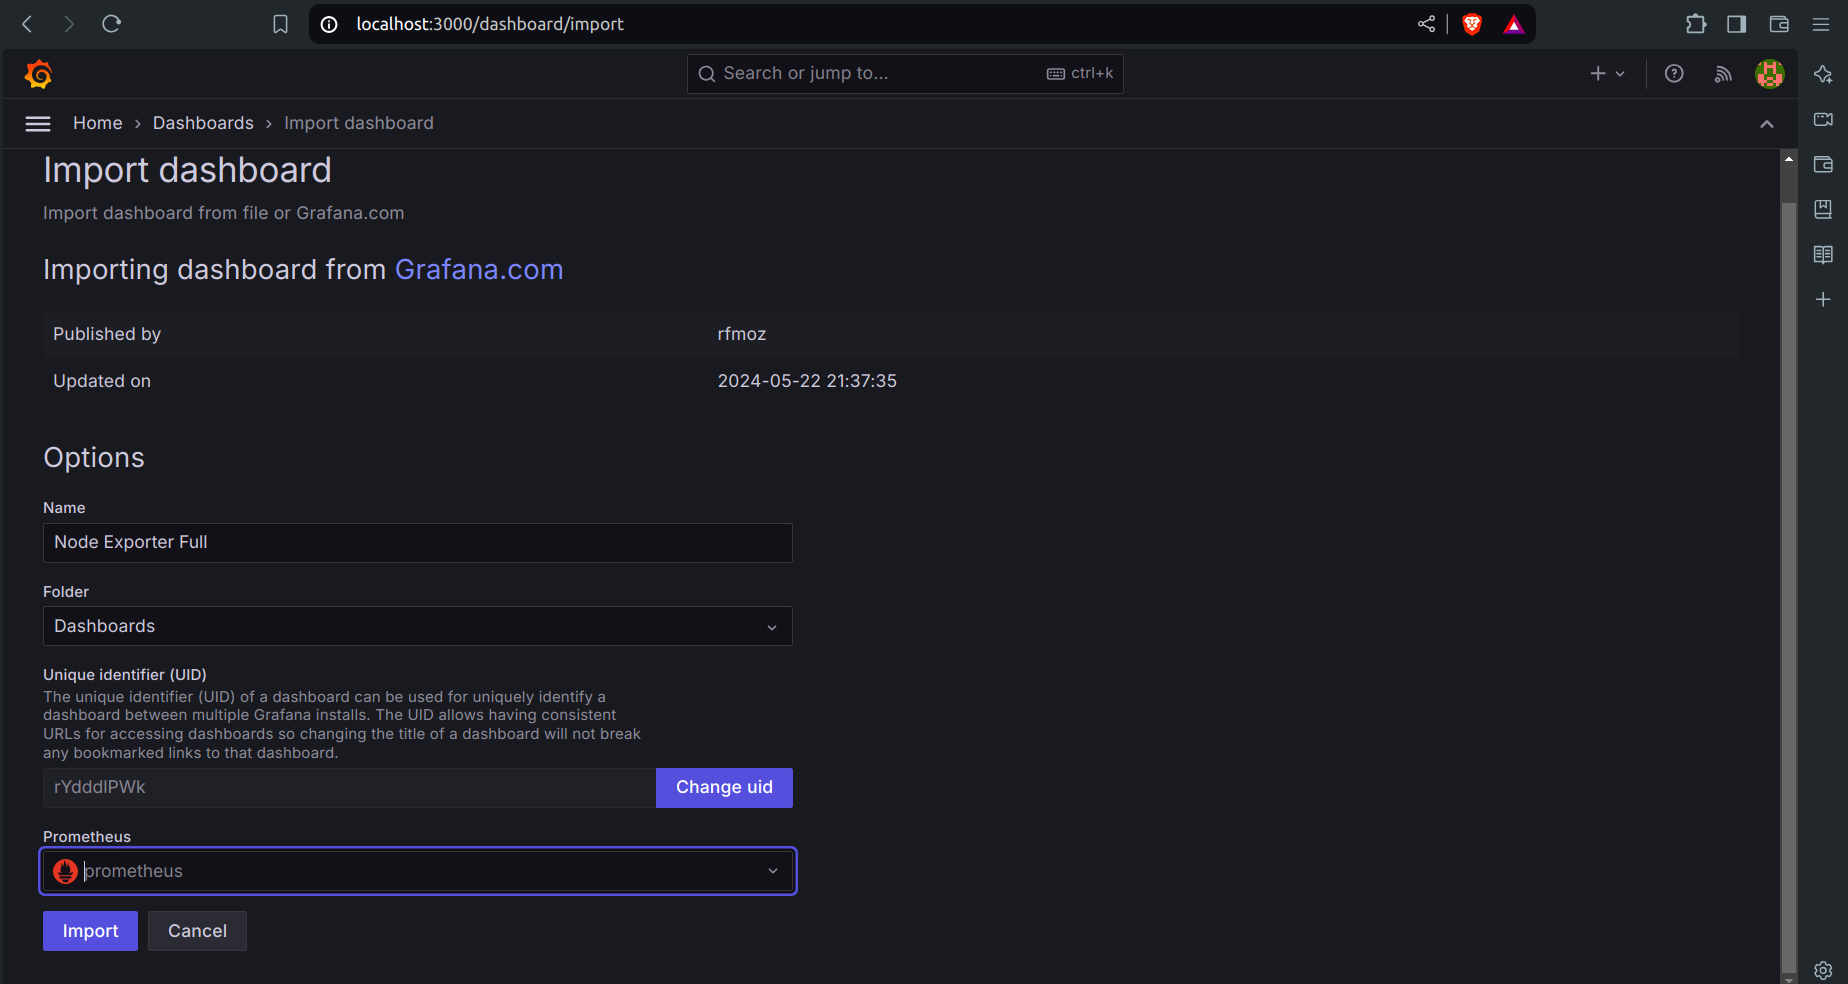
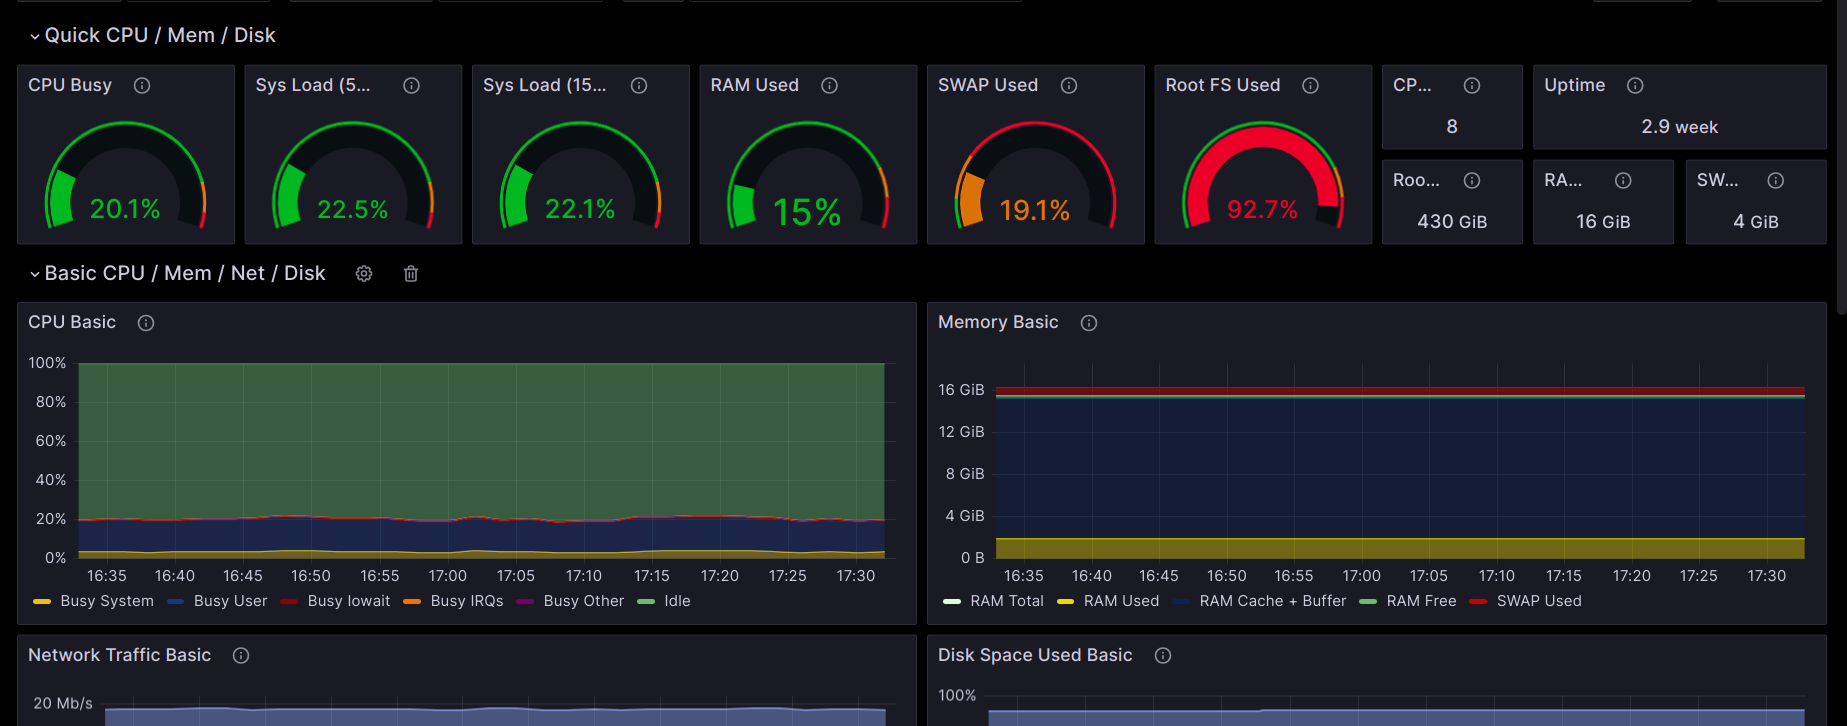
By following these steps, you'll be able to monitor and visualize your system's performance metrics effectively using Prometheus and Grafana.
G. Configure Global Settings for Prometheus
Go to Manage Jenkins → System.
Search for Prometheus.
Click Apply and then Save.
H. Import a Dashboard for Jenkins
Click on the “+” (plus) icon in the left sidebar to open the “Create” menu.
Select “Dashboard.”
Click on the “Import” dashboard option.
Enter the dashboard code you want to import (e.g., code 9964).
Click the “Load” button.
Select the data source you added (Prometheus) from the dropdown.
By following these steps, you'll be able to monitor and visualize your Jenkins performance metrics effectively using Prometheus and Grafana.
Step 10: Destroy All the Infrastructure
Delete Kubernetes Deployment and Service:
kubectl delete deployment chatbotDestroy EKS Cluster and Node Group via Jenkins:
Go to Jenkins and locate the
eks-terraformpipeline.Click on Build with Parameters, select the destroy option, and then click on Build.
This process will destroy your EKS cluster and node group, taking approximately 10 minutes.
Delete Base Instances:
After the EKS cluster is deleted, delete the base instance (
AI-instanceandmonitoring instance).Go to your terminal, locate the folder containing the Instance-Terraform configuration, and run:
terraform destroy --auto-approve
Subscribe to my newsletter
Read articles from Saurabh Adhau directly inside your inbox. Subscribe to the newsletter, and don't miss out.
Written by

Saurabh Adhau
Saurabh Adhau
As a DevOps Engineer, I thrive in the cloud and command a vast arsenal of tools and technologies: ☁️ AWS and Azure Cloud: Where the sky is the limit, I ensure applications soar. 🔨 DevOps Toolbelt: Git, GitHub, GitLab – I master them all for smooth development workflows. 🧱 Infrastructure as Code: Terraform and Ansible sculpt infrastructure like a masterpiece. 🐳 Containerization: With Docker, I package applications for effortless deployment. 🚀 Orchestration: Kubernetes conducts my application symphonies. 🌐 Web Servers: Nginx and Apache, my trusted gatekeepers of the web.