Processing and Visualizing Historical Disaster Events with HDFS, Apache Hive, and Hue
 Temiloluwa Oloye
Introduction
One of the important skills of a Data Scientist is the ability to uncover insights from a large amount of data. In this guide, we will walk through the process of processing and visualizing historical disaster events using HDFS, Apache Hive, and Hue. By following these steps, you will learn how to manage large datasets and derive meaningful insights from them using big data tools.
Prerequisites
Before we begin, ensure you have the following installed and configured:
Hadoop Distributed File System (HDFS)
Apache Hive
Hue (Hadoop User Experience)
Data Ingestion
First, we need to ingest the disaster events dataset into HDFS. This dataset contains historical disaster data from various sources and was obtained from Kaggle. You can find the link to the data in the reference section.
Create a directory in HDFS to store the dataset:
hdfs dfs -mkdir -p /user/disasterUpload the dataset from your local system to HDFS:
hdfs dfs -put /local/directory/disaster-events.csv /user/disaster💡Replace '/local/directory/disaster-events.csv' with the local path of the datasetVerify the data has been uploaded by viewing the first 10 rows:
hdfs dfs -cat /user/disaster/disaster-events.csv | head -n 10
The result is as follows:

Creating Hive Database and Tables
Next, we will create a database and multiple Hive tables to store and query the disaster data. We will select data from one table and insert it into another. Launch the Hive environment by using either the Hive or Beeline command. Create a new database named disaster and choose the database:
create database disaster;
use disaster;
Create a table named events to store the raw disaster events data:
create table events (
    Entity string,
    Year string,
    Disasters int
) row format delimited fields terminated by ',' stored as textfile;
Create another table named events_preprocessed to store the preprocessed. This table has the same schema as the events table, so we can use the 'like' command to replicate the schema:
create table events_preprocessed like events;
Create another table named entity_count to store the count of the total number of disasters for each entity:
create table entity_count (Entity string, total_count int)
row format delimited fields terminated by ',' stored as textfile;
Lastly, create a table named entity_year_range. We will convert the year field in our raw data to a year range of ten years and store the result in this table. This would enable us to analyze the data using a decade interval.
create table entity_year_range (entity string, year_range string, total_count int)
row format delimited fields terminated by ',' stored as textfile;
After creating these tables, we can begin loading our data. From the observation of our data in the step above, we can see that the first row represents the column or field names of our data. We do not want to load this row into our table. Before loading the data we have to alter the "skip.header.line.count" table property to skip the first row of the data:
alter table events set tblproperties("skip.header.line.count"="1");
Next, we load the data into the events table:
load data inpath '/user/disaster/disaster-events.csv' overwrite into table events;
Verify the data has been loaded by querying the first 10 rows:
select * from events limit 10;
Data Processing with Hive
We will preprocess the data to filter out certain events. The 'All disasters', 'All disasters excluding earthquakes' and 'All disasters excluding extreme temperature' are aggregate entries that we do not need. Insert the filtered data into the events_preprocessed table:
insert overwrite table events_preprocessed
select * from events
where entity != 'All disasters'
and entity != 'All disasters excluding earthquakes'
and entity != 'All disasters excluding extreme temperature';
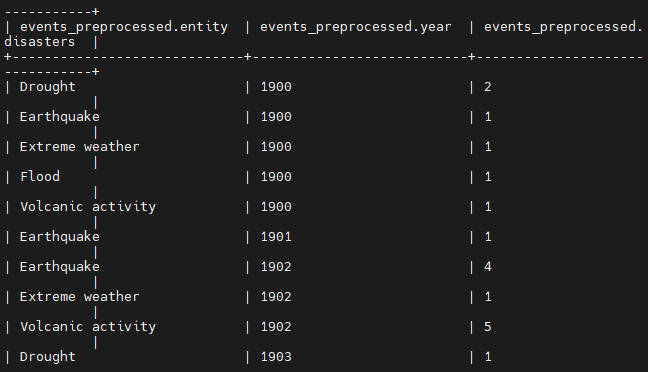
Verify the preprocessed data by querying the first 10 rows:
select * from events_preprocessed limit 10;
Advanced Data Analysis
We will perform aggregation and filtering to derive insights to answer specific questions.
We query the sum of the count of each entity in the events_preprocessed table and insert the result into the entity_count table.
insert overwrite table entity_count
select entity, sum(disasters) from events_preprocessed group by entity;
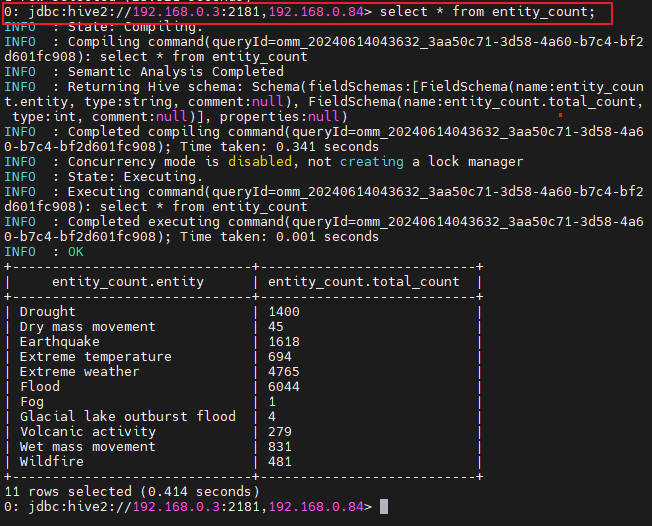
Verify the entity count data:
select * from entity_count;
The result should be as follows:
Insert data into the entity_year_range table. We use the case when statement to group the different years into a range of 10 years. The cast() function allows us to convert the string field into integer.
insert overwrite table entity_year_range
select entity,
case
    when cast(year as int) >= 1900 and cast(year as int) < 1910 then '1900s'
    when cast(year as int) >= 1910 and cast(year as int) < 1920 then '1910s'
    when cast(year as int) >= 1920 and cast(year as int) < 1930 then '1920s'
    when cast(year as int) >= 1930 and cast(year as int) < 1940 then '1930s'
    when cast(year as int) >= 1940 and cast(year as int) < 1950 then '1940s'
    when cast(year as int) >= 1950 and cast(year as int) < 1960 then '1950s'
    when cast(year as int) >= 1960 and cast(year as int) < 1970 then '1960s'
    when cast(year as int) >= 1970 and cast(year as int) < 1980 then '1970s'
    when cast(year as int) >= 1980 and cast(year as int) < 1990 then '1980s'
    when cast(year as int) >= 1990 and cast(year as int) < 2000 then '1990s'
    when cast(year as int) >= 2000 and cast(year as int) < 2010 then '2000s'
    when cast(year as int) >= 2010 and cast(year as int) < 2020 then '2010s'
    when cast(year as int) >= 2020 then '2020s'
end as year_range,
sum(disasters)
from events_preprocessed
group by entity, year_range;
Verify the year range data:
select * from entity_year_range limit 10;
Data Visualization with Hue
Finally, we will visualize the processed data using Hue.
Open Hue and navigate to the Hive editor. Ensure you have the disaster database selected.
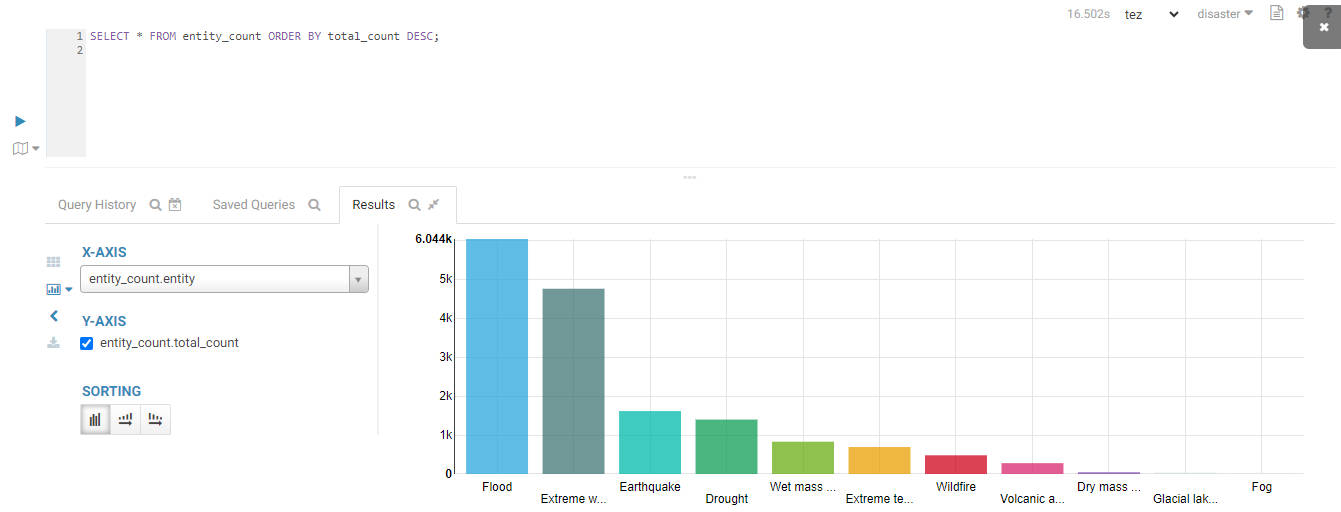
Visualize the total number of disasters by entity:
SELECT * FROM entity_count ORDER BY total_count DESC;
The top three entities are: Flood, Extreme Weather and Earthquake
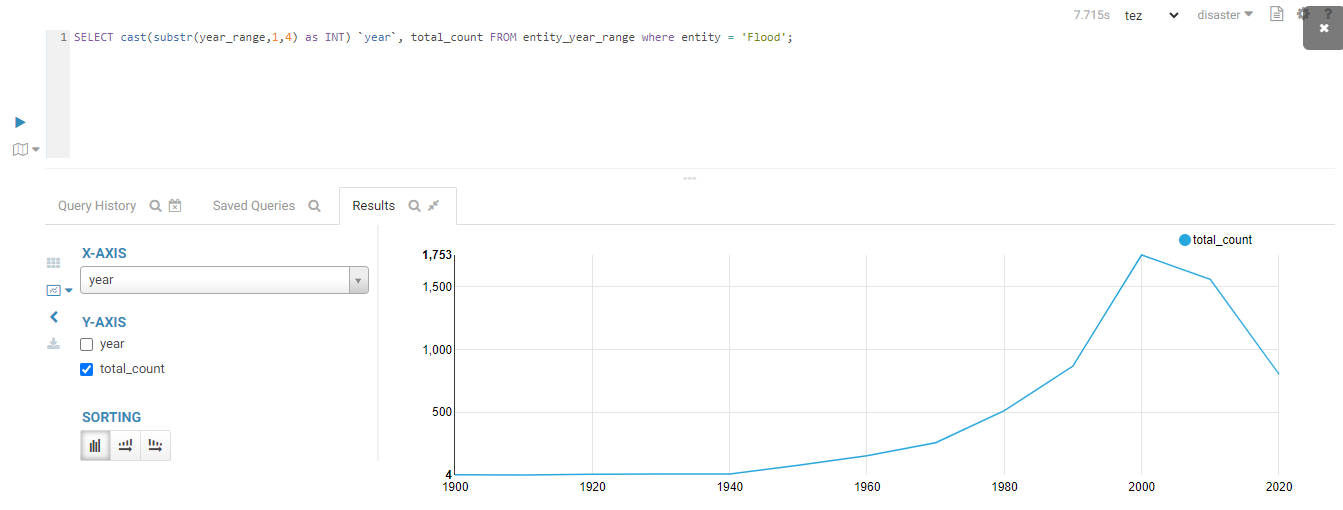
Visualize the trend of flood disasters over time:
SELECT cast(substr(year_range,1,4) as INT) `year`, total_count
FROM entity_year_range
WHERE entity = 'Flood';
The result is shown below:
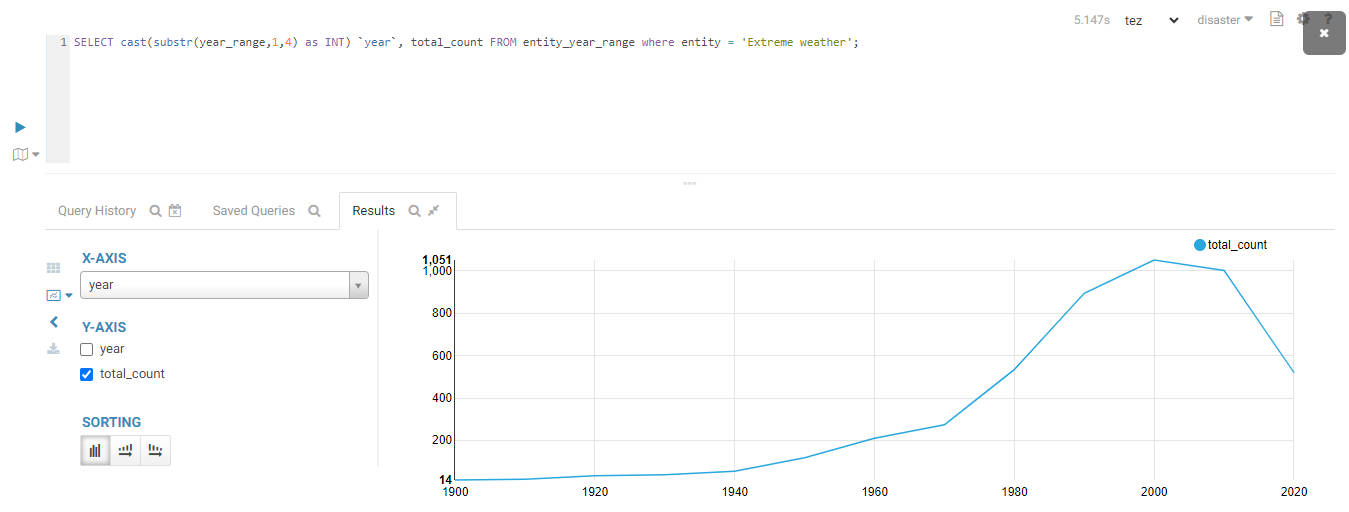
Visualize the trend of extreme weather disasters over time:
SELECT cast(substr(year_range,1,4) as INT) `year`, total_count
FROM entity_year_range
WHERE entity = 'Extreme weather';
The result is shown below:
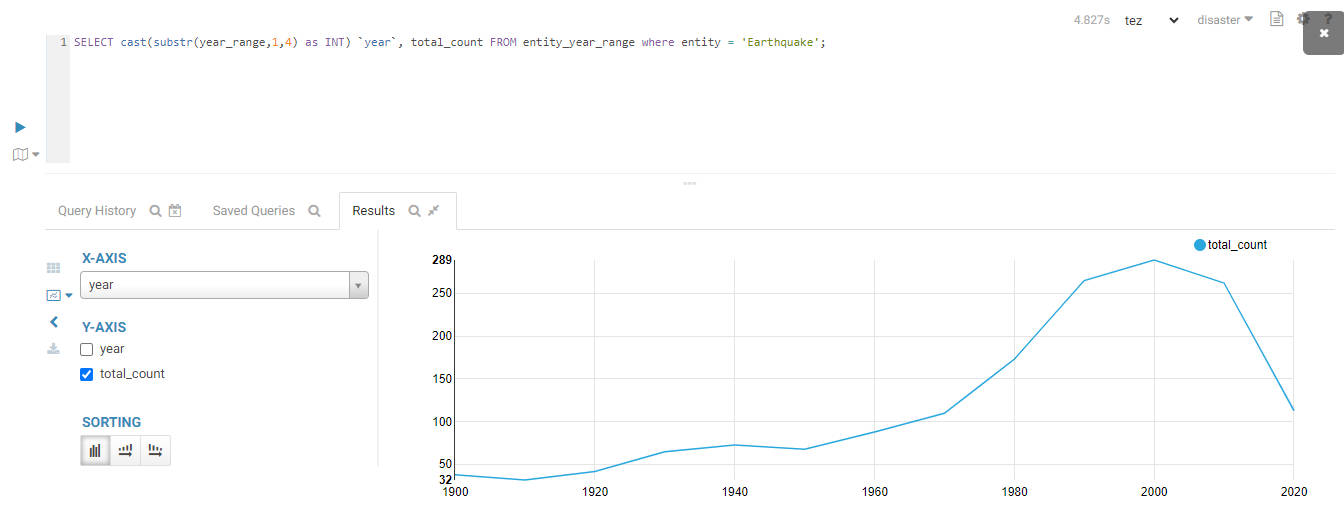
Visualize the trend of earthquake disasters over time:
SELECT cast(substr(year_range,1,4) as INT) `year`, total_count
FROM entity_year_range
WHERE entity = 'Earthquake';
The result is shown below:
Insights and Conclusions
By processing and visualizing the historical disaster data, we gain valuable insights into the frequency and distribution of various disasters over time. Floods and extreme weather events have shown a significant increase in recent decades, highlighting the impact of climate change. Earthquakes, while less frequent, have remained a consistent threat. These insights can inform disaster preparedness and mitigation strategies.
References and Resources
Kaggle Disaster Events Dataset. Available at: Kaggle
Subscribe to my newsletter
Read articles from Temiloluwa Oloye directly inside your inbox. Subscribe to the newsletter, and don't miss out.
Written by

Temiloluwa Oloye
Temiloluwa Oloye
I am a Big Data and Machine Learning Engineer with a background in Electrical and Electronic Engineering. I am skilled in Python Programming, SQL, and Hadoop Technologies