In Excel, Find the Maximum Value and the Neighboring N Members Before and After
 esProc
Problem description & analysis:
The column below contains numeric values only:
| A | |
| 1 | 13 |
| 2 | 21 |
| 3 | 46 |
| 4 | 21 |
| 5 | 49 |
| 6 | 9 |
| 7 | 34 |
| 8 | 23 |
| 9 | 6 |
| 10 | 1 |
| 11 | 37 |
| 12 | 49 |
| 13 | 42 |
| 14 | 40 |
| 15 | 15 |
| 16 | 31 |
| 17 | 17 |
| 18 | 1147 |
| 19 | 18 |
| 20 | 30 |
| 21 | 22 |
| 22 | 4 |
| 23 | 25 |
| 24 | 19 |
| 25 | 13 |
| 26 | 27 |
| 27 | 38 |
| 28 | 30 |
| 29 | 16 |
| 30 | 12 |
| 31 | 23 |
| 32 | 3 |
| 33 | 23 |
| 34 | 19 |
| 35 | 14 |
| 36 | 46 |
| 37 | 23 |
| 38 | 37 |
| 39 | 38 |
| 40 | 28 |
We need to find out the maximum value and the 10 neighboring members both before and after it. Remember to perform out of bounds check as it is possible that the actual number of eligible values is less than 10.
| A | |
| 1 | 23 |
| 2 | 6 |
| 3 | 1 |
| 4 | 37 |
| 5 | 49 |
| 6 | 42 |
| 7 | 40 |
| 8 | 15 |
| 9 | 31 |
| 10 | 17 |
| 11 | 1147 |
| 12 | 18 |
| 13 | 30 |
| 14 | 22 |
| 15 | 4 |
| 16 | 25 |
| 17 | 19 |
| 18 | 13 |
| 19 | 27 |
| 20 | 38 |
| 21 | 30 |
Solution:
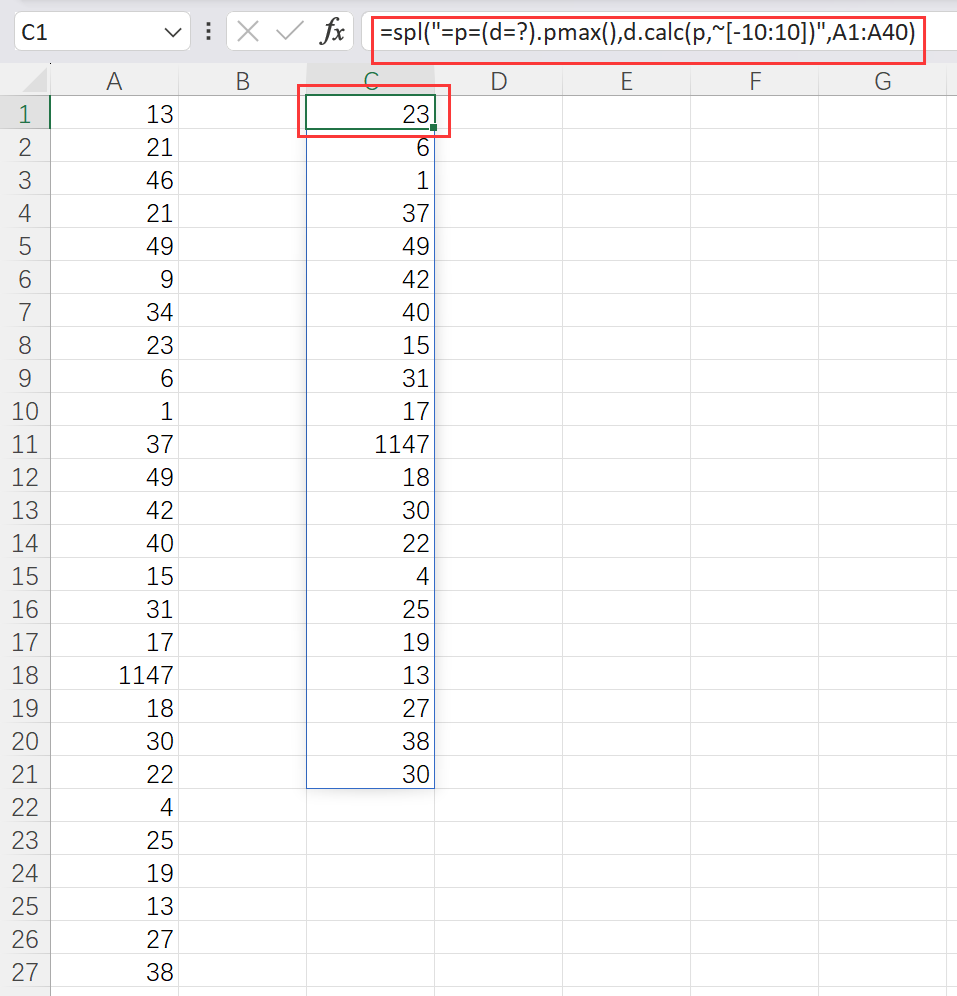
Use SPL XLL to enter the formula below:
=spl("=p=(d=?).pmax(),d.calc(p,~[-10:10])",A1:A40)

Explanation:
pmax()function gets the position of the maximum value. calc() function performs the computation according to the specified positions; ~ represents the current member, and [] gets members according to the interval specified by the relative positions, which automatically prevents the array index out of bounds.
esProc Desktop is now FREE to download. Please do not hesitate to try it by yourself! http://www.scudata.com/download-Desktop
Subscribe to my newsletter
Read articles from esProc directly inside your inbox. Subscribe to the newsletter, and don't miss out.
Written by

esProc
esProc
esProc SPL is a JVM-based programming language designed for structured data computation, serving as both a data analysis tool and an embedded computing engine. FREE download👉🏻: https://www.esproc.com/download-esproc