Day 76: Build a Grafana dashboard
 Siri Chandana
Hello everyone!!! Today, we are exploring the wonderful world of Grafana dashboards📈📊. Dashboards are the command centers of your monitoring system, providing a visual representation of your data and analytics. Let's create our own dashboard masterpiece!
Grafana, an open-source data analysis system, plays an important role in the data analytics field. Here, we will delve into Grafana's uses and its significance in a variety of professional sectors.
Its primary goal is to facilitate data analysis through the use of metrics. Users may efficiently visualize their data by consolidating charts and graphs into a single or several dashboards, making complex data sets easier to comprehend and understand.
Grafana dashboard:
Grafana dashboards support multiple panels in a single grid. Results from several data sources can be seen simultaneously. It is a powerful open-source analytical and visualization tool made up of numerous independent panels placed in a grid. The panels communicate with configured data sources, such as AWS CloudWatch, Microsoft SQL Server, Prometheus, MySQL, InfluxDB, and others.
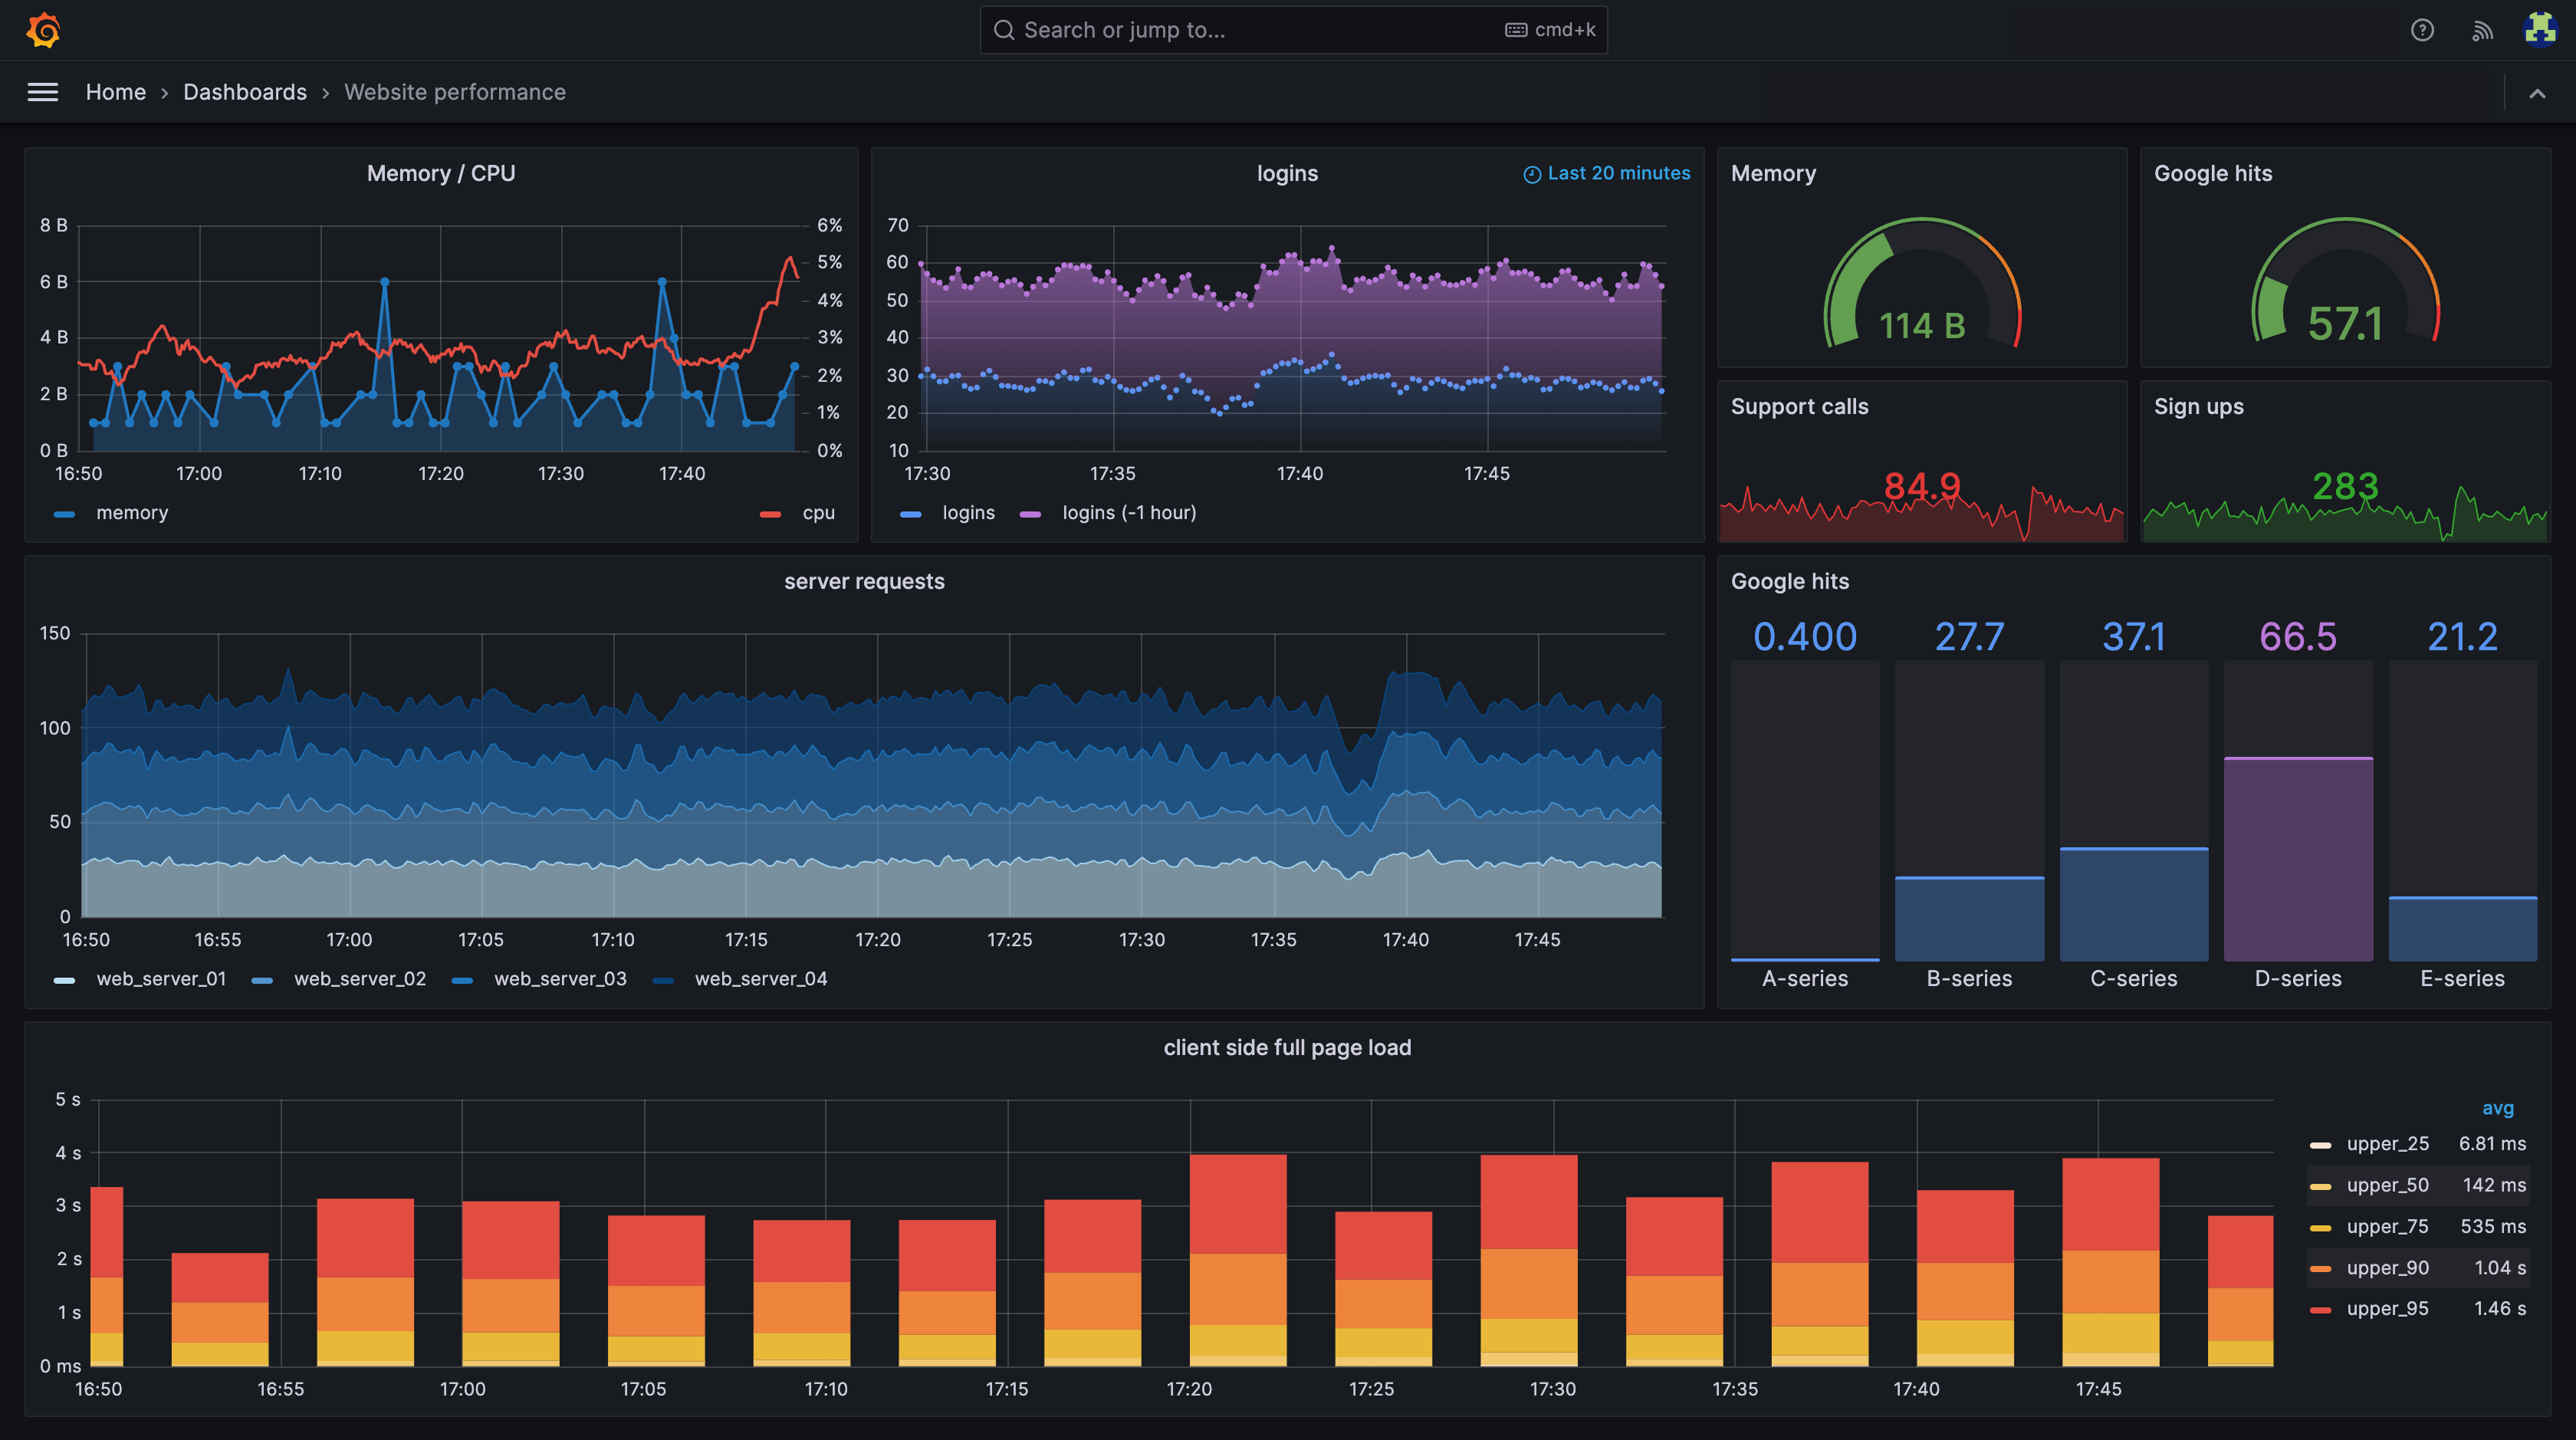
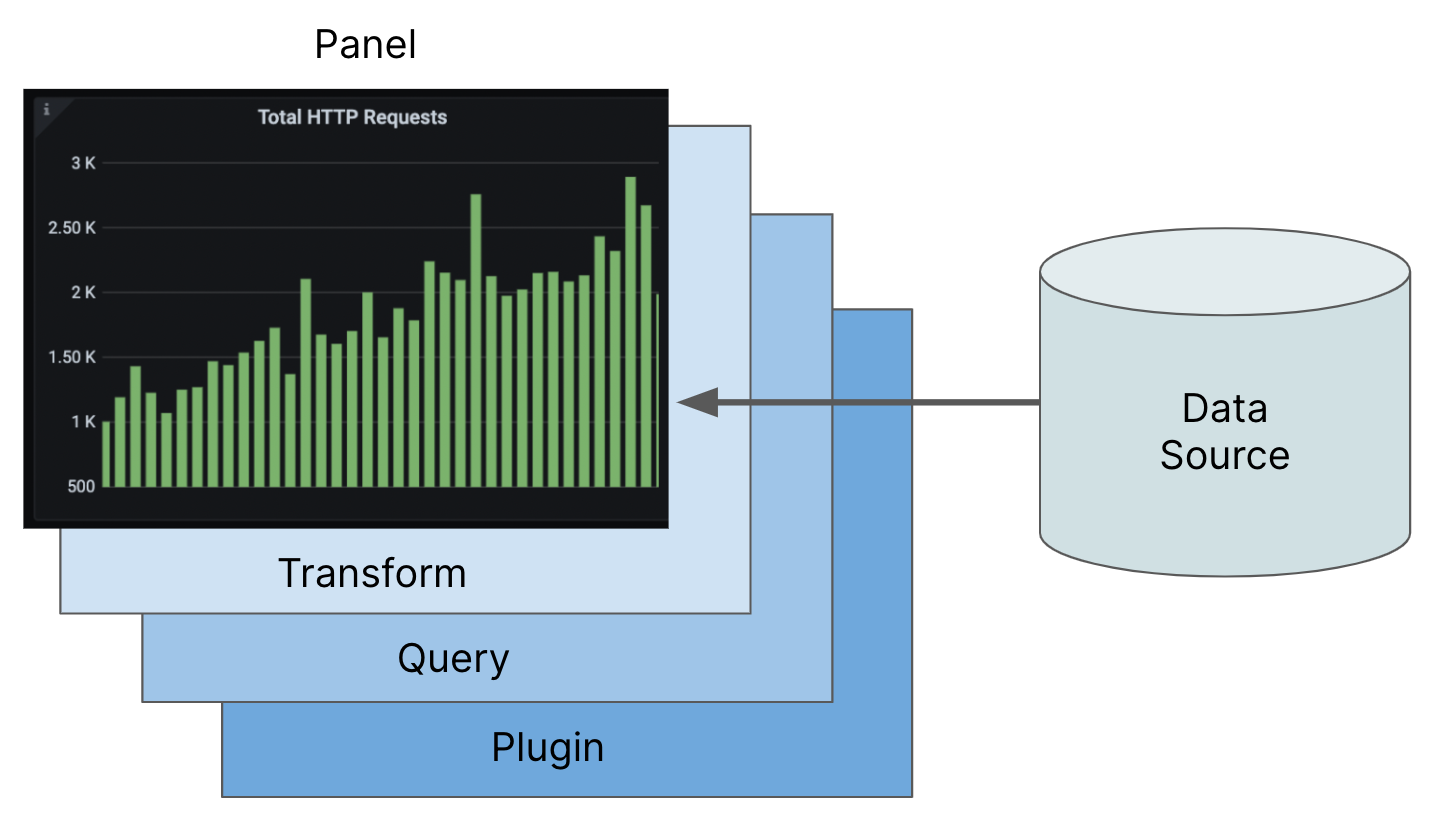
Creating a dashboard, particularly in the context of monitoring and observability tools like Grafana, involves understanding various components and how they work together to provide a comprehensive view of your data. Here's a detailed breakdown of the anatomy of a dashboard:
1. Dashboard Layout
Panels: The building blocks of a dashboard. Each panel displays a specific visualization or data metric.
Grid Layout: Dashboards are organized in a grid layout where panels can be resized and arranged to fit the desired design.
Rows and Columns: Panels can be grouped into rows and columns for better organization and readability.
2. Panels
Visualization Types: Graphs, tables, single-stat, heatmaps, bar gauges, pie charts, etc.
Panel Titles: Descriptive titles that provide context to what the panel displays.
Query Editor: Interface for writing queries to fetch data from data sources.
3. Data Sources
Configuration: Each data source needs to be configured with its specific settings, such as URL, credentials, and query language.
Query Language: Depending on the data source, different query languages may be used (e.g., PromQL for Prometheus, SQL for databases).
Alerting
Notification Channels: Configure where alerts are sent, such as email, Slack, PagerDuty, etc.
Alert State: Visual indicators of alert states (e.g., alerting, no data, pending) on the dashboard.
Dashboard Settings
General Settings: Dashboard title, description, and tags for easy categorization and search.
Time Range: Default time range for the dashboard, with options for relative and absolute time ranges.
Auto-Refresh: Set intervals for auto-refreshing the dashboard to keep the data up-to-date.
Features of grafana dashboard:
Here are some key features of Grafana dashboards:
Data Source Integration: Supports a wide variety of data sources, including Prometheus, Graphite, InfluxDB, Elasticsearch, MySQL, PostgreSQL, and many more, and allows multiple data sources to be used in a single dashboard.
Rich Visualizations: Provides various visualization types, including graphs, tables, heatmaps, histograms, and customizable panels to fit specific visualization needs.
Dashboard Sharing: Allows sharing dashboards via links, snapshots, or embedded iframes. Snapshots can be public or private, enabling sharing with a broader audience without giving direct access to the Grafana instance.
Alerting: built-in alerting system to create, manage, and alert on conditions in real-time. Supports various notification channels such as email, Slack, PagerDuty, and more.
Annotation and Event Tracking: Users can annotate charts with events for better context. Annotations can be queried from data sources or added manually.
Customizable and Extendable: Allows creation of custom plugins for panels, data sources, and apps. The plugin ecosystem provides numerous community and commercial plugins to extend functionality.
User Management and Access Control: Supports multiple user roles and granular permissions. Organization and team management features for collaborative environments.
Query Editor: An advanced query editor for building complex queries using native query languages from supported data sources.
Why do we use Grafana Dashboards?
Grafana dashboards are used for several key reasons, making them a popular choice for monitoring and observability across diverse systems and applications:
Consolidated Data: Grafana allows you to integrate and visualize data from multiple sources in a single dashboard, providing a comprehensive view of your system's health and performance.
Visualizations: It offers various visualization types, including graphs, charts, tables, heatmaps, and more, enabling clear and effective data representation.
Live Updates: Grafana dashboards can display real-time data, making it easier to monitor system performance and health as it happens.
Alerting: Built-in alerting capabilities notify users of critical issues or threshold breaches, ensuring timely responses to potential problems.
Custom Dashboards: Users can create tailored dashboards that meet specific needs, using templating and variables for dynamic content.
Shared Insights: Dashboards can be shared with team members or external stakeholders, facilitating collaboration and decision-making based on shared data insights.
User-Friendly Interface: Grafana’s intuitive interface makes it accessible to users with varying technical expertise.
CI/CD Pipeline Monitoring: It can be used to monitor and visualize CI/CD pipelines, helping teams track the progress and performance of their deployments.
Task 1:
Crafting Your First Panel
Configuring Loki and Promtail for Efficient Log Management
Step 1: Download Configuration Files
First, let us create a folder and download the necessary YAML configuration files for Loki and Promtail.
mkdir loki-promtail-config
cd loki-promtail-config

wget https://raw.githubusercontent.com/grafana/loki/main/cmd/loki/loki-local-config.yaml -O loki-config.yaml

wget https://raw.githubusercontent.com/grafana/loki/main/clients/cmd/promtail/promtail-local-config.yaml -O promtail-config.yaml

Step 2: Run Loki Docker Container
Now, let us start the Loki Docker container with the following command:
wget https://raw.githubusercontent.com/grafana/loki/v3.0.0/cmd/loki/loki-local-config.yaml -O loki-config.yaml
wget https://raw.githubusercontent.com/grafana/loki/v3.0.0/clients/cmd/promtail/promtail-docker-config.yaml -O promtail-config.yaml
Remember that we have mapped port 3100 to the Loki container for quick access.
Step 3: Open Port in Security Group

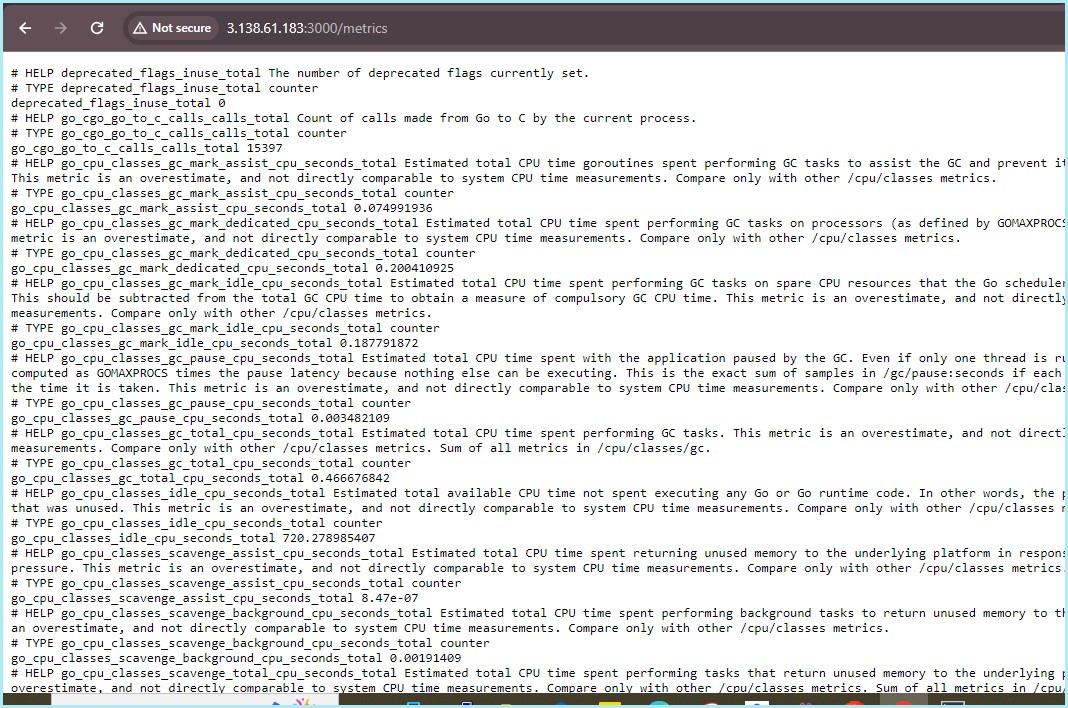
Do not forget to open port 3100 in the security group to make sure proper communication with the Loki container.
Step 4: Run Promtail Docker Container
Next up, let's start the Promtail Docker container to collect logs. Run the following command:
wget https://raw.githubusercontent.com/grafana/loki/v3.0.0/clients/cmd/promtail/promtail-docker-config.yaml -O promtail-config.yaml
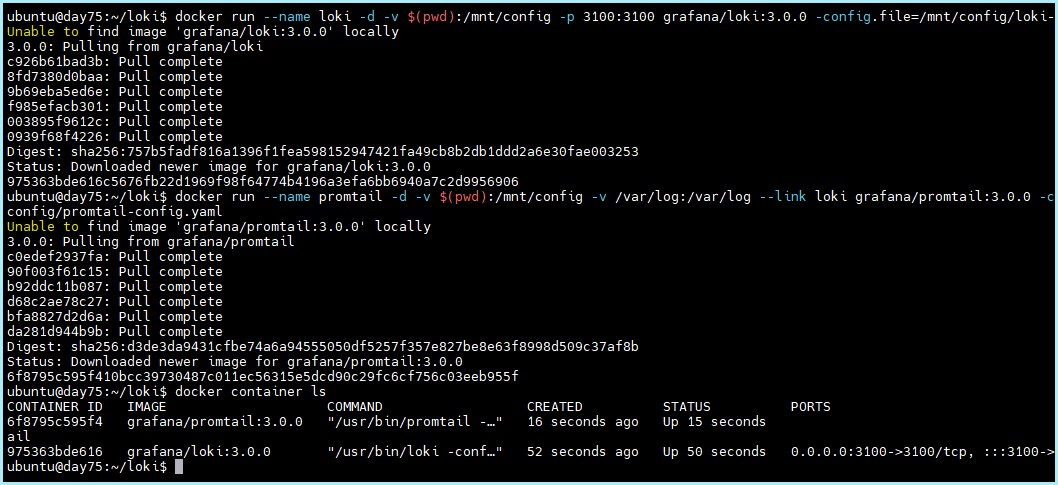
This command links the Promtail container to Loki for efficient log streaming.
Step 5: Configure Data Source in Grafana
Navigate to the Grafana webapp and add the Loki data source. Provide the HTTP URL localhost:3100, then save and test the connection. later click on Explore data.
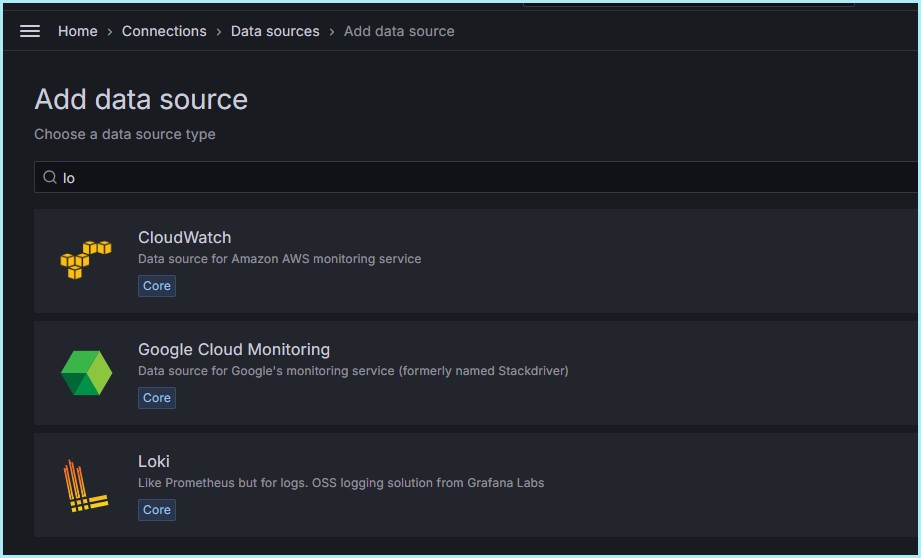
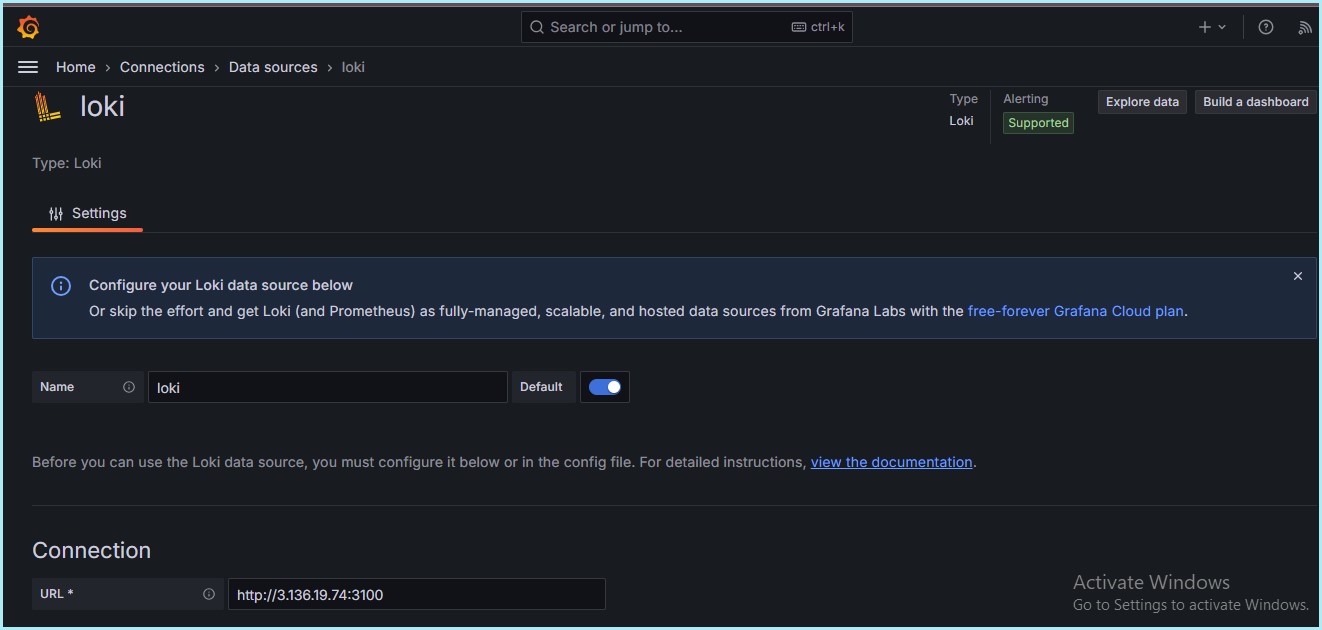
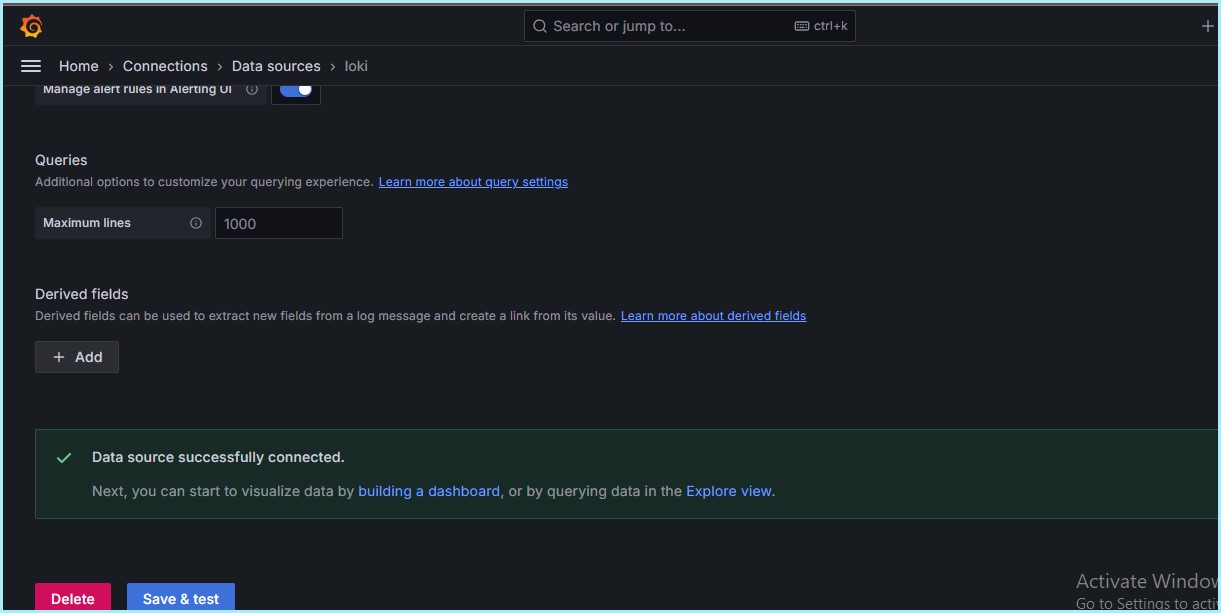
Step 6: Explore Logs in Loki
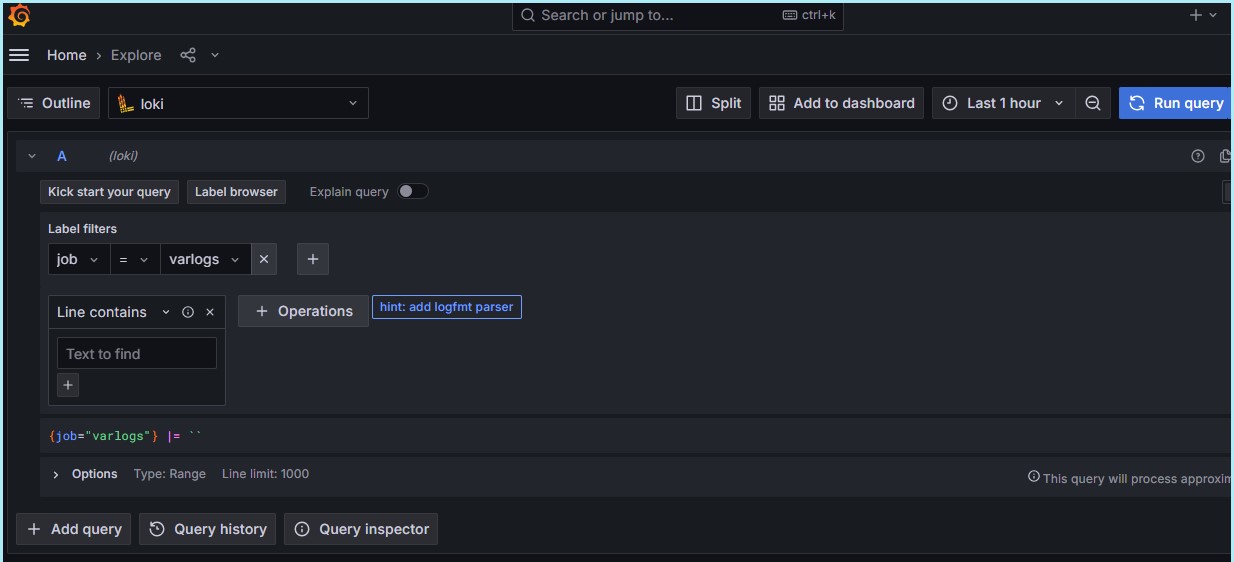
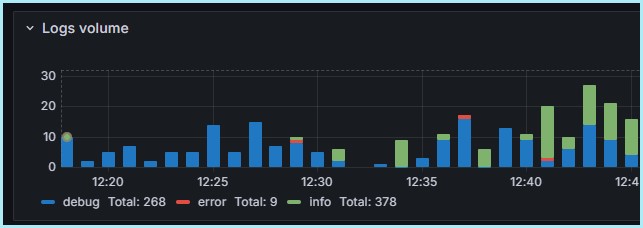
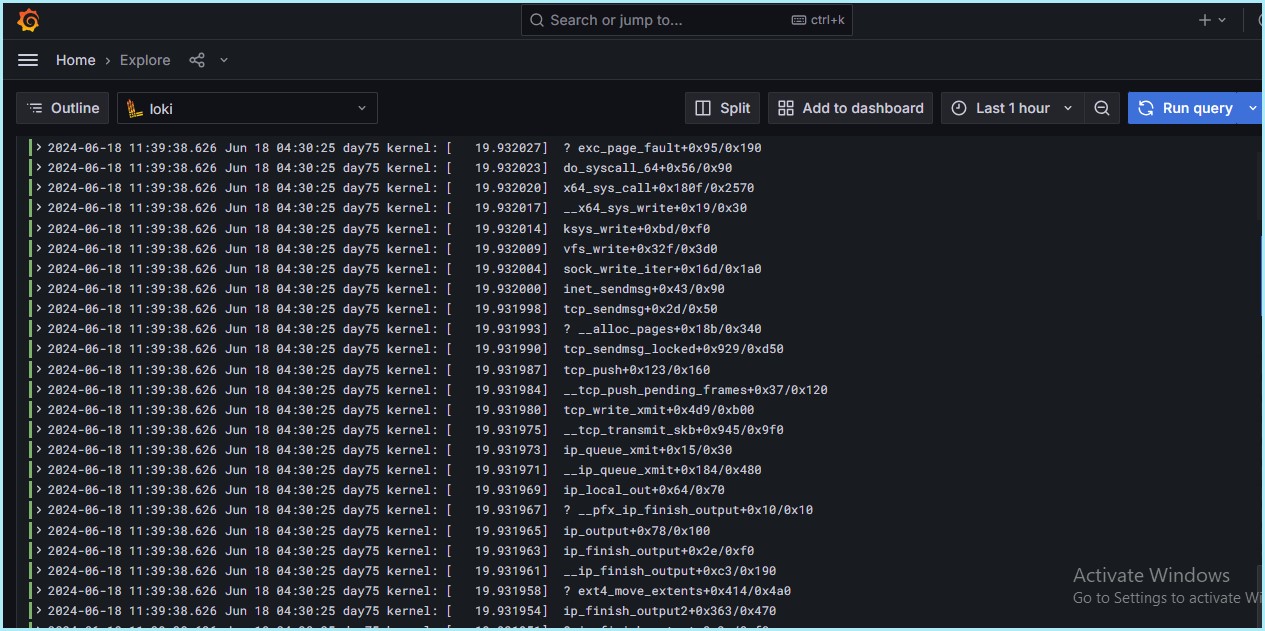
To view Loki's logs, navigate to the Explore section in Grafana. To see system logs more efficiently, set label filters for jobs and varlogs.
Label Filter ~> Job = varlogs
Step 7: Create Dashboard
Let's create a complete dashboard with Grafana. Use logs and visualizations to properly monitor system performance and faults.


Label Filter ~> Job = varlogs
line contains ~> error
Rate ~> range functions
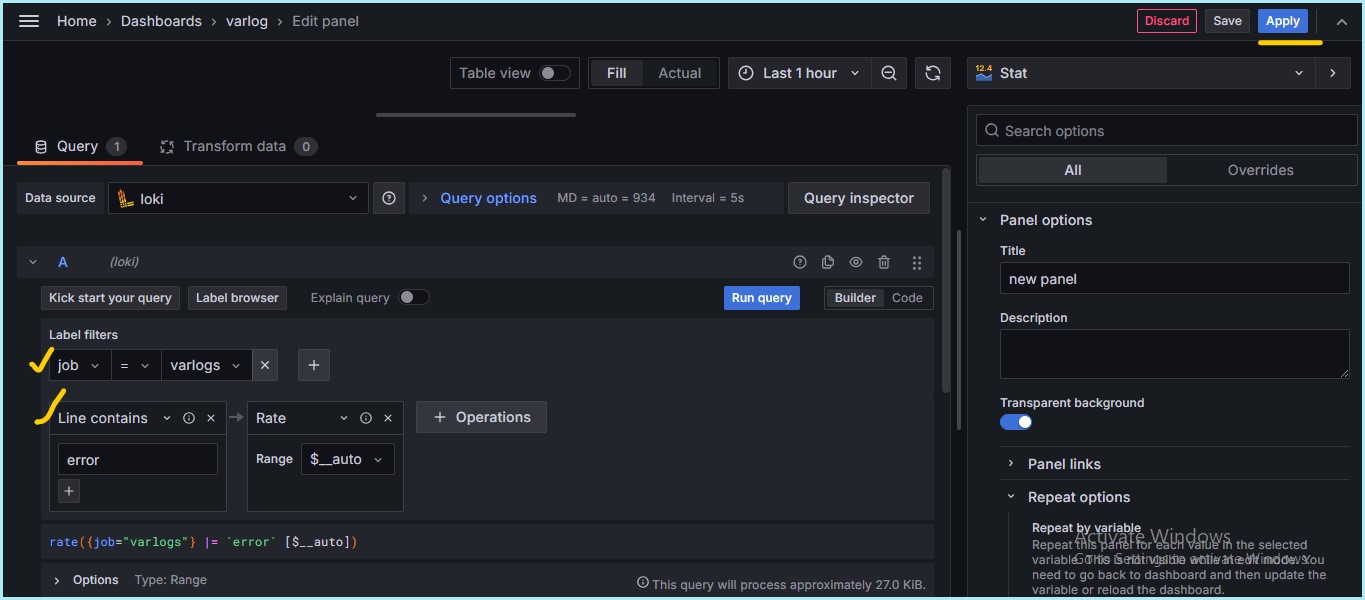
As all the details are filled in, click on “Run Queries” and then add the panel to the dashboard
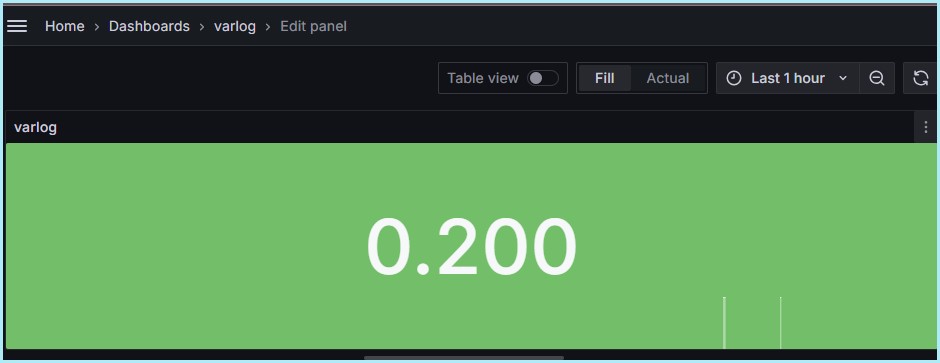
Monitor Grafana logs:
To display the Grafana log, we need to add the grafana log path to the promtail-config.yaml file in the target section, as illustrated below.
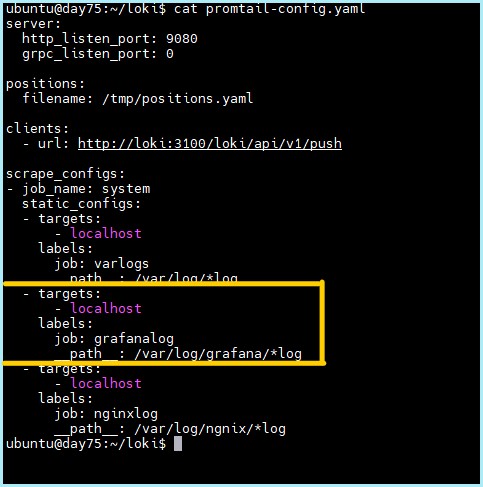
- Now restart the promtail container using the following Docker Command.
  docker ps

  docker restart promtail
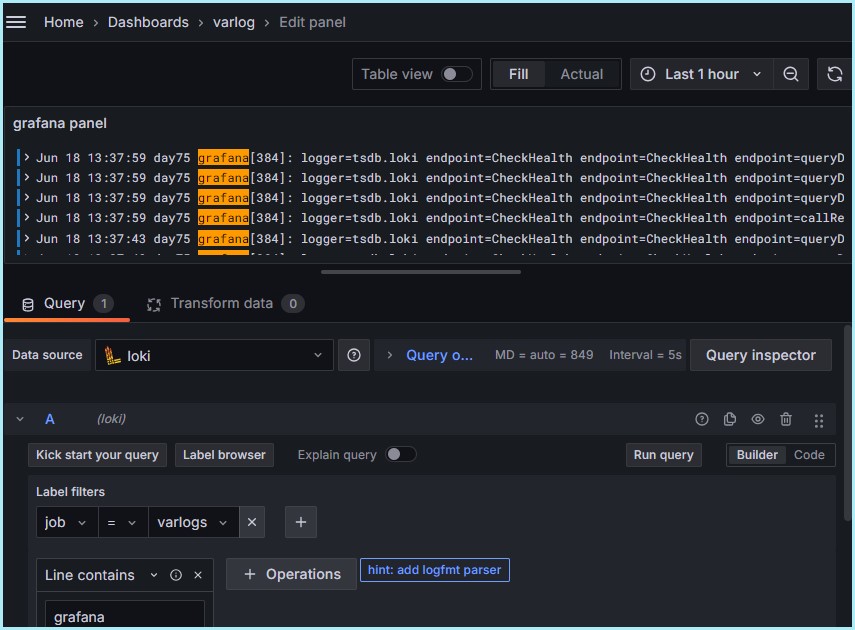
Now, we can choose the label filters and the line contains and visualization option to view in a graphical manner. click on run query option to add this to our dashboard.
Label Filter ~> Job = varlogs
line contains ~> grafana
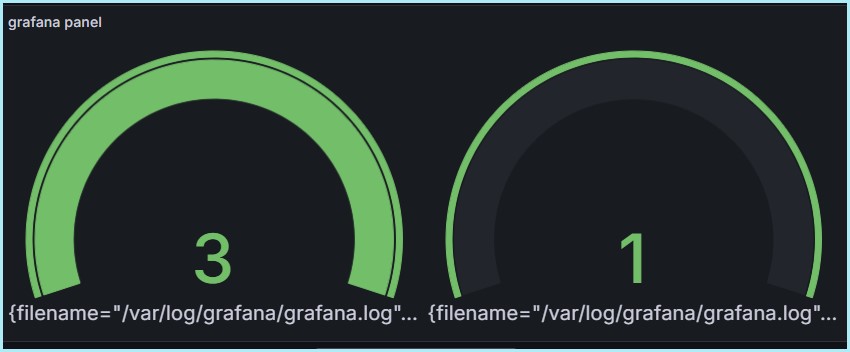
Label Filter ~> Job = grafanalogs
line contains ~> error
Rate=count over time
Step 8: Install Nginx and Monitor Installation Logs
- Install Nginx on your EC2 instance

To monitor the Nginx log , we have to add the Nginx directory path in the promtail configuration file.
In the promtail-config.yaml add the Nginx job and log file location.
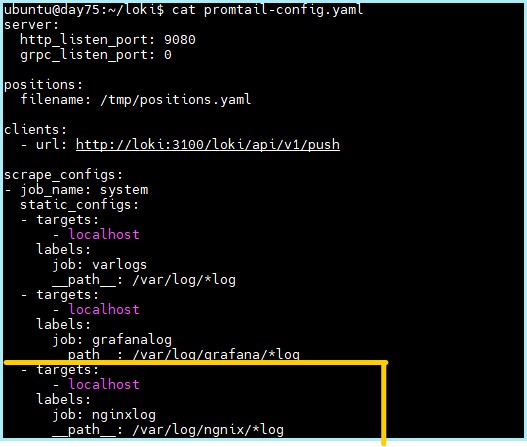
Now restart the Promtail container using the following Docker command
  docker restart promtail
  docker ps
Now add the items in the Query for getting Nginx Logs, enter the details of the label and add a suitable title for the Panel.
Labesl Filter ~> Job = varlogs
line contains ~> nginx
Rate ~> Count over time
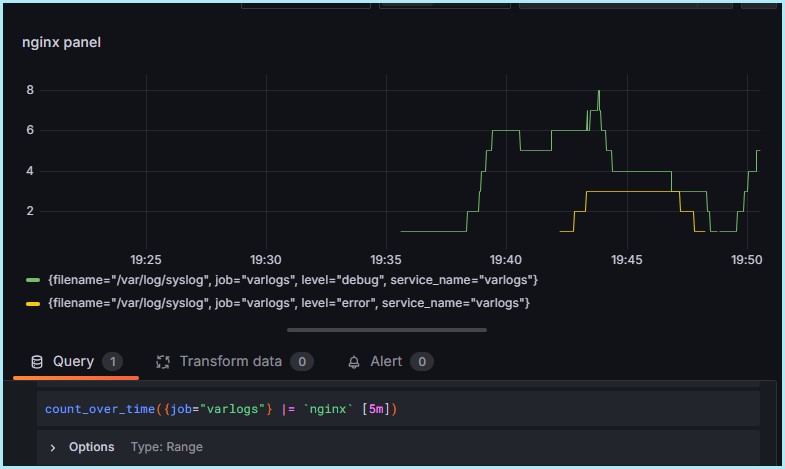
Step 9: Your Customized Dashboard
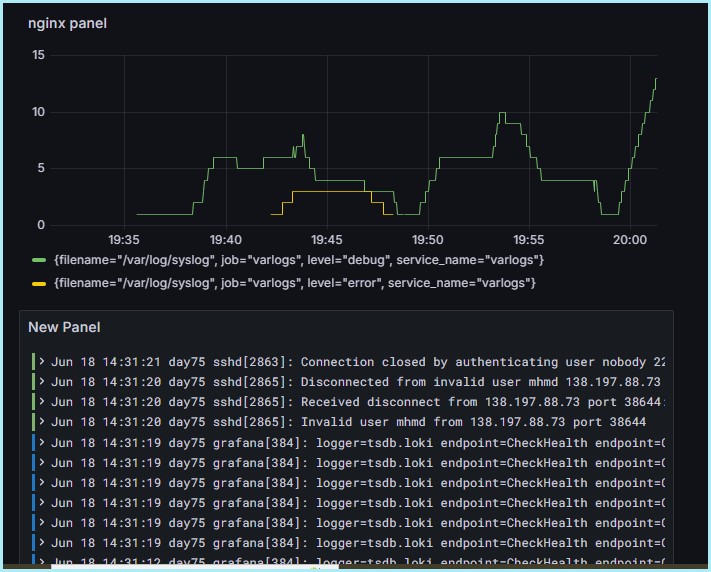
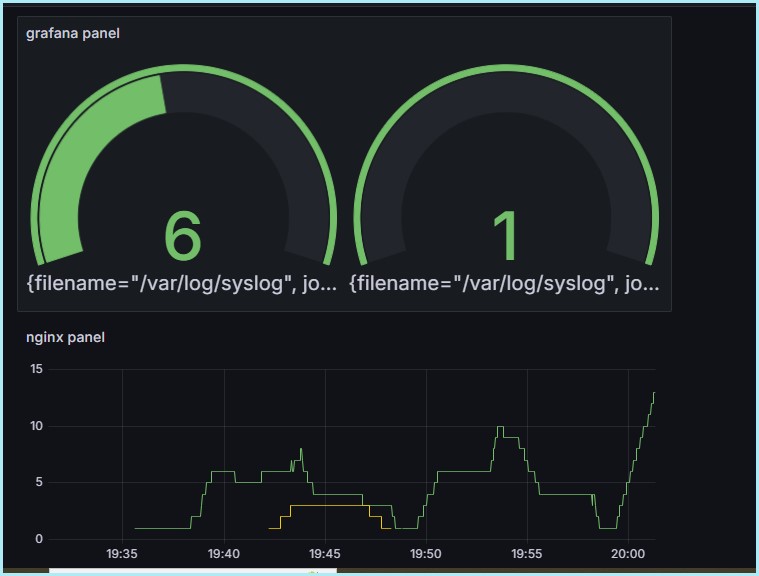
Congratulations! You have successfully created a simple Grafana dashboard .
Grafana's extensive visualization and customization features allow you to construct informative and visually appealing dashboards for monitoring and analyzing data.
To get more out of your 📈📊dashboards, Delve into more customization possibilities in Grafana, such as multiple visualization kinds, alerts, and advanced query techniques. Have fun creating dashboards!!!
Thank you📖 for reading this Blog. If you found this ✨ helpful, please 👍like, 🌀share, and follow me for more blogs.
Happy Learning😊😊
Connect on 👉 chandana LinkedIn
Subscribe to my newsletter
Read articles from Siri Chandana directly inside your inbox. Subscribe to the newsletter, and don't miss out.
Written by
