Day 77 : Grafana Alerting ☁☁
 Siri Chandana
Grafana Cloud is a cloud-hosted version of the popular open-source Grafana data visualization and monitoring tool. It is a popular choice for organizations that want to leverage the power of Grafana without the overhead of managing the underlying infrastructure and platform. It offers a convenient, scalable, and fully managed observability solution for monitoring and analyzing various aspects of their systems and applications.

What is Grafana Cloud Alerting?
Grafana Cloud Alerting is an alerting service that runs on Grafana Cloud, providing advanced alerting capabilities without the need for managing infrastructure. It offers the same powerful features as self-hosted Grafana alerting, but with additional benefits due to its managed nature. Key features include:
Tight Integration with Grafana: As a Grafana-native alerting platform, Grafana Cloud Alerting is deeply integrated with the Grafana dashboarding and visualization capabilities. This allows users to create alerts directly from their Grafana dashboards, making it easy to monitor and respond to issues.
Flexible Notification Channels: Grafana Cloud Alerting supports a wide range of notification channels, including email, Slack, PagerDuty, and custom webhooks, allowing users to integrate alerts with their existing workflows and communication tools.
Hosted Solution: There is no need to install, configure, or maintain alerting infrastructure. Grafana Cloud handles all the backend management.
Scalability: It is designed to handle a large volume of metrics and alerts, making it suitable for organizations of any size.
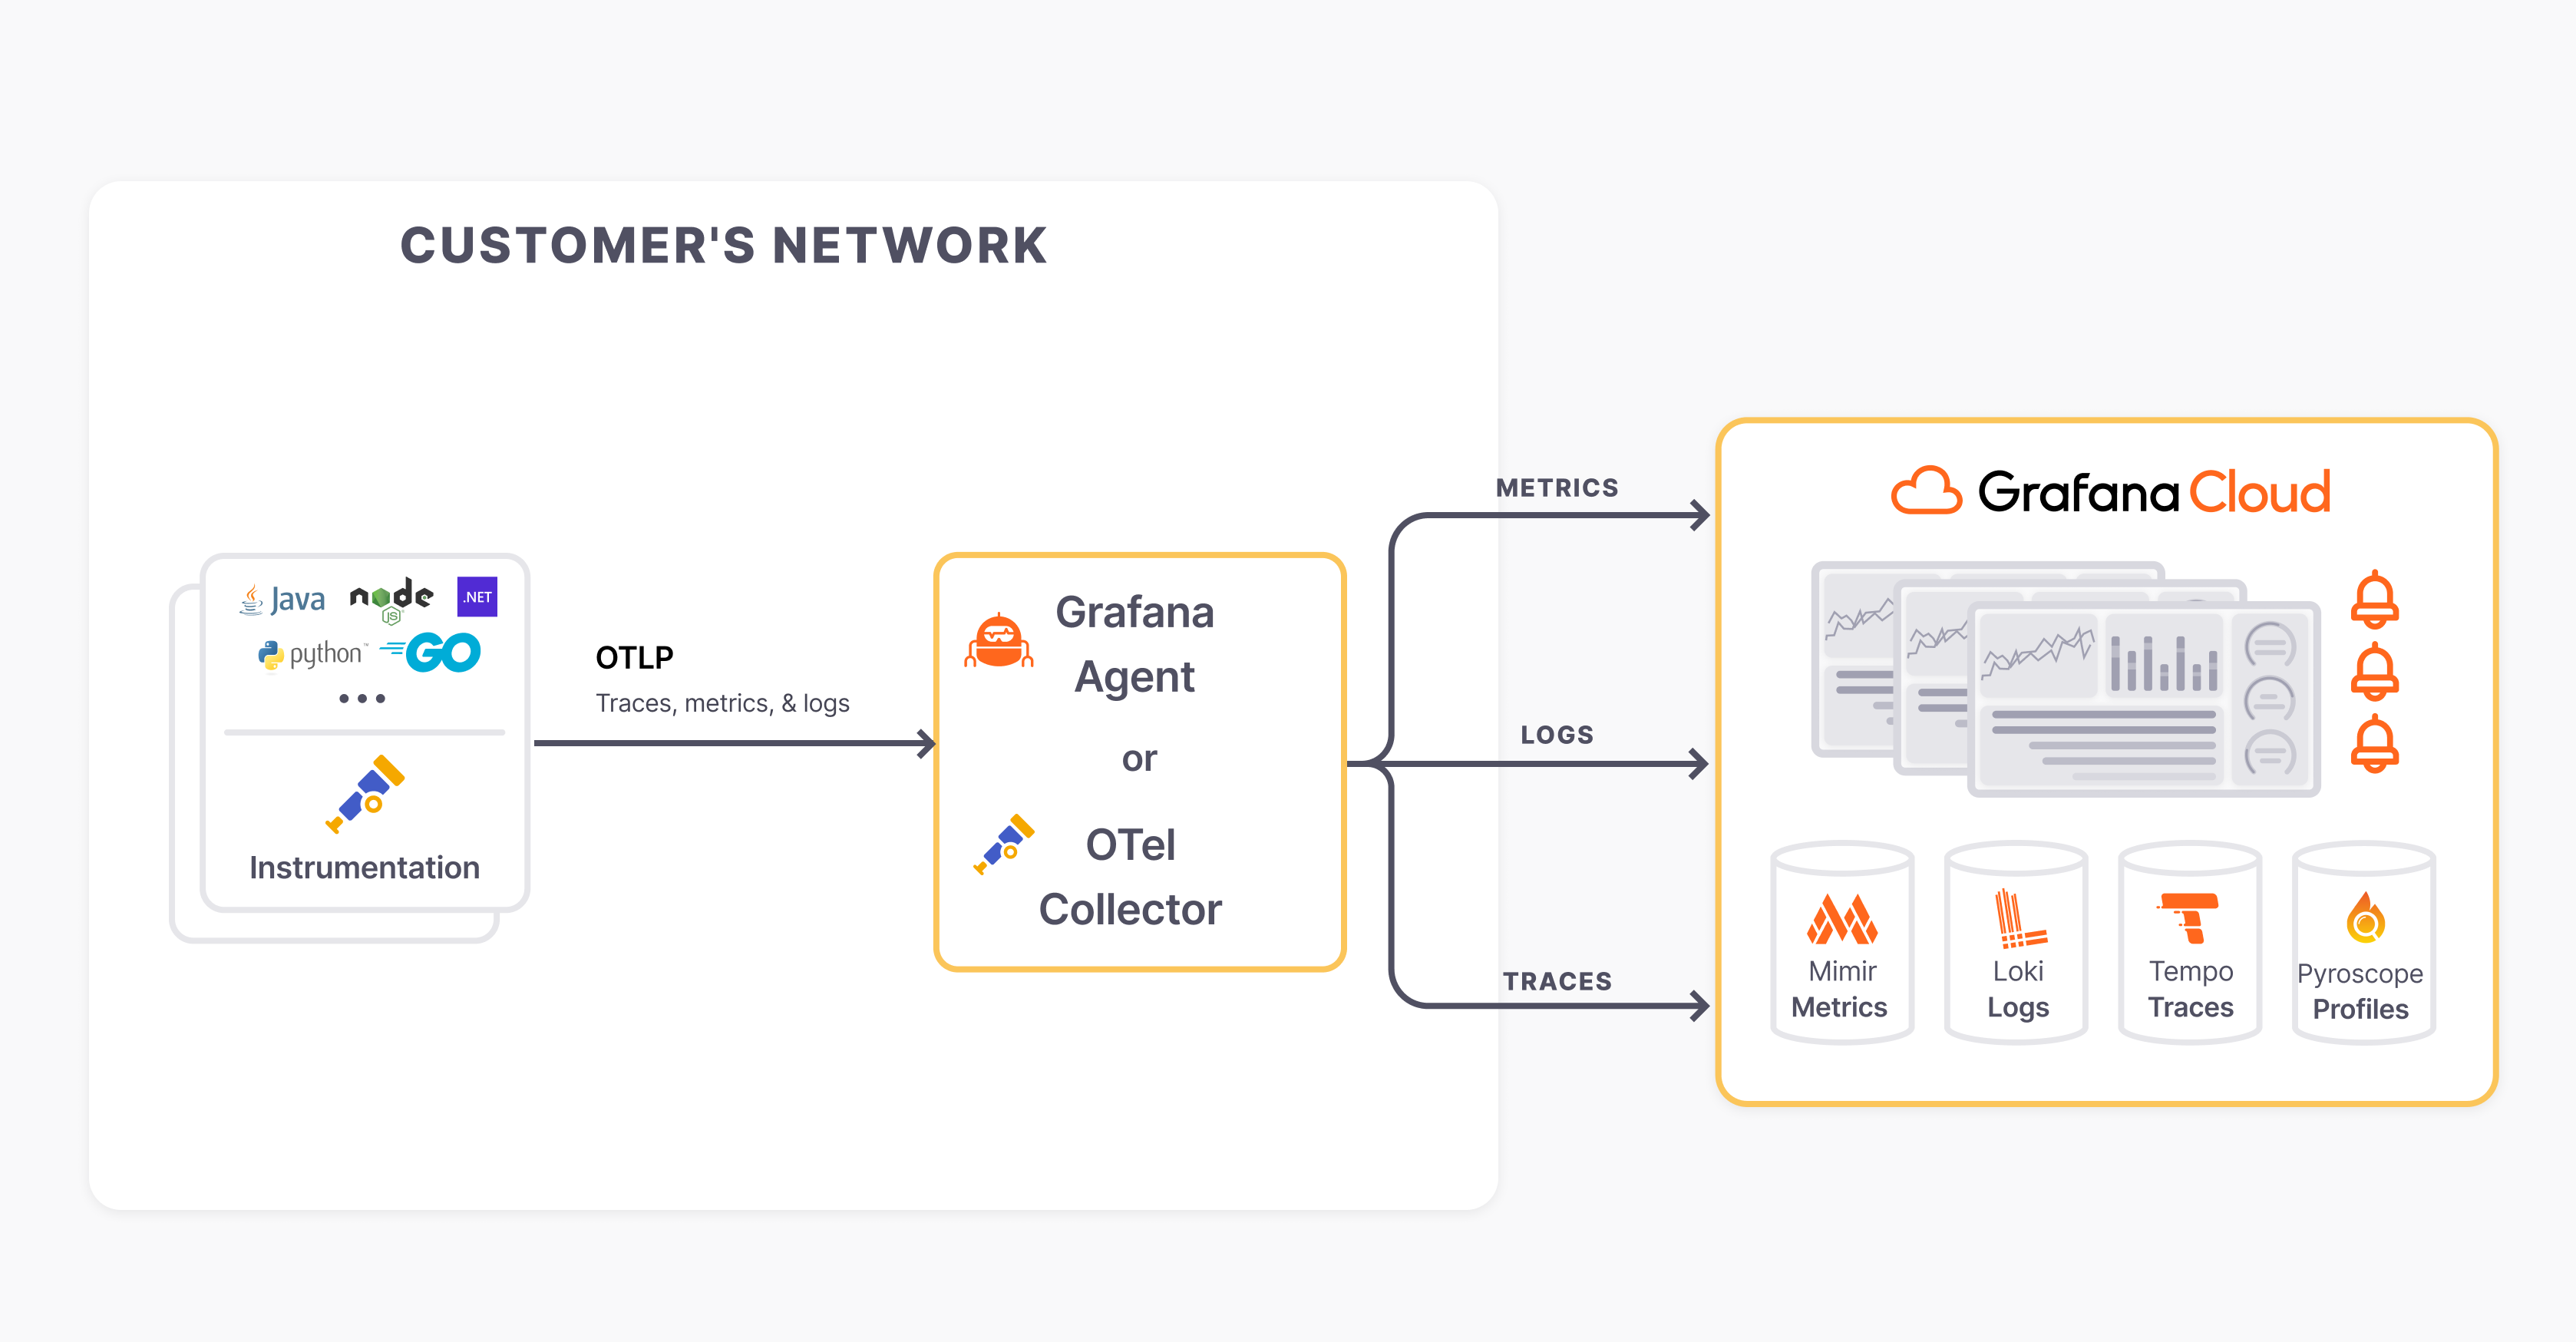
Integrated Ecosystem: Works seamlessly with other Grafana Cloud services like Grafana Cloud Metrics, Grafana Cloud Logs, and Grafana Cloud Traces.
Unified Alerts: centralized management of alerts across multiple data sources and environments.
Why do we use Grafana Cloud Alerting?
Ease of Use: Grafana Cloud Alerting is straightforward to set up, eliminating the complexity of configuring and maintaining a self-hosted alerting solution.
Reduced Operational Overhead: With Grafana Cloud managing the alerting infrastructure, users can focus on defining and managing alerts without worrying about underlying systems.
Scalability: Grafana Cloud is designed to scale effortlessly, supporting large-scale monitoring and alerting needs without performance degradation.
Integration with Grafana Cloud Services: seamlessly integrates with other Grafana Cloud services, providing a cohesive observability solution.
High Availability and Reliability: Leveraging Grafana Cloud’s infrastructure ensures alerts are reliably evaluated and delivered.
Comprehensive Monitoring: It supports a wide range of data sources and can handle complex alerting scenarios, offering a robust solution for monitoring diverse systems and applications.
Cost-effective: By using a managed service, organizations can save on the costs associated with maintaining their own alerting infrastructure.
What is the workflow of Grafana Cloud Alerting?
The workflow of Grafana Cloud Alerting involves several steps to define, evaluate, and manage alerts. Here’s a detailed overview of the workflow:
1. Define Data Sources and Metrics
Add Data Sources: Integrate data sources such as Prometheus, InfluxDB, Graphite, etc., into Grafana Cloud.
Configure Data Sources: Set up the connection details and ensure data is being ingested correctly.
Visualize Data: Create dashboards and panels to visualize the metrics you want to monitor.
Query Metrics: Use Grafana's query editor to write queries that fetch the required metrics from the data sources.
2. Create Alert Rules
New Alert Rule: Create a new alert rule by specifying the conditions under which the alert should trigger.
Define Conditions: Set conditions based on the metric values. For example, an alert can be triggered if the CPU usage exceeds 80%.
Evaluation Interval: Specify how often the conditions should be evaluated (e.g., every minute).

Alert State: Define the alert states (e.g., OK, Pending, Alerting) based on the evaluation results.
3. Configure Notification Channels
Add Notification Channels: Create notification channels such as Email, Slack, PagerDuty, Webhooks, etc. Provide necessary details like email addresses, Slack webhook URLs, or PagerDuty integration keys.
Test Notifications: Send test notifications to ensure that the channels are set up correctly and are receiving alerts.
Link Alert Rules to Notification Channels
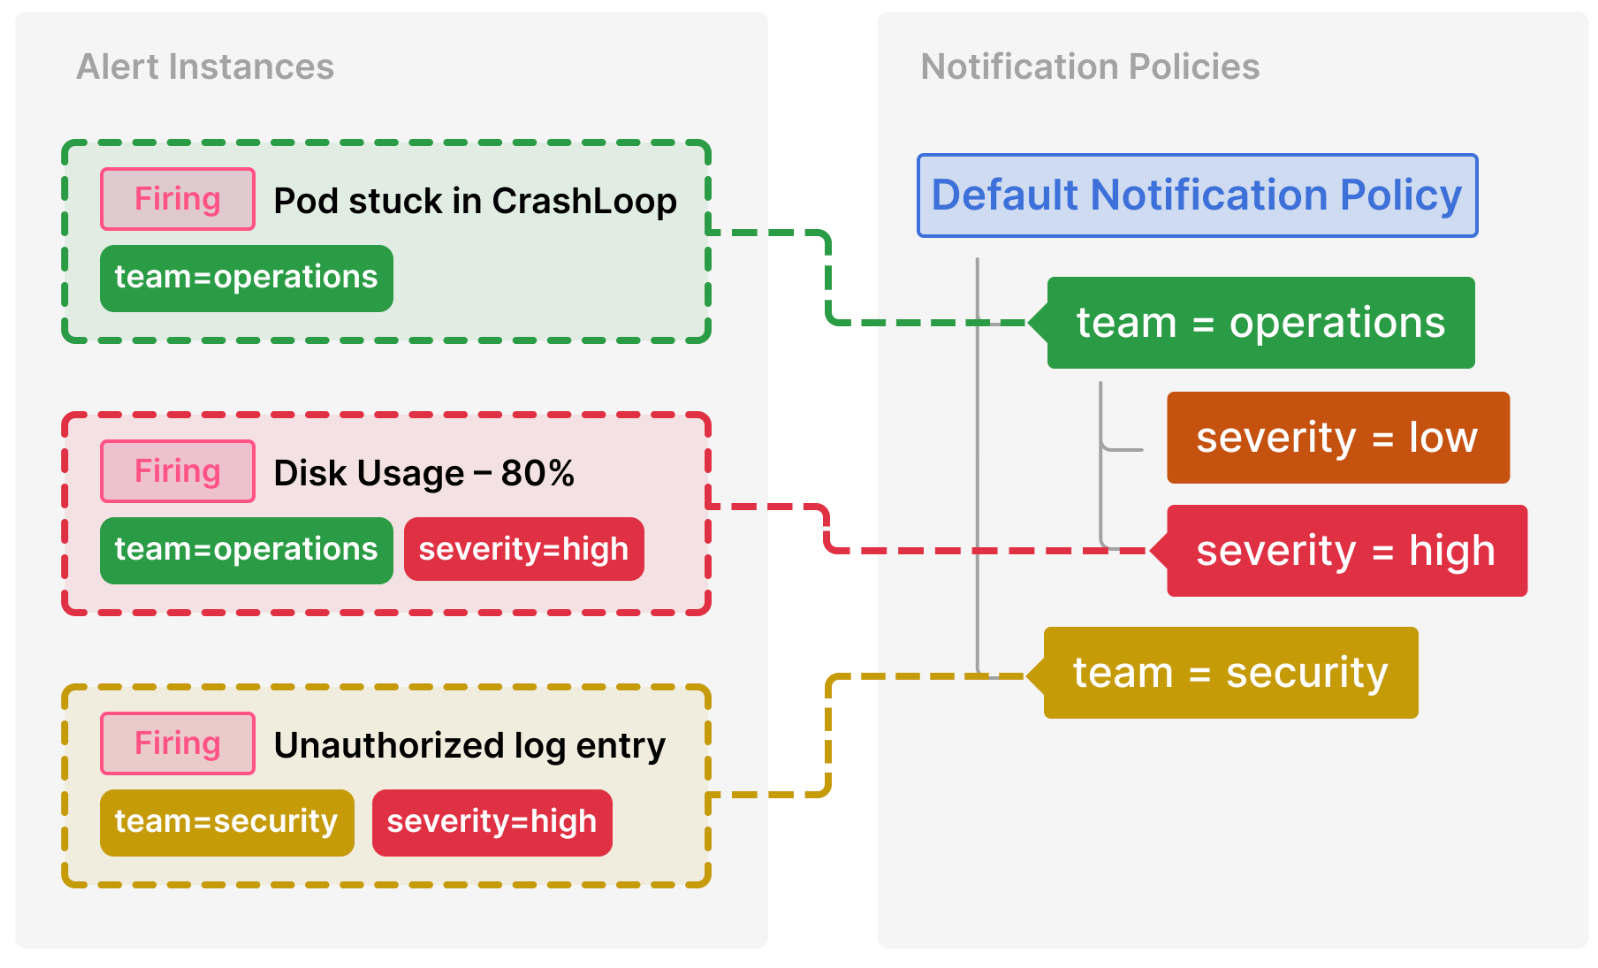
Assign Channels: Link alert rules to the configured notification channels. This ensures alerts are sent to the right places when triggered and define routing policies to manage how alerts are grouped and sent to different channels based on their labels or other criteria.
5. Evaluate and Trigger Alerts
Regular Evaluation: Grafana Cloud evaluates alert rules at the specified intervals. It checks if the defined conditions are met for each evaluation cycle.
Trigger Alerts: If conditions are met, the alert is triggered and changes state to “Alerting.”
Send Notifications: Notifications are sent to the linked channels, informing the designated recipients.
6. Manage and Monitor Alerts
Active Alerts: View and manage active alerts in the Grafana Cloud Alerting section.
Silence Alerts: Temporarily silence alerts during maintenance or known issues to avoid alert fatigue.
Alert Logs: Access a history of triggered alerts, which includes timestamps, conditions met, and notifications sent.
Audit and Analyze: Review past alerts to understand trends and improve alert definitions.
7. Respond to Alerts
Acknowledge Alerts: Acknowledge alerts in your incident response system (e.g., PagerDuty) to start the resolution process.
Take Action: Use the information provided by the alert to diagnose and resolve the issue.
Review Alert Effectiveness: After resolving incidents, review the alerts to determine if the conditions and thresholds were appropriate.
Setting up Grafana Cloud Alerting:

Step 1: Navigate to the Grafana Cloud website (grafana.com/cloud) and sign up for an account.
Step 2: Set up your Grafana Cloud account, including providing the necessary details and configuring preferences.
Step 3: Scroll down until you see the Prometheus option and hit the ‘Send Metrics’ button.
Step 4: Follow the instructions on the screen to integrate your Prometheus server with Grafana Cloud.
Step 5: You have to add the remote_write module to your existing prometheus.yml configuration file.
Step 6: Once this is set up, we can import our preferred Grafana dashboard or create our own one and start monitoring our infrastructure
Setup Sample Alerting:
The following step will be executed within Grafana OSS.
Step 1: Log in to your Grafana dashboard. Click on “Alerting” in the left-hand sidebar to access the Alerting configuration.
Step 2: Click "Create Rule" to create a new alerting rule.
Step 3: Set the conditions for the alerting rule depending on your data and requirements. Once complete, save the Alert Rule.
Step 4: Choose Contact Points to designate which notification channels, such as email, Slack, or other integrations, will get alerts when activated.
In this scenario, I shall use Slack. To send messages using Incoming Webhooks, follow the instructions outlined in the Slack official documentation.
Step 5: Our alert is currently in a normal state, with CPU utilization of no more than 2%.
Step 6: Let’s stress our system using the below commands and see if the alerting system works as expected.
sudo apt install stress stress --cpu 4
Step 7: We can see that our alert rule is now in 'Firing' mode, and it has produced a Slack alert.
Step 8: Once we end the stress test, the system will resolve the alert and tell us via Slack.
Congratulations! ✨✨ You have now configured Grafana Cloud🌩🌩 and established some sample alerting rules to automatically track your systems and respond to possible issues in real time.
Grafana Cloud Alerting provides you with a valuable tool for staying ahead of system issues and ensuring smooth operations. It is designed to integrate smoothly with Grafana Cloud's other components, such as Metrics, Logs, and Traces, to create a full observability platform.
Thank you for reading. 👍 Happy Learning😊😊
If you like this article , then click on 👏👏 do follow for more interesting 📜articles. Hope you find it helpful✨✨
Connect on 👉 chandana LinkedIn
Subscribe to my newsletter
Read articles from Siri Chandana directly inside your inbox. Subscribe to the newsletter, and don't miss out.
Written by

