Never Struggle with Skewed Data Again
 Ali Vijdaan
The article will give a through explanation on what skewed data is, why its bad for your models and how you can identify and fix such data.
What is Skewed Data
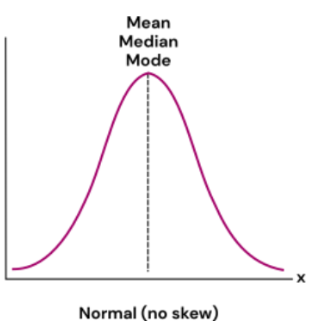
Data which is normally distributed would look like this
As you can see the mean, median and mode are all synced.
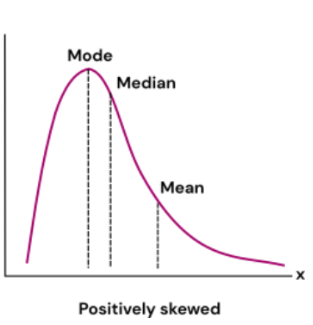
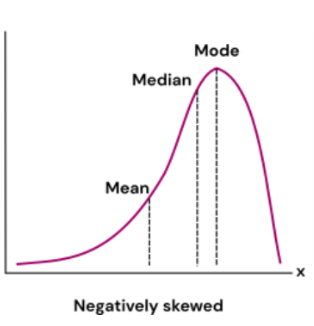
Positively skewed and Negatively skewed data have their mean, median and mode out of sync and ordered differently. The words positive and negative come from the way the data is shaped.

A positively skewed data has the 'tail' of the curve pointed towards the positive side of the x-axis. Furthermore, the mean is the greatest with mode being the least.

In a negatively skewed data the tail faces the the negative side of the x-axis and the mode is the greatest with the mean being the lowest.
Some examples of skewed data may include Wealth Distribution and Age Distribution. A graph showing the wealth would have very few people with a high net-worth while most of the data would cover the lower end of the x-axis hence creating skewed data.
Why is Skewed Data Bad
Perfect standardized residuals theoretically would have the mean, median and mode at 0. Meaning they have a normally distributed curve.
When we have data that is skewed, it implies the presence of outliers and majority of the data of being a single type i.e. imbalanced classes. Fitting models on such data can violate the assumption of residuals being normally distributed and hence give biased estimates.
Neural Networks, which use gradient descent can lead to biasness as the optimization algorithm would favor the majority. Other problems like vanishing gradients and unstable training would also occur.
Skewed data causing imbalance classes can lead to overfitting and misleading conclusions. When you have algorithms like decision trees that use criterions like Gini Impurity or Gini Entropy skewed data can cause suboptimal splits. Random Forests, which are just an ensemble of decision trees would also show similar suboptimal performance, although at a lesser scale.
Identifying Skewed Data
Dealing with skewed data can be quite easy if we work with scipy, a python library for scientific and technical computing.
We can use the scipy library with the following command
from scipy.stats import skew
When working with the Housing Dataset on Kaggle I made a function to create a Data Frame which can show whether each feature is skewed or not and by how much.
def find_skew_feature(X):
    skew_score = skew(X)
    abs_skew_score = abs(skew_score)
    bool_skew = abs_skew_score > 0.5
    skew_df = pd.DataFrame({
        'Feature' : X.columns,
        'Skew_Score' : skew_score,
        'Absolute_Skew_Score' : abs_skew_score,
        'Bool_Skew' : bool_skew
    })

    return skew_df
abs_skew_score is the absolute skew score and using the absolute skew score we can apply a threshold or criteria by which we can identify whether the feature is skewed or not. In this case the threshold I applied is 0.5. Most of the times you would see such a criteria being applied.
Fixing Skewed Data
Skewed data is fixed through Data Transformation. When dealing with the Housing Prices dataset I used log transformation to turn skewed data back to normal.
for columns in skewed_features.values:
    train_set[columns] = np.log1p(train_set[columns])
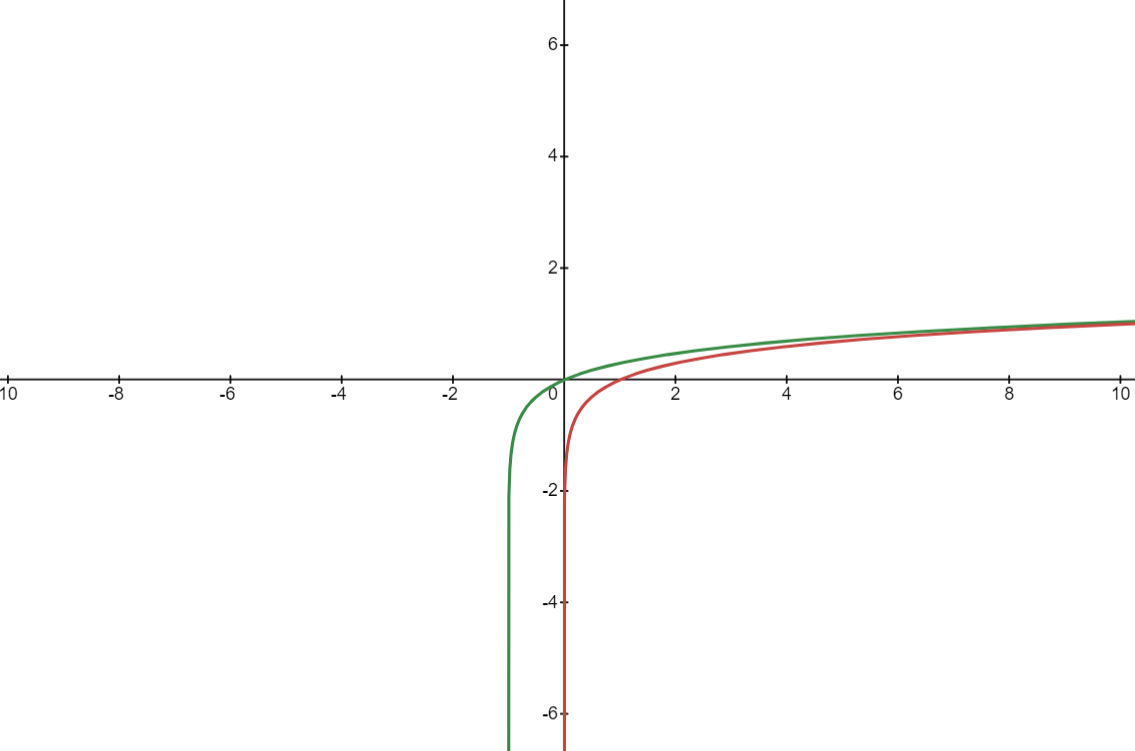
Here I have used np.log1p which basically means log(x + 1). The reason for this is np.log or log(x) does not deal with zero values.

The graph above shows two curves. The red one is np.log while the green one is np.log1p. As you can see, at 0 the red curve is undefined.
Other Transformations
There are also other ways to transform data to deal with skewed data.
Square Root Transformation
Box Cox Transformation
"""
Box-Cox can implemented using the scipy library
"""

from scipy.stats import boxcox
df['feature'], _ = boxcox(df['feature'])

"""
Box-Cox can handle both positve and negative data
"""
Conclusion
Well, there you have it. If you've reached this part I hope you were able to understand the nuances behind skewed data and how to solve them. For more in depth application of how to solve them you can see my Kaggle Notebook where I work on the Housing Price dataset.
print("Happy Coding!")
Subscribe to my newsletter
Read articles from Ali Vijdaan directly inside your inbox. Subscribe to the newsletter, and don't miss out.
Written by

