"Unmasking Outliers: Detecting and Removing Anomalies in Your Data"
 Meemansha Priyadarshini
Outliers are the data points which differ significantly from the complete dataset. They may occur due to error in data entry , variability in the dataset and measurement errors. Availability of outliers in the dataset can cause various problems like misinterpretation of the accurate data analysis , create misleading relationship between variables which can decrease the modelling performance and generalization.
There are various methods to find out outliers in your dataset.
By visualization of the data
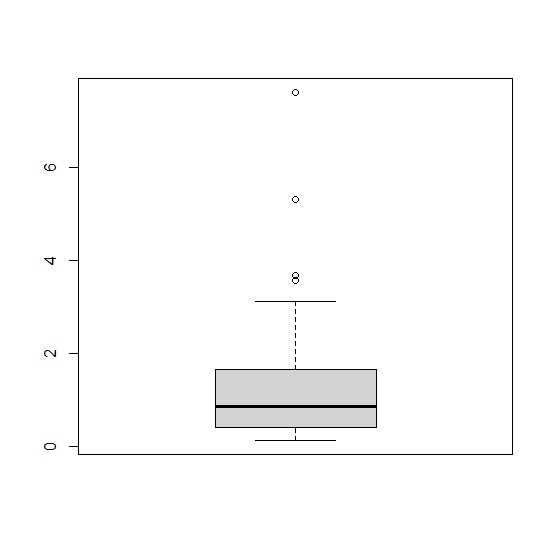
You can use boxplots and scatterplots to find out the outliers which are far away from the cluster of data points
By Z-square and IQR method( Inter Quartile range)
These two methods are statistical methods of finding out the outliers.
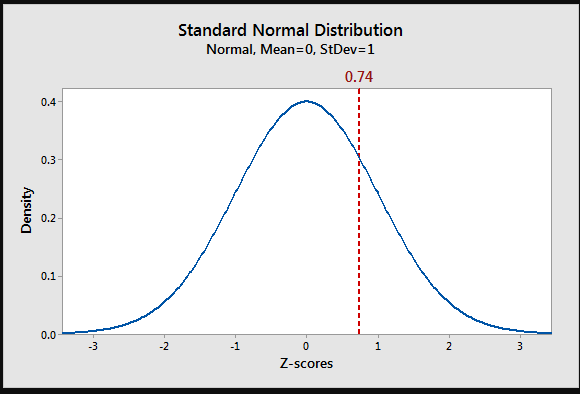
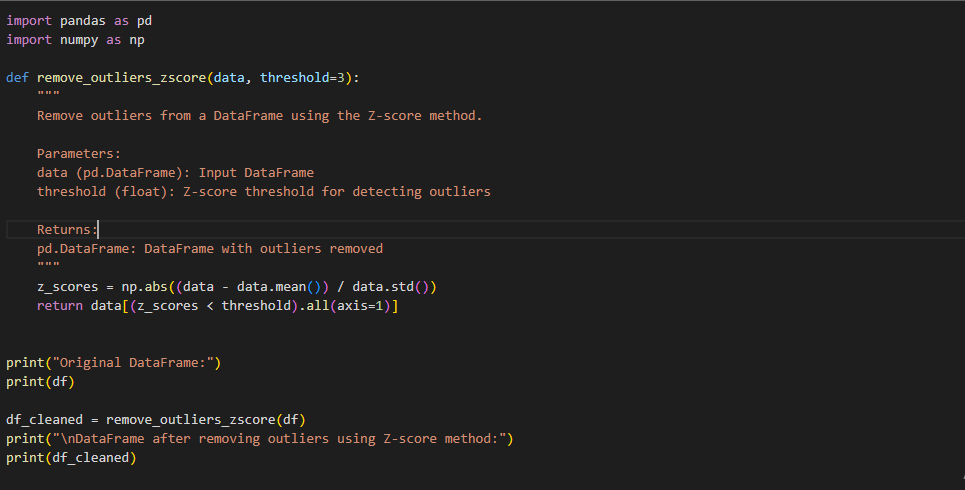
In Z-square method : A data point with a Z-score greater than 3 or less than -3 is often considered an outlier.
z-score = (data - mean) / standard deviation
Remove outliers from the dataset using z-score.
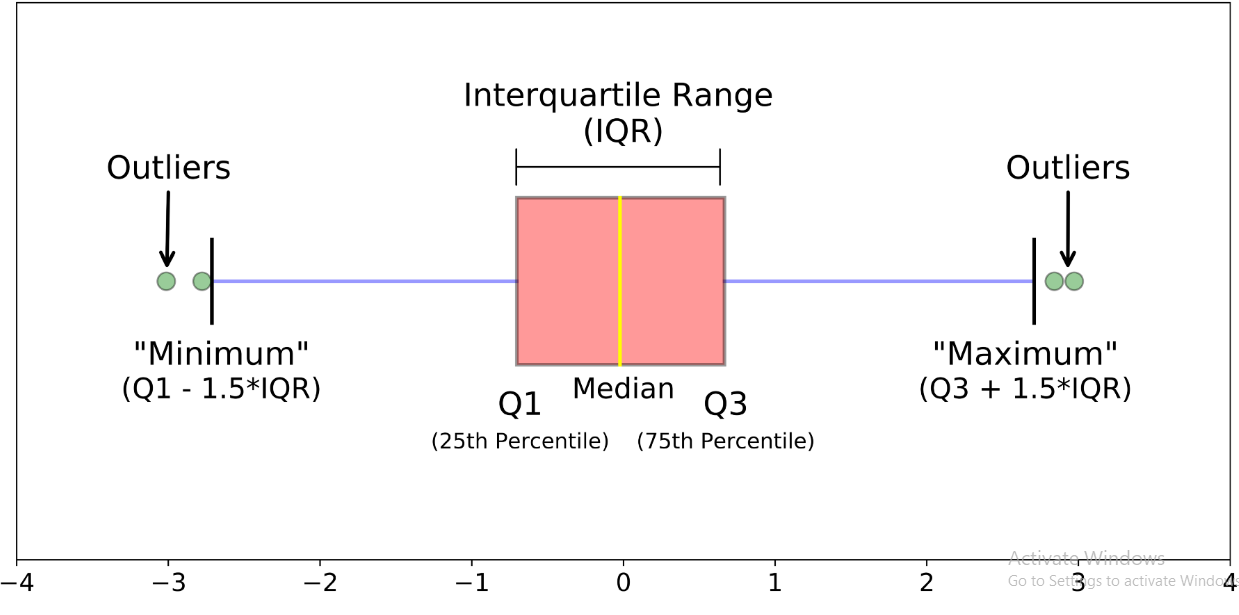
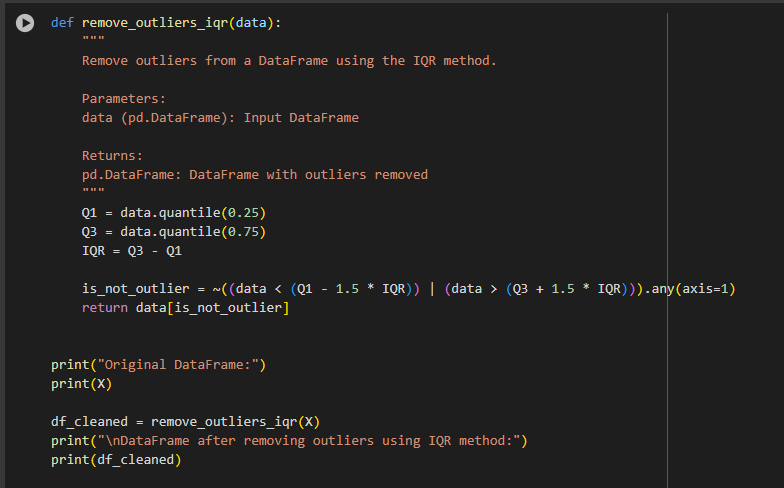
In IQR method: Points outside Q1−1.5×IQR or Q3+1.5×IQR are considered outliers.
FormuIa: QR = Q3 - Q1
To find the IQR, we first need to find the median (middle value) of the lower and upper half of the data. This is the second quartile (Q2).
The first quartile (Q1) is the value below which 25% of the data falls.
The third quartile (Q3) is the value above which 75% of the data falls.
Remove outliers from the dataset using IQR.
Conclusion
Detecting and removing outliers is a crucial step in data preprocessing to ensure the accuracy and reliability of your analysis. Outliers can distort statistical analyses and lead to misleading conclusions. By employing visualization techniques like boxplots and scatterplots, and statistical methods such as the Z-score and Interquartile Range (IQR), you can effectively identify and handle these anomalies. Removing outliers helps in improving the performance and generalization of your models, leading to more robust and trustworthy results. Always remember to carefully consider the context and potential reasons for outliers before deciding to remove them, as they might carry significant information about your data.
Subscribe to my newsletter
Read articles from Meemansha Priyadarshini directly inside your inbox. Subscribe to the newsletter, and don't miss out.
Written by

Meemansha Priyadarshini
Meemansha Priyadarshini
I am a passionate technical writer with a strong foundation in programming, machine learning, and deep learning. My background in innovation engineering and my expertise in advanced AI technologies make me adept at explaining complex technical concepts in a clear and engaging manner. I have a keen eye for detail, strong research skills, and a commitment to producing high-quality content.
