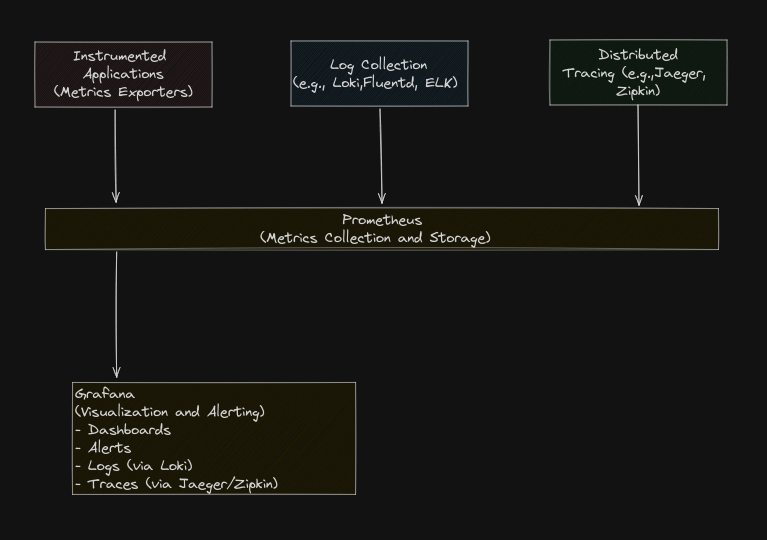
APM with Prometheus and Grafana
 San Ti
So now, let me share and explore the APM with Prometheus and Grafana setup.
What is APM?
Application Performance Management (APM) involves monitoring and managing the performance and availability of software applications. The main goals of APM are to detect and diagnose application performance issues, ensure a good user experience, and maintain the desired level of service.
Key Components of APM:
End-User Experience Monitoring (EUM):
Monitors performance from the user's perspective.
Tracks response times, error rates, and transaction times.
Application Topology Discovery:
Maps the architecture and dependencies of the application.
Helps understand interactions between different components.
Transaction Tracing:
Tracks individual transactions across various components.
Identifies bottlenecks and performance issues in specific transactions.
Component Monitoring:
Monitors the performance of individual components like databases, servers, and microservices.
Provides insights into resource utilization and performance metrics.
Analytics and Reporting:
Analyzes performance data to provide actionable insights.
Generates reports and dashboards for different stakeholders.

Sample Lab Setup
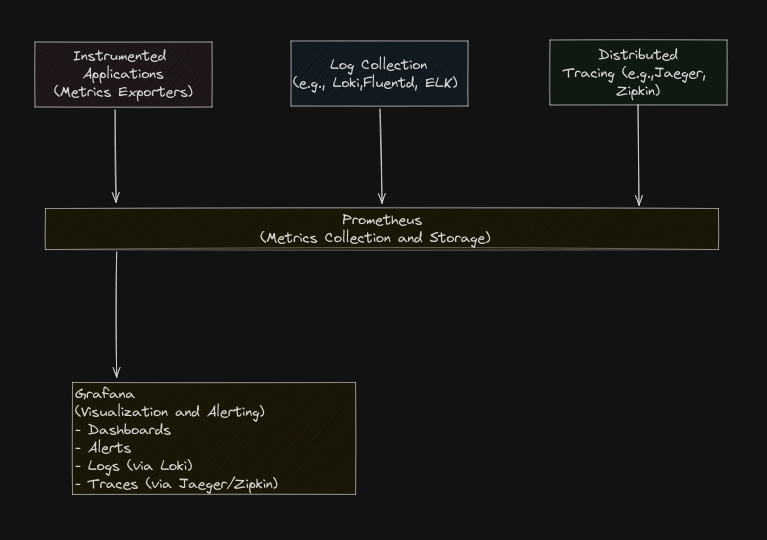
Let's set up a basic APM solution using Prometheus and Grafana, with a sample application instrumented for metrics and logs.
Step 1: Set Up Prometheus
Download and Install Prometheus:
 wget https://github.com/prometheus/prometheus/releases/download/v2.30.3/prometheus-2.30.3.linux-amd64.tar.gz
 tar -xvf prometheus-2.30.3.linux-amd64.tar.gz
 cd prometheus-2.30.3.linux-amd64
Configure Prometheus (
prometheus.yml):global: scrape_interval: 15s scrape_configs: - job_name: 'prometheus' static_configs: - targets: ['localhost:9090'] - job_name: 'app' static_configs: - targets: ['localhost:8000']Start Prometheus:
./prometheus --config.file=prometheus.yml
Step 2: Set Up Grafana
Download and Install Grafana:
 wget https://dl.grafana.com/oss/release/grafana-8.2.5.linux-amd64.tar.gz
 tar -zxvf grafana-8.2.5.linux-amd64.tar.gz
 cd grafana-8.2.5
 ./bin/grafana-server
Configure Grafana:
Open Grafana at
http://localhost:3000and log in (default username/password isadmin/admin).Add Prometheus as a data source:
Navigate to Configuration > Data Sources > Add data source.
Select Prometheus and set the URL to
http://localhost:9090.
Step 3: Instrument Application for Metrics and Logs
Sample Application in Python (using
prometheus_clientfor metrics):from flask import Flask from prometheus_client import start_http_server, Summary, Counter app = Flask(__name__) # Create a metric to track time spent and requests made. REQUEST_TIME = Summary('request_processing_seconds', 'Time spent processing request') REQUEST_COUNT = Counter('request_count', 'Total request count') @app.route('/') @REQUEST_TIME.time() def hello(): REQUEST_COUNT.inc() return "Hello, World!" if __name__ == '__main__': # Start up the server to expose the metrics. start_http_server(8000) # Start the Flask app. app.run(port=8000)Set Up Promtail for Log Aggregation:
 wget https://github.com/grafana/loki/releases/download/v2.2.1/promtail-linux-amd64.zip
 unzip promtail-linux-amd64.zip
 chmod a+x promtail-linux-amd64
Configure Promtail (promtail-config.yml):
server:
  http_listen_port: 9080
  grpc_listen_port: 0

positions:
  filename: /tmp/positions.yaml

clients:
  - url: http://localhost:3100/loki/api/v1/push

scrape_configs:
  - job_name: system
    static_configs:
      - targets:
          - localhost
        labels:
          job: varlogs
          __path__: /var/log/*.log
Start Promtail:
./promtail-linux-amd64 -config.file=promtail-config.yml
Step 4: Set Up Loki for Log Aggregation
Download and Install Loki:
 wget https://github.com/grafana/loki/releases/download/v2.2.1/loki-linux-amd64.zip
 unzip loki-linux-amd64.zip
 chmod a+x loki-linux-amd64
 ./loki-linux-amd64 -config.file=loki-config.yml
Configure Loki (
loki-config.yml):auth_enabled: false server: http_listen_port: 3100 ingester: lifecycler: address: 127.0.0.1 ring: kvstore: store: inmemory final_sleep: 0s chunk_idle_period: 5m chunk_retain_period: 30s max_transfer_retries: 0 schema_config: configs: - from: 2020-10-24 store: boltdb-shipper object_store: filesystem schema: v11 index: prefix: index_ period: 168h storage_config: boltdb_shipper: active_index_directory: /tmp/loki/boltdb-shipper-active cache_location: /tmp/loki/boltdb-shipper-cache cache_ttl: 24h shared_store: filesystem filesystem: directory: /tmp/loki/chunks limits_config: enforce_metric_name: false reject_old_samples: true reject_old_samples_max_age: 168h chunk_store_config: max_look_back_period: 0s table_manager: retention_deletes_enabled: false retention_period: 0s
Step 5: Integrate Logs in Grafana
Add Loki as a Data Source in Grafana:
Navigate to Configuration > Data Sources > Add data source.
Select Loki and set the URL to
http://localhost:3100.
Create Dashboards:
Create a new dashboard to visualize metrics from Prometheus.
Add panels for different metrics (e.g., request count, request processing time).
Create a new dashboard to visualize logs from Loki.
Add panels for logs and use queries to filter and display relevant log entries.
Example Queries:
Prometheus Metrics (PromQL):
Total request count:
sum(request_count)Request processing time:
rate(request_processing_seconds_sum[5m]) / rate(request_processing_seconds_count[5m])
Loki Logs (LogQL):
All logs:
{job="varlogs"}Filtered logs:
{job="varlogs"} |= "ERROR"
By following these steps, you can set up a monitoring solution with Prometheus and Grafana that includes both application metrics and logs, providing a comprehensive APM setup.
#ITSec-Tech
#Thanksyouall
Subscribe to my newsletter
Read articles from San Ti directly inside your inbox. Subscribe to the newsletter, and don't miss out.
Written by

San Ti
San Ti
Knowledgeable Leadership and Cloud Base technical systems professional offers problem-solving skills and best practices expertise. Thorough with assessments, solution development and deployments. Accomplished in partnering cross-functionally to enhance systems for changing demands.