Understanding Power BI Basics
 sravani punreddy
What is Power BI?

Power BI is a suite of business analytics tools that allows you to visualize your data and share insights across your organization or embed them in an app or website. It connects to hundreds of data sources, simplifies data preparation, and drives ad hoc analysis. With Power BI, you can create personalized dashboards and interactive reports to gain actionable insights.
Parts of Power BI
Power BI consists of several integral parts, each serving a unique purpose:
Power BI Desktop: A Windows application used for creating reports and data models. It provides a comprehensive environment for transforming, analyzing, and visualizing data.
Power BI Service: An online service for sharing, collaborating on, and viewing reports and dashboards. It enables you to publish reports created in Power BI Desktop and share them with your team.
Power BI Mobile Apps: Mobile applications for iOS, Android, and Windows devices that allow you to access and interact with your reports and dashboards from anywhere.
Power BI Report Server: An on-premises server that enables you to host and manage Power BI reports behind your firewall, offering greater control over your data.
Power BI Concepts
Understanding the core concepts of Power BI will enhance your ability to work with the tool effectively:
Capacities: Capacities represent a set of resources used to host and deliver Power BI content. They can be shared or dedicated. Dedicated capacities are reserved exclusively for your organization, ensuring reliable performance.
Workspaces: Workspaces are collaborative spaces within the Power BI Service where you can create, share, and manage content like reports and dashboards.
Datasets: Datasets are collections of data that you import or connect to in Power BI. They can come from various sources such as Excel, SQL databases, or cloud services.
Shared Datasets: These are datasets that can be used across multiple reports, promoting consistency and reusability.
Reports: Reports are multi-page documents that display your data using various visualizations such as charts and graphs.
Dashboards: Dashboards are single-page collections of visualizations and metrics, providing a high-level view of your data.
Template Apps
- Template apps are pre-built Power BI solutions designed for specific industries or data sources. They provide ready-to-use reports and dashboards, enabling you to quickly connect to your data and gain insights without starting from scratch.
Data Modeling and Visualization

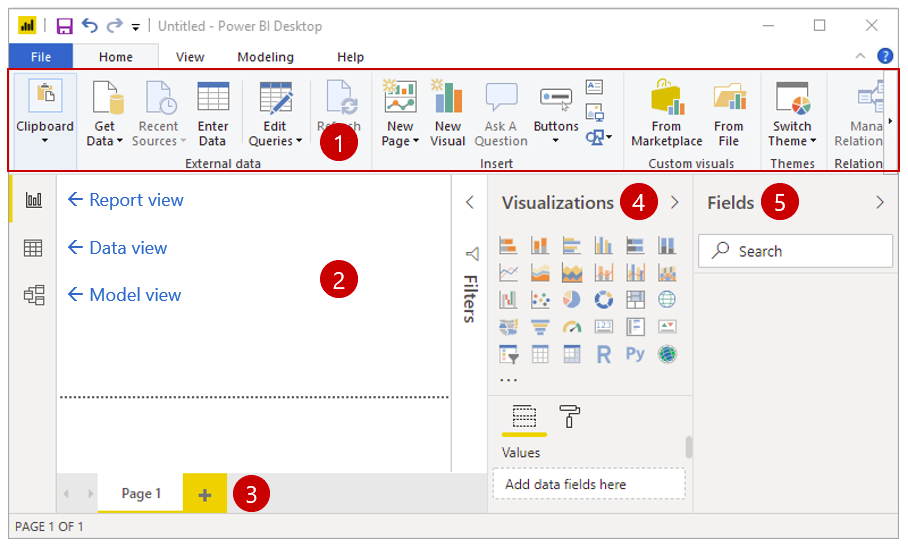
Ribbon
Report view or canvas
Pages tab
Visualizations pane
Field Pane
Creating effective reports in Power BI involves data modeling and visualization. Here are some key components:
Report View: The primary area in Power BI Desktop where you design your reports.
Canvas: The blank area in the Report View where you place and arrange visualizations.
Page Tab: Tabs at the bottom of the Report View for navigating between different report pages.
Visualizations Pane: Contains various types of visualizations you can add to the canvas.
Fields Pane: Displays the data fields from your dataset that you can drag to the canvas to create visualizations.
Filtering Data in Power BI
Filtering is crucial for focusing on specific aspects of your data. Power BI offers four types of filters:
Report Filters: Apply to the entire report.
Page Filters: Apply to a single page within the report.
Visual Filters: Apply to individual visualizations.
Build Filters: Used during report creation to refine the data included in visualizations.
Transforming Data with Query Editor
The Query Editor in Power BI Desktop is a powerful tool for transforming and cleaning your data:
Transform Data: Use the Query Editor to shape and transform your data before it’s used in reports.
Clean Columnar Data: Clean and prepare your data by removing duplicates, splitting columns, and applying other transformations.
Security and Administration
Power BI provides robust security and administration features to ensure your data is protected and properly managed:
Row-Level Security (RLS): Restricts data access for users based on their role.
Data Governance: Tools for managing and auditing data usage across your organization.
Conclusion
Power BI is an indispensable tool for transforming raw data into meaningful insights. By understanding its key components and concepts, you can start leveraging Power BI to make data-driven decisions. From creating datasets and reports to sharing dashboards and applying filters, Power BI offers a comprehensive platform for business intelligence. Start your Power BI journey today and unlock the full potential of your data!
- By following this guide, you'll have a solid foundation to start using Power BI effectively. Dive in, explore its features, and start creating your own reports and dashboards to harness the power of your data.
Subscribe to my newsletter
Read articles from sravani punreddy directly inside your inbox. Subscribe to the newsletter, and don't miss out.
Written by
