Technical Report: First Glance Analysis of Titanic Dataset
 Shamso Osman
Introduction
This report presents an initial analysis of the Titanic dataset, which contains information about passengers aboard the RMS Titanic from the Kaggle Dataset. The purpose of this review is to identify immediate insights from the data. This analysis is part of a data analysis internship program, HNG Internship, which provides hands-on experience in various tech fields.
The dataset typically includes variables such as:
passenger class
sex
age
number of siblings/spouses aboard
number of parents/children aboard
ticket fare
survival status
Observations
Upon first glance at the Titanic dataset, several key insights emerge:
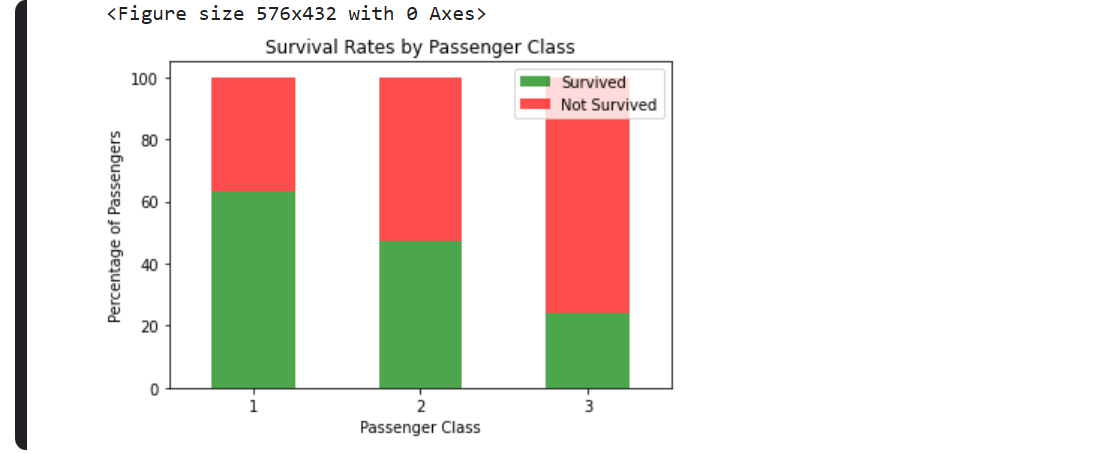
Survival Rate and Passenger Class There appears to be a correlation between passenger class and survival rate. First-class passengers seem to have a higher survival rate compared to those in second and third class. This could be due to factors such as proximity to lifeboats or preferential treatment during evacuation. Initial visualization shows that the number of non-survivors is higher than the number of survivors.
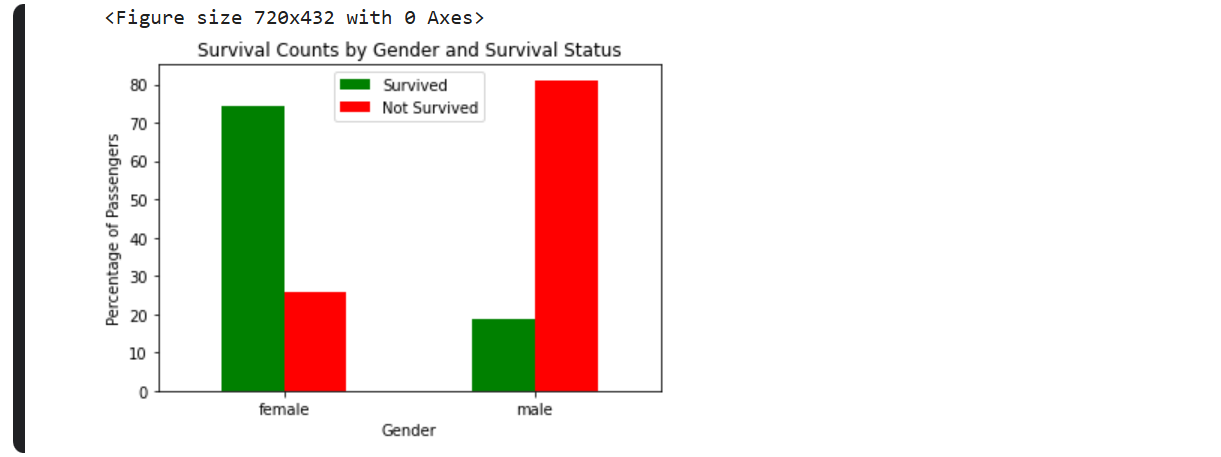
Gender and Survival A notable pattern emerges regarding gender and survival. Women appear to have a significantly higher survival rate compared to men. This observation aligns with the "women and children first" protocol that was reportedly followed during the disaster.
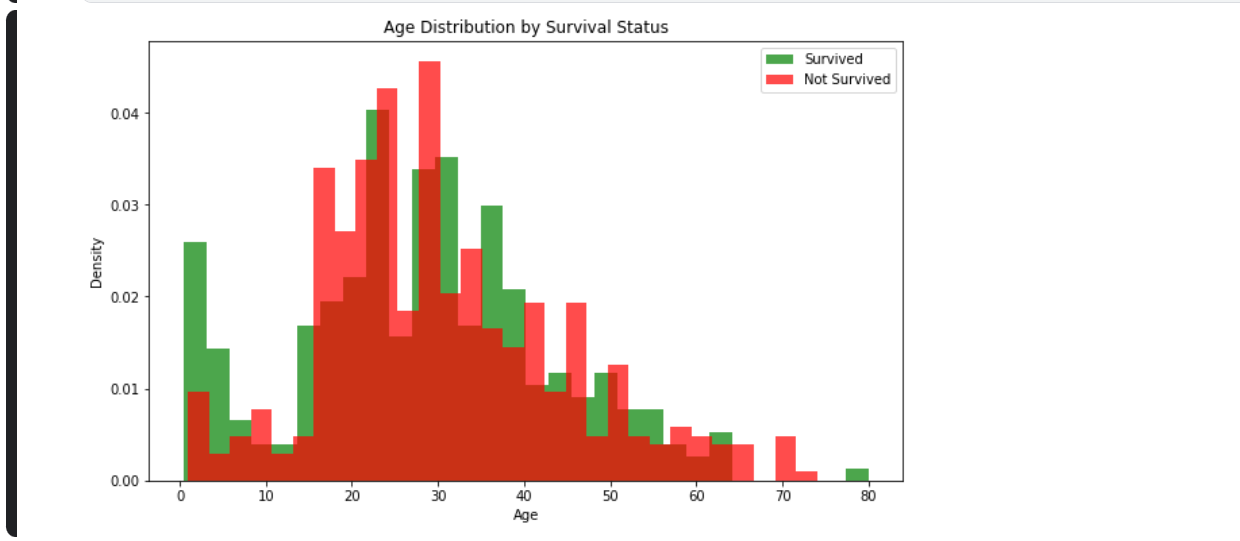
Age Distribution The age distribution of passengers seems to be skewed towards adults, with fewer children and elderly passengers. There might be a relationship between age and survival rate, with children potentially having a higher chance of survival.
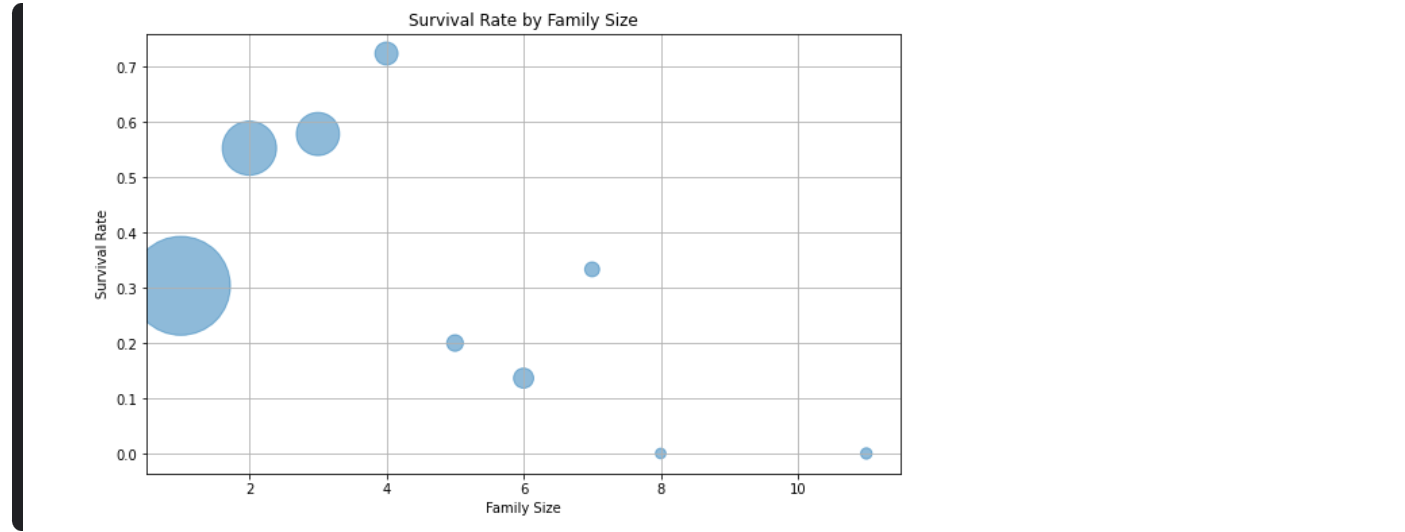
Family Size and Survival Passengers traveling with family members (indicated by the siblings/spouses and parents/children variables) show different survival patterns compared to those traveling alone. This could suggest that family groups were either prioritized or better able to assist each other during the evacuation.
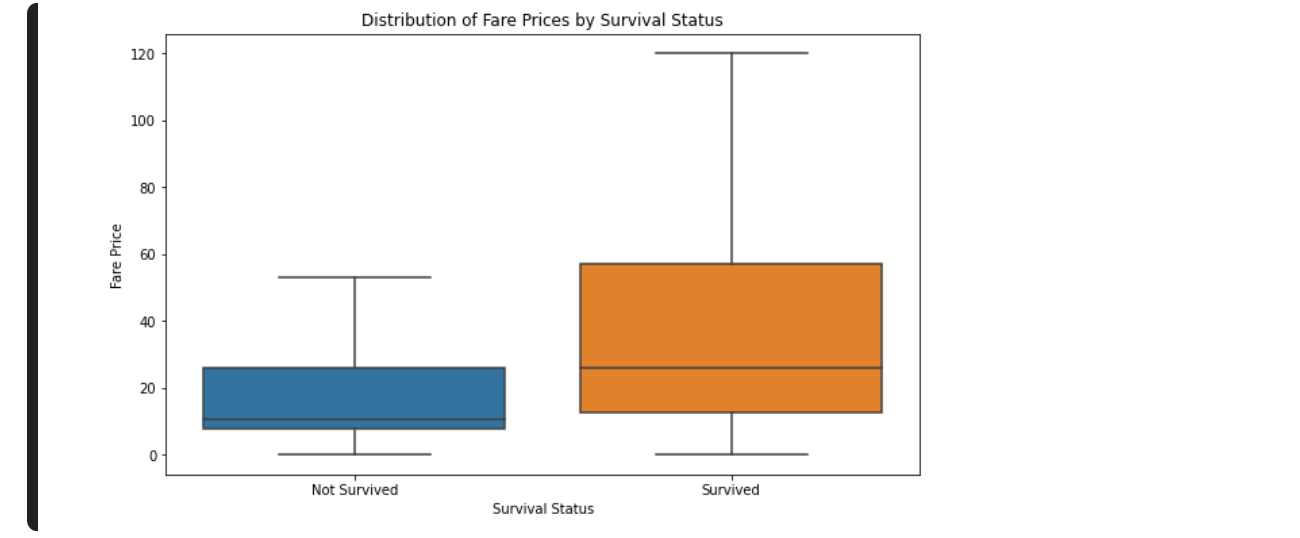
Fare and Survival There seems to be a positive correlation between ticket fare and survival rate. This could be related to the passenger class observation, as higher fares typically correspond to better accommodations and possibly increased access to lifeboats.
Conclusion
In conclusion, the initial analysis of the Titanic dataset reveals significant patterns and correlations that provide a deeper understanding of the factors influencing passenger survival. The data highlights the impact of passenger class, gender, age, family size, and fare on survival rates. Further areas of investigation may include exploring data related to cabin and its impact on survival rates.
For those interested in developing these data visualization skills, programs like the HNG Internship and HNG Premium offer hands-on experience with real-world datasets and industry-standard tools.
Subscribe to my newsletter
Read articles from Shamso Osman directly inside your inbox. Subscribe to the newsletter, and don't miss out.
Written by

Shamso Osman
Shamso Osman
Aspiring fullstack developer. Currently studying frontend development. Enthusiastic about open source and making projects.