Centralizing Log Collection for webMethods IS with Grafana Loki
 TECHcommunity_SAG
Introduction
Observability is now a critical component of modern industry. In this article, we will delve into a crucial aspect of observability: the aggregation of webMethods Integration Server logs into a unified logging system using Loki and visualizing them in real-time with Grafana dashboards for monitoring and analysis. We will employ Promtail for log capturing.
Architecture
In the architecture diagram below, there are three webMethods Integration Server deployments. Each deployment incorporates a Promtail instance, which serves as a log collecting agent, running as a sidecar within the same pod as the Integration Server container. These Promtail instances collect logs from their respective Integration Server deployments. Subsequently, the collected logs are then forwarded to Loki, a log aggregation system. In the Grafana dashboard, Loki is configured as a data source, enabling further analysis of the logs.
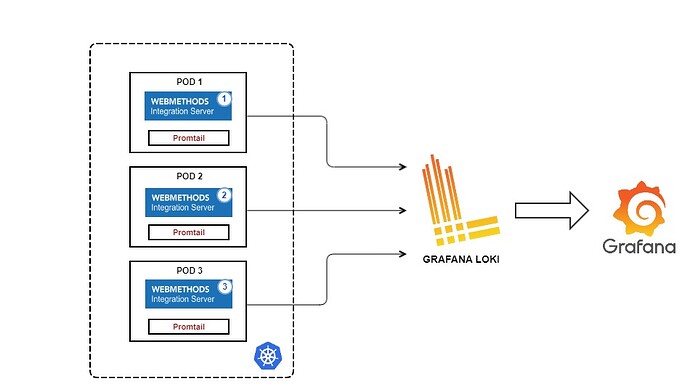
Steps to Collect Logs from webMethods Integration Servers Running in a Kubernetes Environment
We will use Helm charts to deploy all the components—Grafana Loki, Grafana, Prometheus, and webMethods Integration Server—in a Kubernetes cluster. This deployment can be accomplished in two steps:
- Install the loki-Stack
- Create helm chart for IS with promtail running as a sidecar
Install Loki-Stack
Add the helm-chart repo. The Loki-Stack Helm Chart is a package that allows you to deploy Grafana Loki, along with its dependencies, using Helm, which is a package manager for Kubernetes.
helm repo add grafana https://grafana.github.io/helm-charts
helm repo update
By default, Grafana is disabled. To enable Grafana, edit the configuration file. You will also see configurations for Fluentd, Prometheus, and other components. Modify the file according to your requirements. An example of
loki-stack-values.yamlis shown below.helm show values grafana/loki-stack > loki-stack-values.yamlloki: enabled: true isDefault: true url: http://{{(include "loki.serviceName" .)}}:{{ .Values.loki.service.port }} readinessProbe: httpGet: path: /ready port: http-metrics initialDelaySeconds: 45 livenessProbe: httpGet: path: /ready port: http-metrics initialDelaySeconds: 45 datasource: jsonData: "{}" uid: "" promtail: enabled: true config: logLevel: info serverPort: 3101 clients: - url: http://{{ .Release.Name }}:3100/loki/api/v1/push grafana: enabled: true sidecar: datasources: label: "" labelValue: "" enabled: true maxLines: 1000 image: tag: 10.3.3Create a namespace and install the loki-stack in it.
kubectl create namespace <namespace name>
helm install loki-stack grafana/loki-stack --namespace <namespace> -f <stack-value>.yaml
To log in to Grafana, you need to port-forward the Grafana port to access the Grafana dashboard from your localhost and retrieve the password from the secret. Follow the steps below:
# Port forward grafana :
kubectl -n <namespace> port-forward service/loki-stack-grafana 3000:80
# Get the password from the secret to login to grafana dashboard
kubectl -n <namespace> get secret loki-stack-grafana -o yaml
echo "<replace this with base64 encoded value from the above command>" | base64 -d
Create a Helm chart for the Integration Server (IS) with Promtail running as a sidecar.
Now that the loki-stack in configured, its time to create a helm-chart for Integration Server.
helm create is-chartCreate a
deployment.yamlfile with the Integration Server (IS) and Promtail running as a sidecar. Here is an example of thedeployment.yamlfile. In this configuration, the Integration server is pulled from the Docker registrysoftwareag/webmethods-microservicesruntime:10.15.0.10-slimand mounts the IS logs folder/opt/softwareag/IntegrationServer/logs, allowing Promtail to collect logs from IS. With-config.expand-env=trueenabled, Promtail dynamically replaces${POD_NAME}with the actual value of thePOD_NAME, enabling dynamic configuration when there are multiple IS deployments.apiVersion: apps/v1 kind: Deployment metadata: name: is-deployment spec: replicas: 1 selector: matchLabels: app: is template: metadata: labels: app: is spec: containers: - name: is-container image: softwareag/webmethods-microservicesruntime:10.15.0.10-slim imagePullPolicy: Always ports: - containerPort: 5555 - containerPort: 8091 securityContext: runAsUser: 0 # Running as root volumeMounts: - name: is-logs mountPath: /opt/softwareag/IntegrationServer/logs # Sidecar container for Promtail - name: promtail image: grafana/promtail:2.9.3 args: - -config.file=/etc/promtail/promtail-config.yaml - -client.url=http://loki-stack:3100/loki/api/v1/push - -config.expand-env=true env: - name: POD_NAME value: "is-one" volumeMounts: - name: is-logs mountPath: /opt/softwareag/IntegrationServer/logs - name: config-volume mountPath: /etc/promtail readOnly: true securityContext: runAsUser: 0 # Running as root volumes: - name: is-logs emptyDir: {} - name: config-volume configMap: name: promtail-configIf you have multiple applications, you can create another deployment based on the above example. For instance, below is the second deployment YAML for the second Integration server with Promtail running as a sidecar.
apiVersion: apps/v1
kind: Deployment
metadata:
  name: is-deployment-two
spec:
  replicas: 1
  selector:
    matchLabels:
      app: is-two
  template:
    metadata:
      labels:
        app: is-two
    spec:
      containers:
        - name: is-container-two
          image: softwareag/webmethods-microservicesruntime:10.15.0.10-slim
          imagePullPolicy: Always
          ports:
            - containerPort: 5555
            - containerPort: 8091
          securityContext:
            runAsUser: 0  # Running as root
          volumeMounts:
            - name: is-logs-two
              mountPath: /opt/softwareag/IntegrationServer/logs
        # Sidecar container for Promtail
        - name: promtail-two
          image: grafana/promtail:2.9.3
          args:
            - -config.file=/etc/promtail/promtail-config.yaml
            - -client.url=http://loki-stack:3100/loki/api/v1/push
            - -config.expand-env=true
          env:
            - name: POD_NAME
              value: "is-two"
          volumeMounts:
            - name: is-logs-two
              mountPath: /opt/softwareag/IntegrationServer/logs
            - name: config-volume
              mountPath: /etc/promtail
              readOnly: true
          securityContext:
            runAsUser: 0  # Running as root
      volumes:
        - name: is-logs-two
          emptyDir: {}
        - name: config-volume
          configMap:
            name: promtail-config
Create a ConfigMap for
promtail-config.yaml. In the following configuration map, we collect bothserver.logandWMERROR.logfrom the Integration Servers. If there are multiple deployments of Integration Servers, thepod: ${POD_NAME}dynamically retrieves the value of the Integration server as defined in thedeployment.yamlfile above.apiVersion: v1 kind: ConfigMap metadata: name: promtail-config data: promtail-config.yaml: | scrape_configs: - job_name: islog static_configs: - targets: - localhost labels: job: serverlog pod: ${POD_NAME} __path__: /opt/softwareag/IntegrationServer/logs/server.log - targets: - localhost labels: job: errorlog pod: ${POD_NAME} __path__: /opt/softwareag/IntegrationServer/logs/WMERROR*.logCreate a helm package and install the above deployment. Additionally, verify that all pods are running healthily.
helm package .
helm install <install-name> .\is-chart-0.1.0.tgz -n <namespace>
kubectl get all -n <namespace>
To access the Grafana dashboard, log in and navigate to the “Explore” section. Here, you can execute queries based on the labels set in the Promtail configuration and view all your Integration Server (IS) deployment logs. You can filter logs by using the labels defined in the Promtail configuration. For instance, you can execute queries to filter logs based on “errorlog” or “serverlog” as defined in the above promtail-config.yaml file.
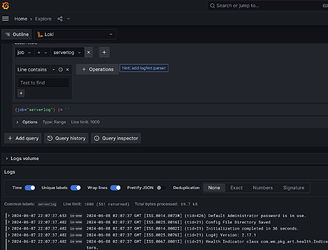
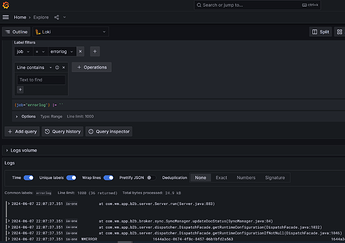
As we conclude, it’s crucial to recognize the significance of effective log management in troubleshooting and resolving issues within the webMethods Integration Server, particularly in complex customer environments. By using tools like Loki to organize and display logs, organizations can understand how their systems are working with webMethods Integration Servers. With a unified logging system in place, teams can promptly identify real-time events and expedite problem resolution, thereby enhancing the reliability and effectiveness of their systems.
Subscribe to my newsletter
Read articles from TECHcommunity_SAG directly inside your inbox. Subscribe to the newsletter, and don't miss out.
Written by

TECHcommunity_SAG
TECHcommunity_SAG
Discover, Share, and Collaborate with the Software AG Tech Community The Software AG Tech Community is your single best source for expert insights, getting the latest product updates, demos, trial downloads, documentation, code samples, videos and topical articles. But even more important, this community is tailored to meet your needs to improve productivity, accelerate development, solve problems, and achieve your goals. Join our dynamic group of users who rely on Software AG solutions every day, follow the link or you can even sign up and get access to Software AG's Developer Community. Thanks for stopping by, we hope to meet you soon.