AddGraph: A Simple yet Powerful JavaScript Graph Diagramming and Whiteboarding Tool
 friday
Introduction
In the modern landscape of software development and data analysis, graphical representation plays a crucial role. From system architecture design to data visualization and whiteboarding applications, graphical tools are indispensable. AddGraph is a JavaScript-based tool designed to cater to these needs by providing a simple yet powerful editor for general graph diagramming and whiteboarding applications. This blog delves into the features, functionalities, and potential applications of AddGraph, illustrating why it is an essential tool for developers, analysts, and designers.
Features of AddGraph
1. Ease of Use
One of the standout features of AddGraph is its simplicity. The tool is designed with user-friendliness in mind, making it accessible to users of all skill levels. Whether you are a seasoned developer or a novice designer, AddGraph’s intuitive interface allows you to create complex graph diagrams with ease. The drag-and-drop functionality, along with a comprehensive set of editing tools, ensures that creating and modifying diagrams is straightforward and efficient.

2. Local Storage of Graphic Data
AddGraph prioritizes user privacy and data security by storing all graphic data locally on the user’s computer. This approach not only ensures that sensitive information remains secure but also allows for faster access and manipulation of data. Users can work offline without worrying about connectivity issues or data breaches.
3. Import and Export Capabilities
Flexibility is key when working with graphical data, and AddGraph excels in this aspect. The tool allows users to import and export graphic data seamlessly. Whether you are transferring data between different projects or sharing your work with colleagues, AddGraph makes the process hassle-free. Additionally, the capability to export diagrams as SVG or JSON files enhances interoperability with other tools and platforms.
4. Data Visualization Tool
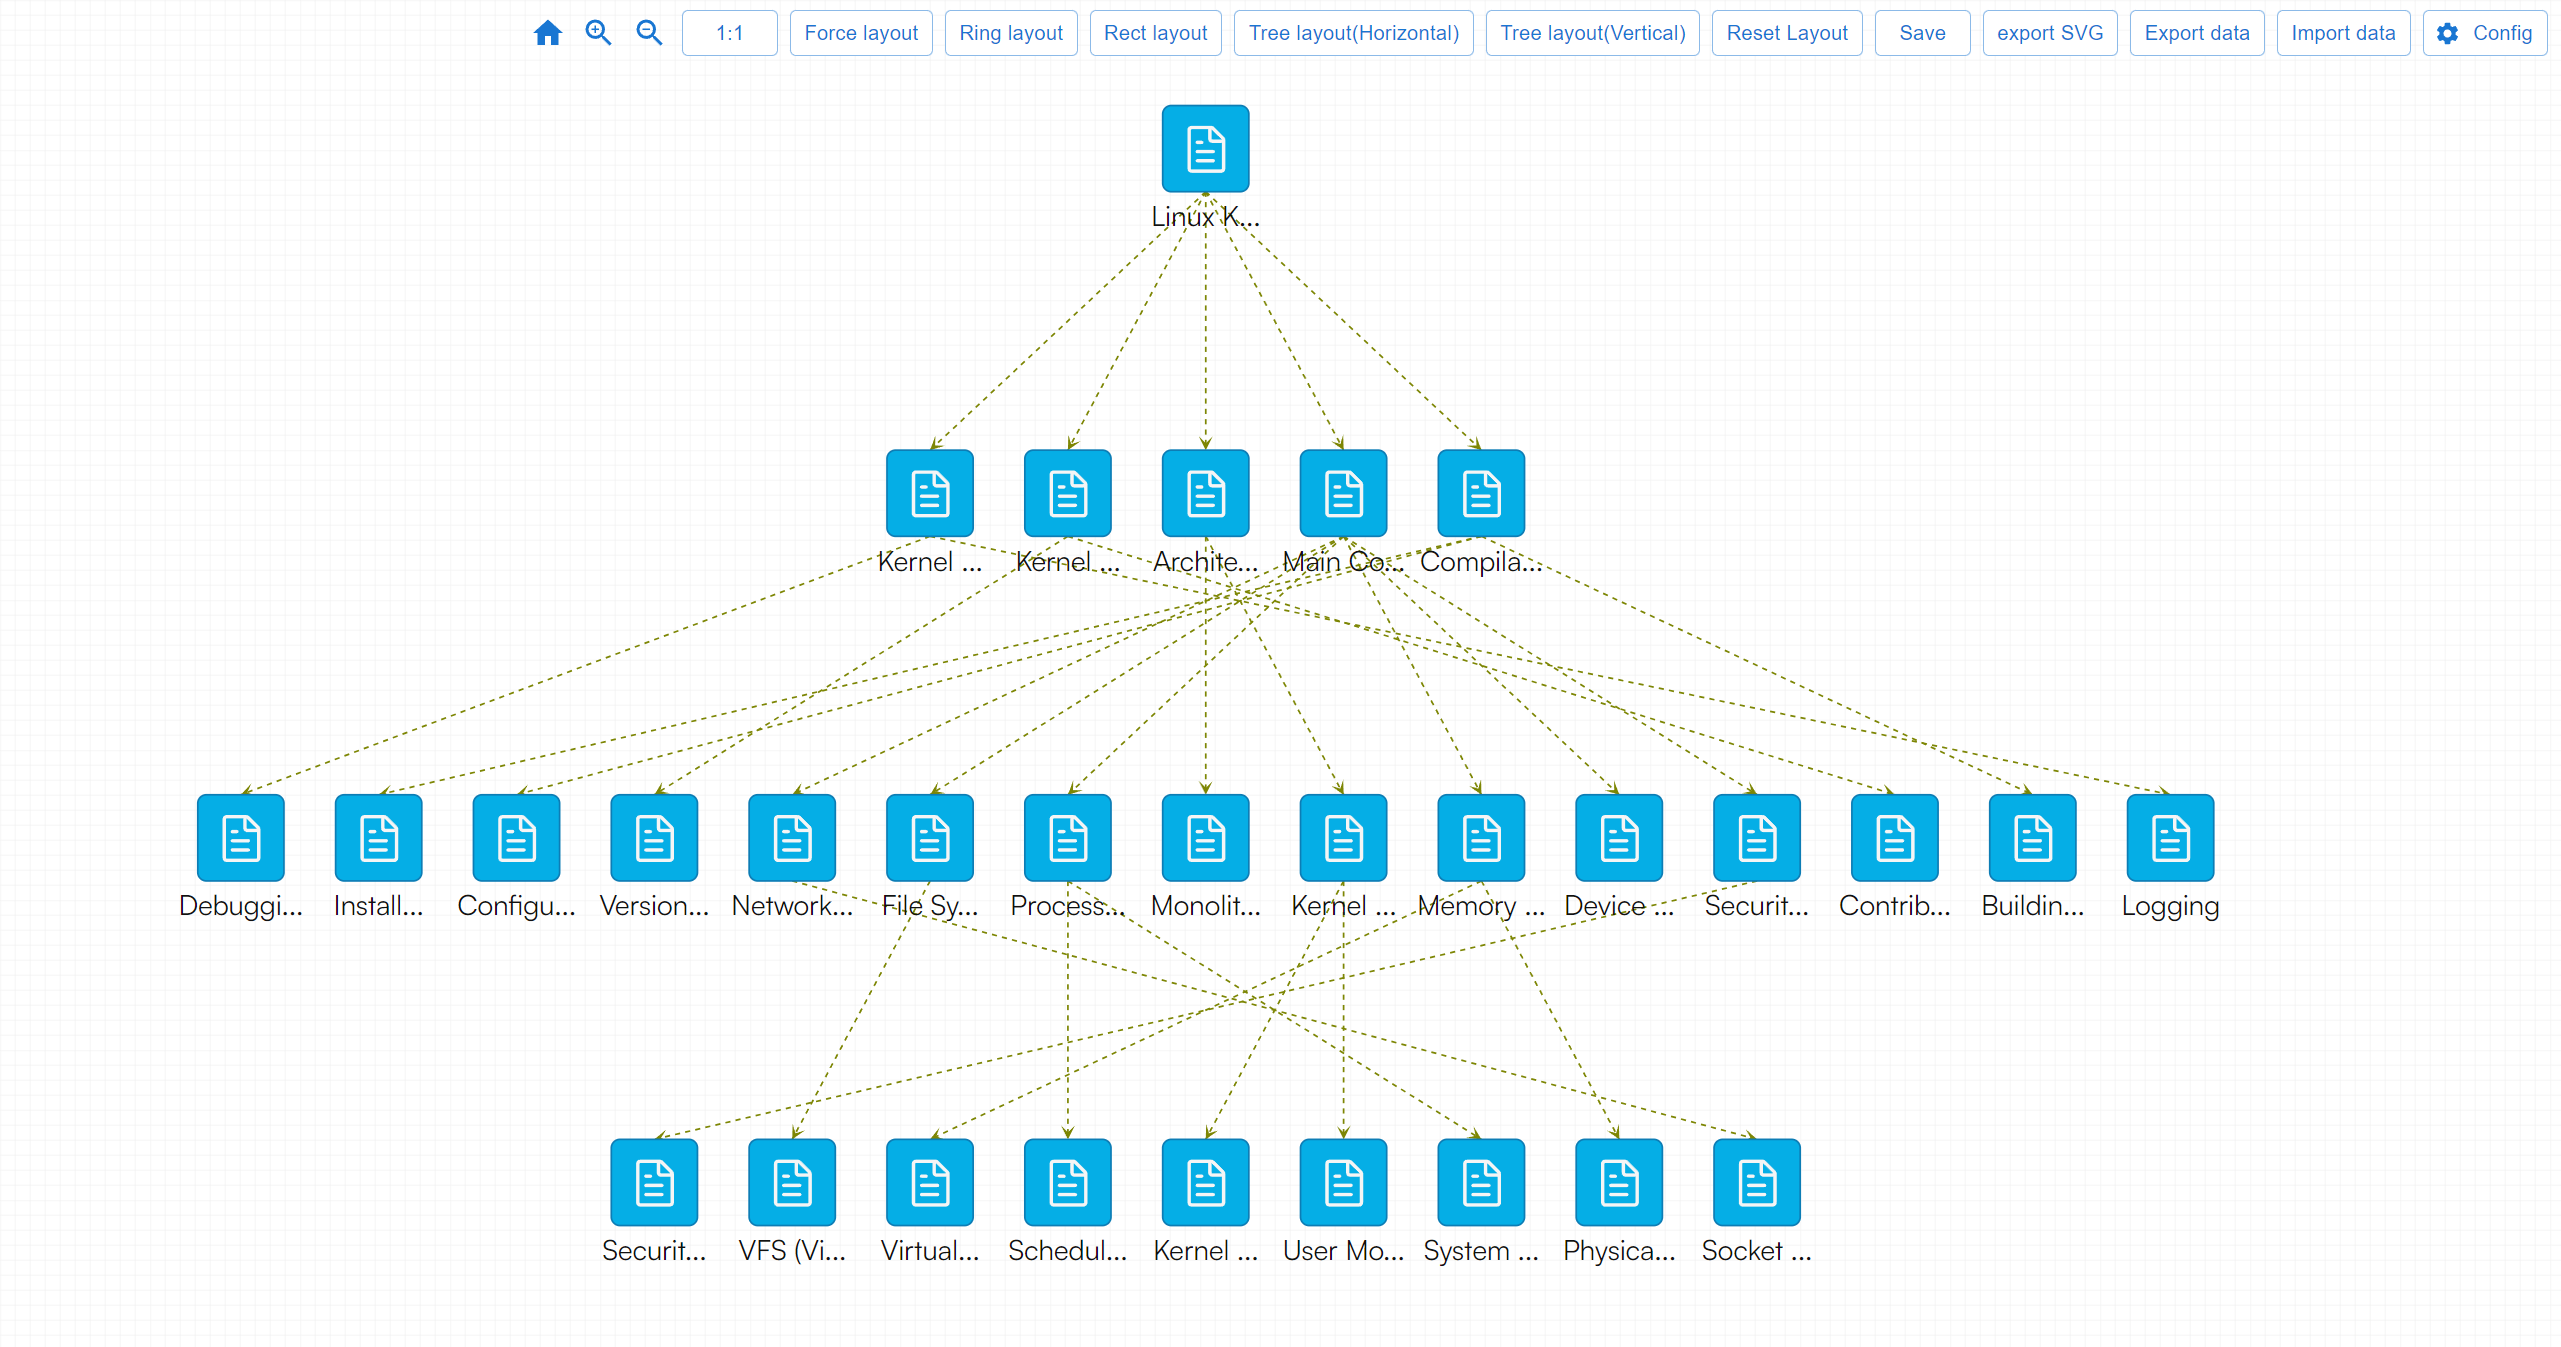
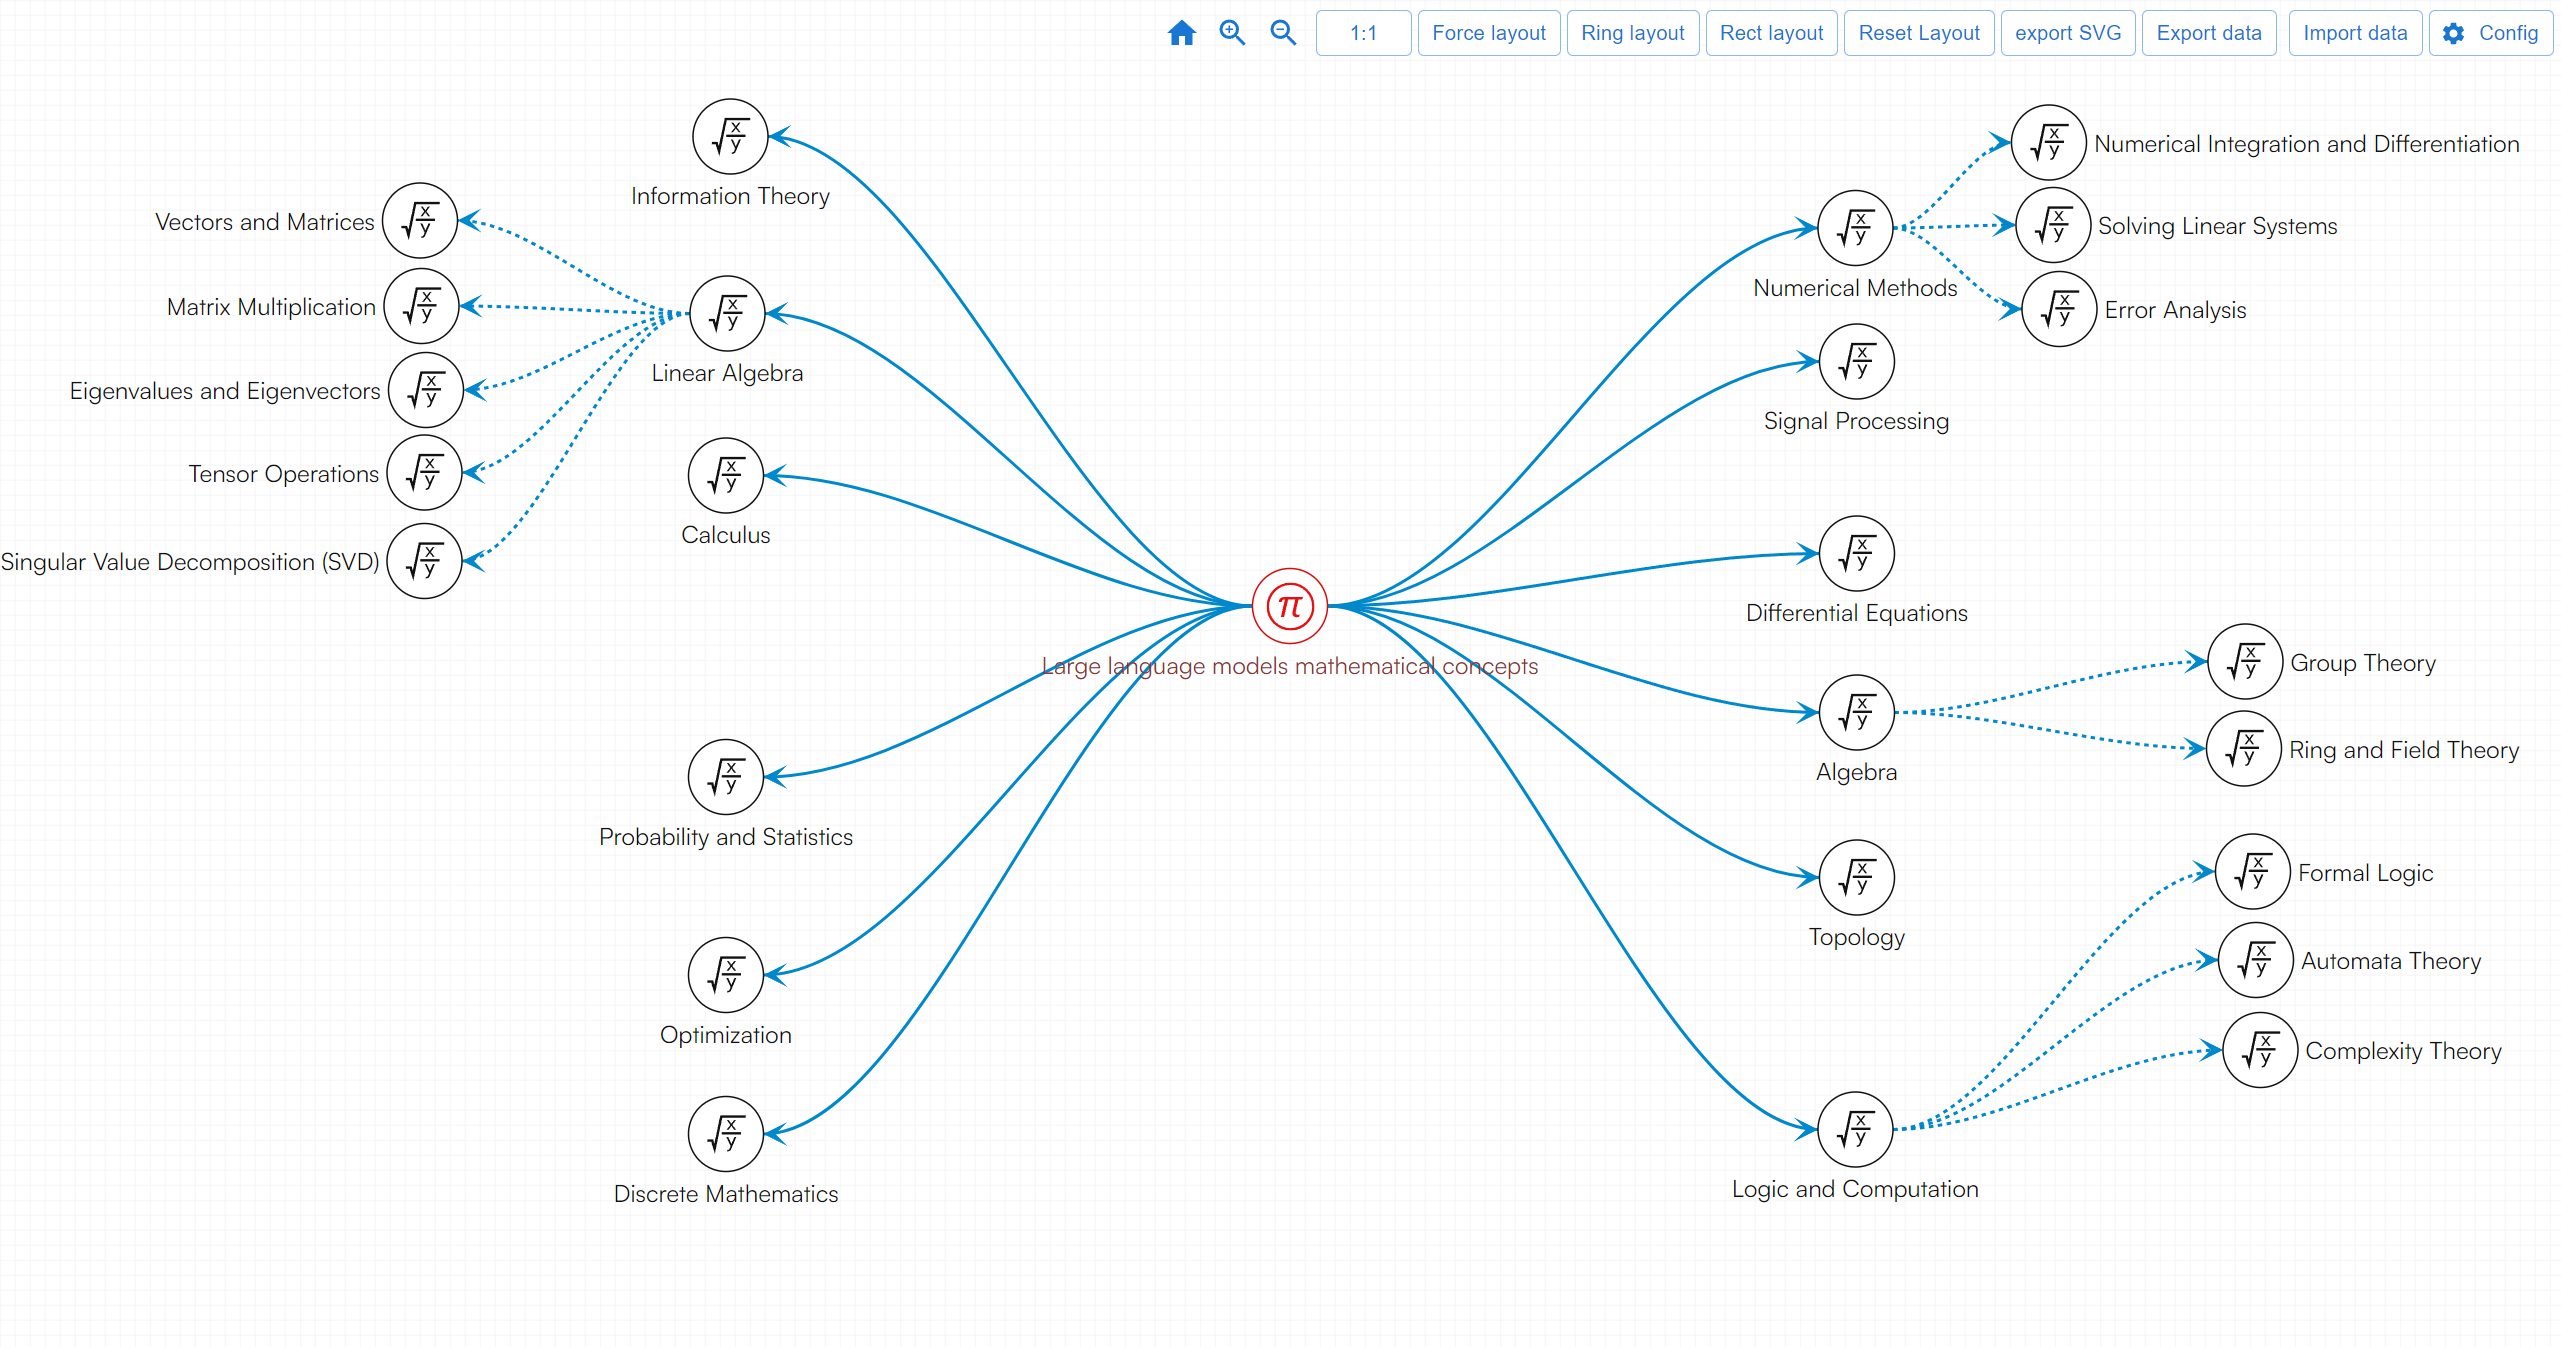
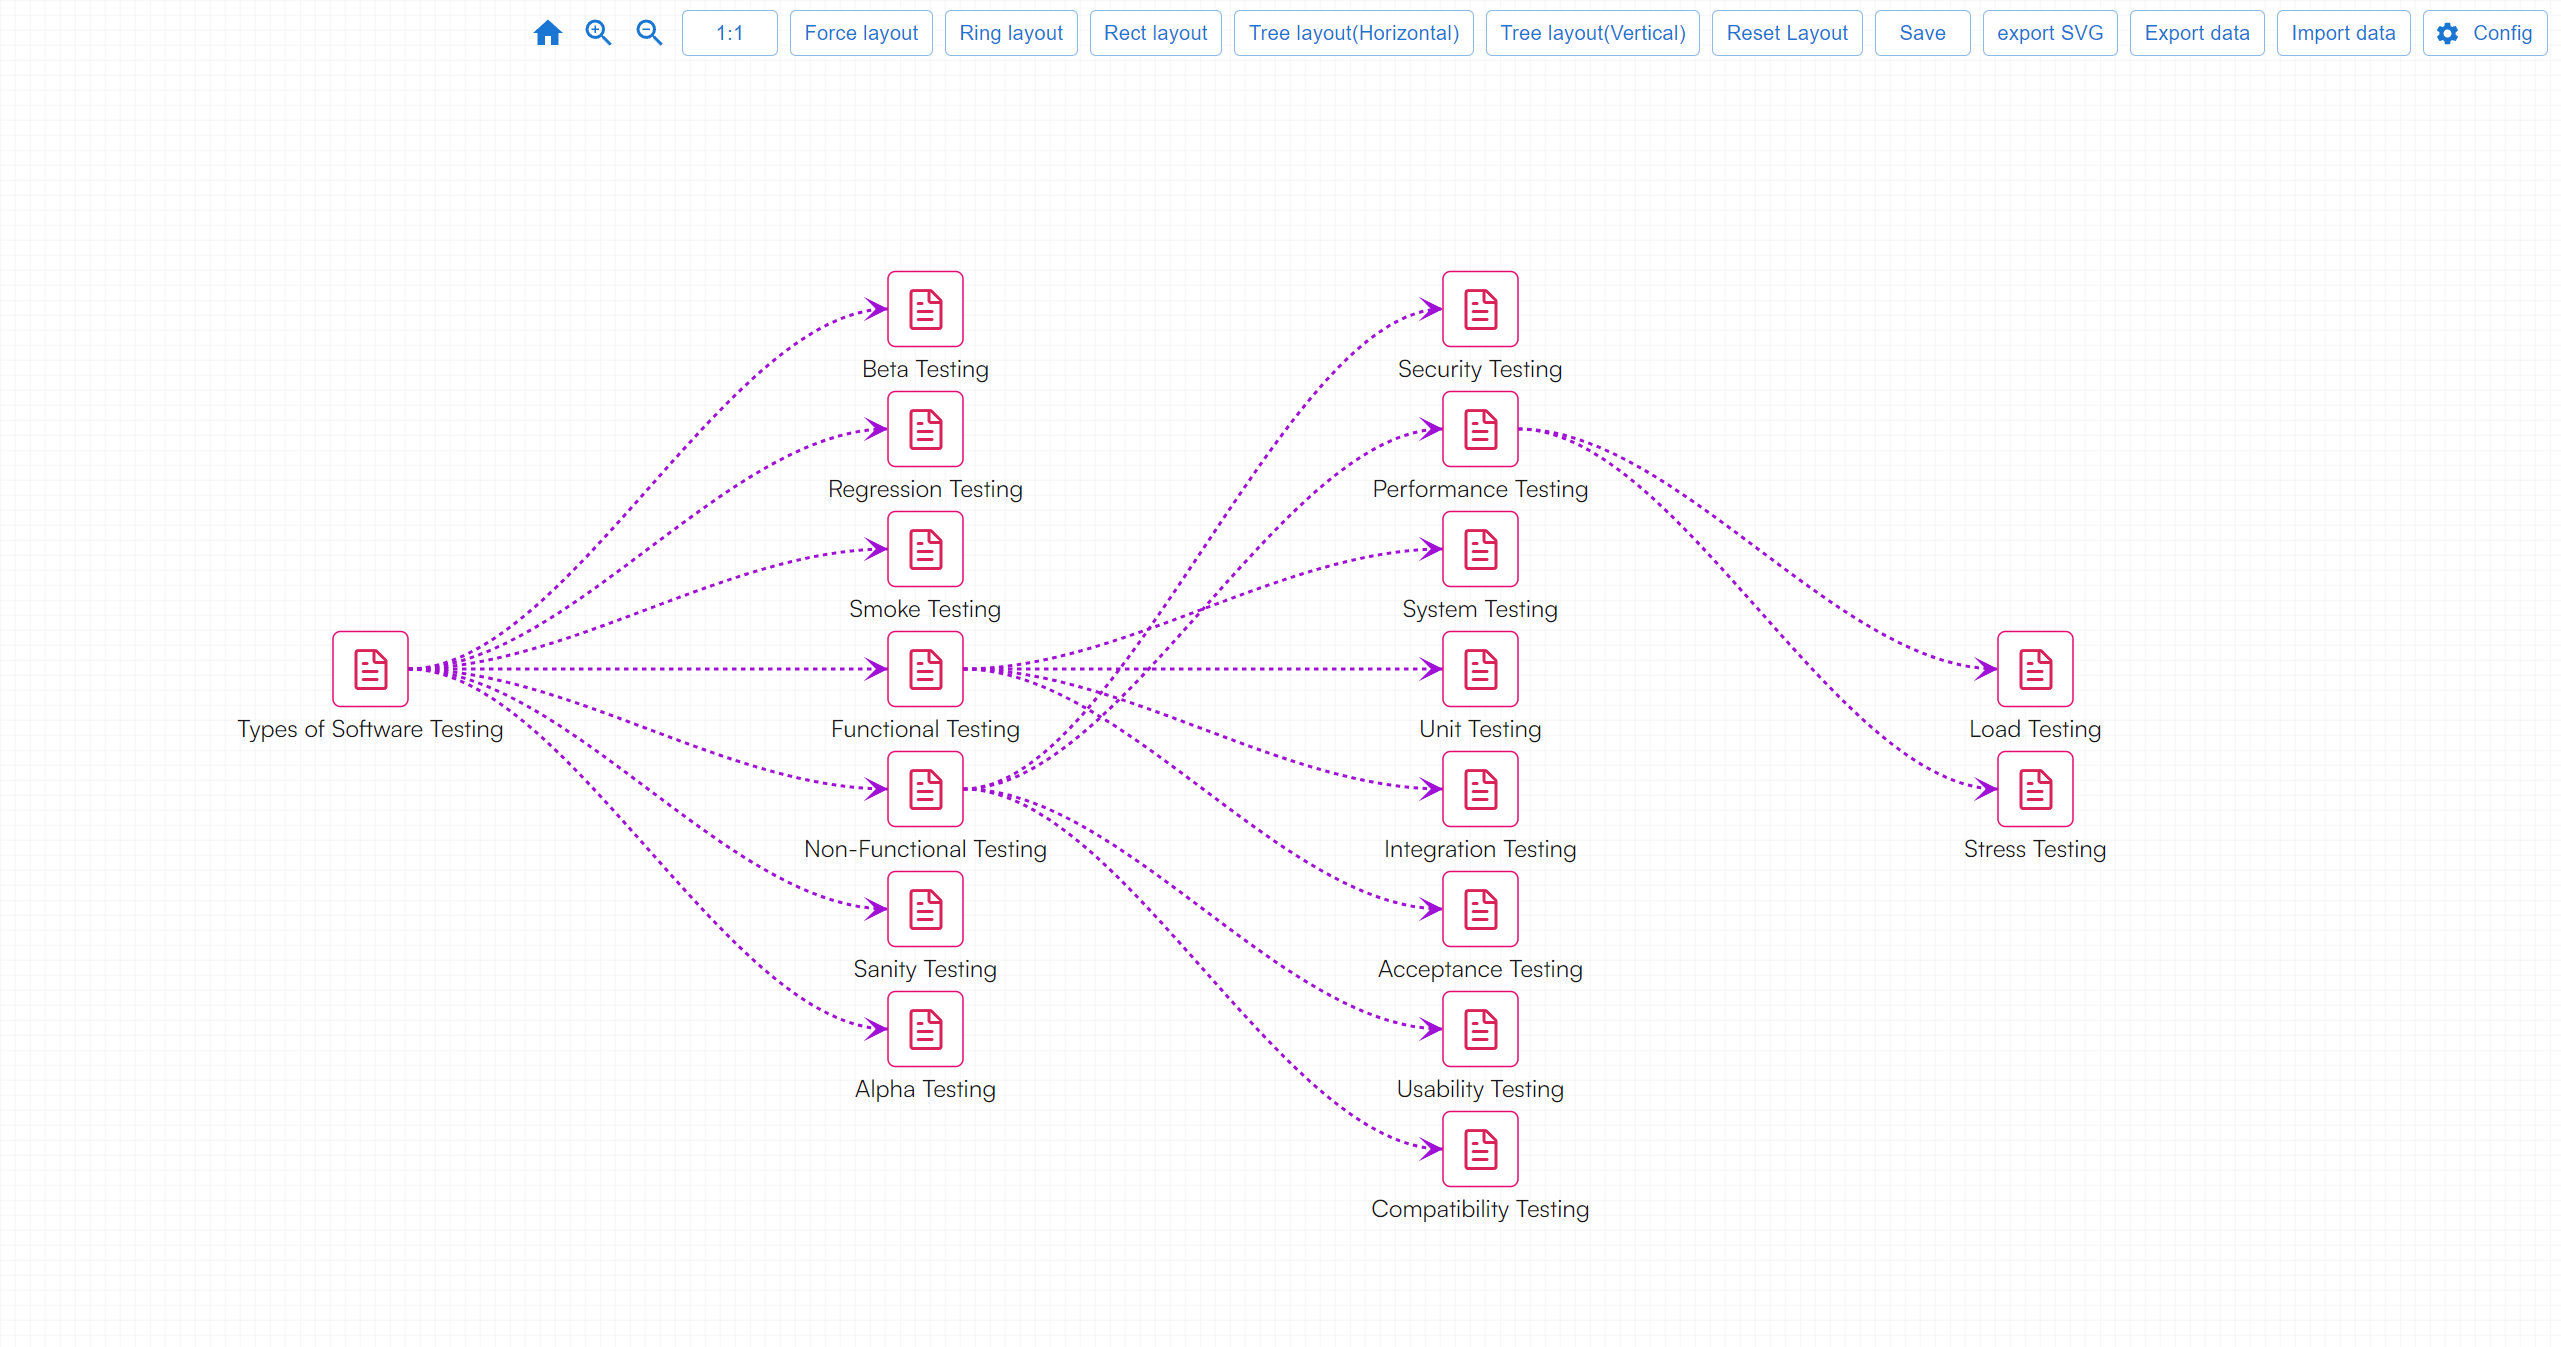
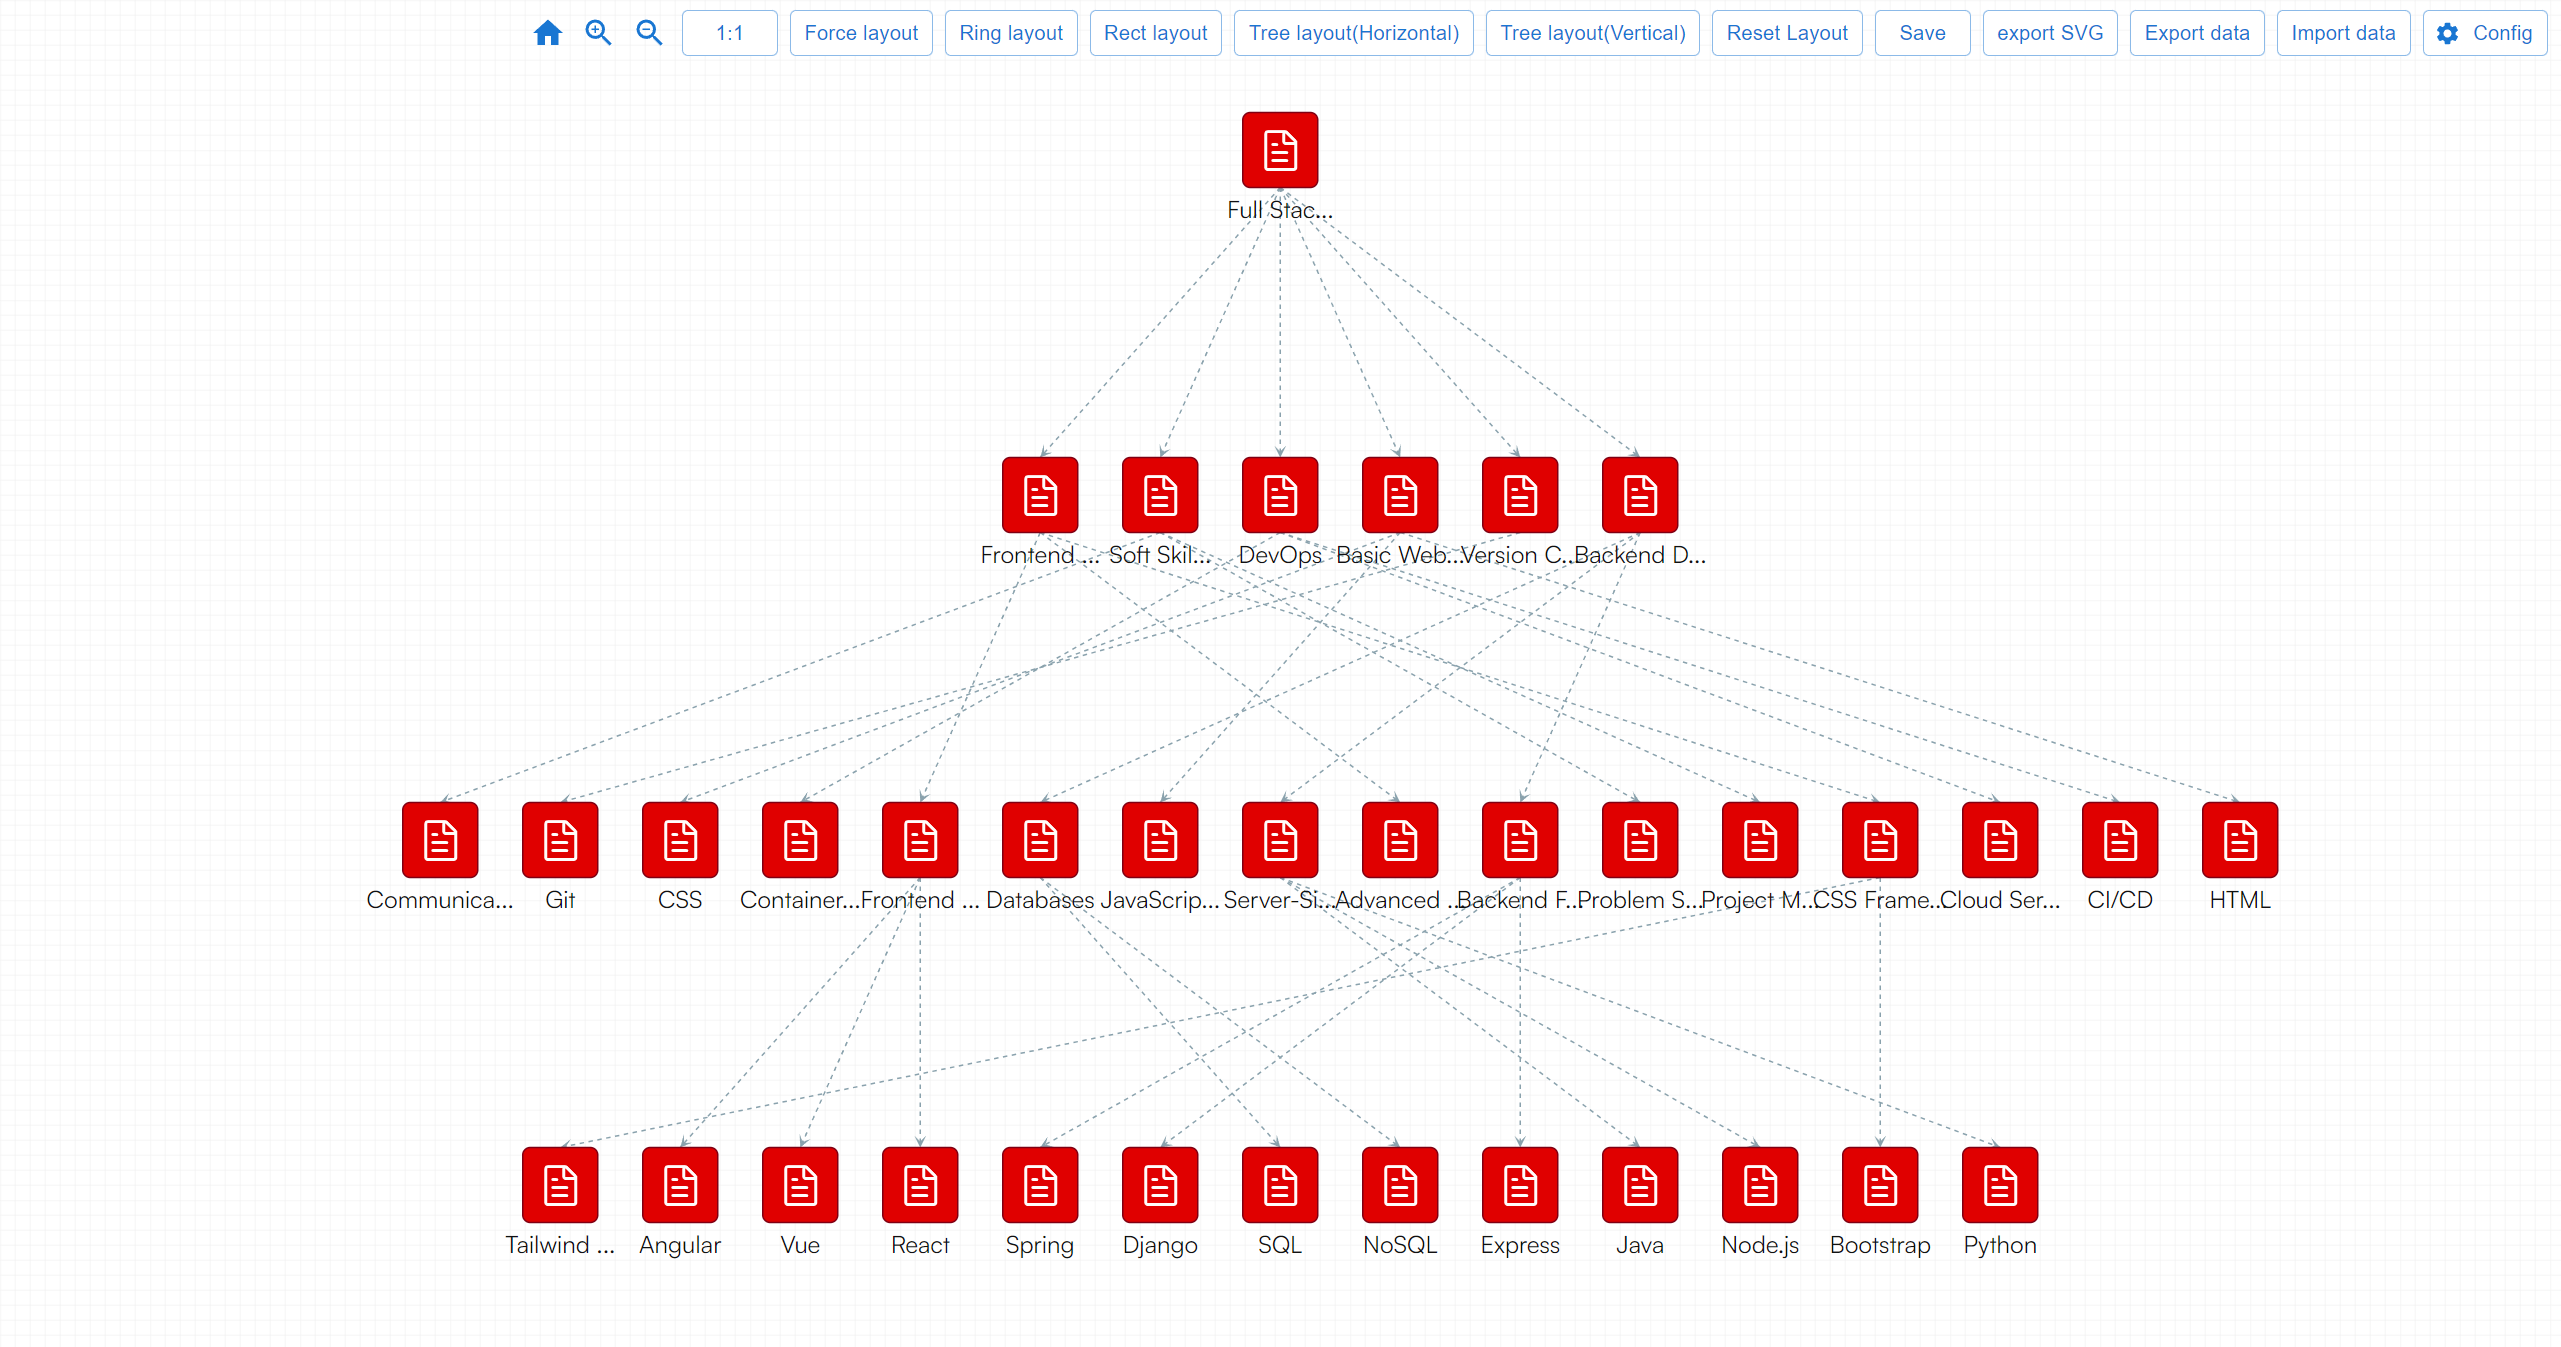
Beyond basic diagramming, AddGraph serves as a powerful data visualization tool. It currently supports multiple layout methods, each tailored to different types of data and visualization needs:
Force Layout: Ideal for visualizing networks and relationships, this layout arranges nodes based on attractive and repulsive forces.
Circular Layout: Perfect for displaying cyclic data or relationships, nodes are arranged in a circular manner.
Horizontal Tree Layout: Suitable for hierarchical data, this layout arranges nodes in a horizontal tree structure.
Vertical Tree Layout: Similar to the horizontal tree layout, but arranges nodes in a vertical tree structure.
Rectangular Layout: Useful for grid-like or tabular data representations, nodes are arranged in a rectangular grid.

Practical Applications of AddGraph
1. System Architecture Design
AddGraph is an excellent tool for designing and visualizing system architectures. Developers can create detailed diagrams that illustrate the relationships between different components of a system, making it easier to understand complex architectures and communicate ideas effectively.
2. Data Analysis and Visualization
Analysts can leverage AddGraph to visualize complex datasets. The different layout methods allow for a variety of visual representations, making it easier to identify patterns, trends, and relationships within the data.
3. Project Management and Planning
Project managers can use AddGraph to create project plans, timelines, and workflow diagrams. The ability to export diagrams as SVG or JSON files ensures that these visual plans can be easily shared and integrated with other project management tools.
4. Educational Use
Educators and students can utilize AddGraph for teaching and learning purposes. The tool can be used to create diagrams that explain complex concepts, visualize processes, or represent data in an engaging and interactive manner.

Conclusion
AddGraph stands out as a versatile and powerful tool for graph diagramming and whiteboarding applications. Its simplicity, combined with robust features like local data storage, import/export capabilities, and multiple layout methods, makes it an indispensable tool for developers, analysts, project managers, and educators. By facilitating easy creation, modification, and sharing of diagrams, AddGraph helps users communicate their ideas more effectively and gain deeper insights from their data. Whether you are designing a system architecture, visualizing complex data, or planning a project, AddGraph is the tool that can elevate your work to the next level.
Subscribe to my newsletter
Read articles from friday directly inside your inbox. Subscribe to the newsletter, and don't miss out.
Written by
