Enhancing Python Code Quality with Qodana
 Debashis Adak
Background
As this is my first time using Qodana for a code quality check, I am documenting my entire journey of analyzing my Python repository. Since I am new to evaluating this tool, there might be mistakes and I may not follow best practices. But that’s okay! I am going with the flow to see where this journey takes me.
How did I discover this tool? The simple answer is LinkedIn and the open-source community.
Focus Areas
Right now, I'm not entirely sure what my focus areas should be. One focus area that comes to mind is code quality. Previously, I used some code quality tools in my organization. They usually provide insights on things like bugs and code smells. Let's see what Qodana offers.
Journey Starts!!!
What is Qodana? Read the about-Qodana page (https://www.jetbrains.com/help/qodana/about-qodana.html). Here is a reference from their site:
Qodana, a smart code quality platform by JetBrains, is ideal for team collaboration and can analyze code in over 60 languages, including Java, JavaScript, TypeScript, PHP, Kotlin, Python, Go, and C#.
I usually use PyCharm for my Python development. Hold on a second! PyCharm and Qodana are both from JetBrains. Wait a minute! Qodana is already available under the tools. No doubt I am not seeing every tab of PyCharm :P
This is my project structure, and I know it's a small project.
d-----        01-06-2024     16:52                .idea
-a----        28-05-2024     00:33             54 .env
-a----        31-05-2024     18:36           3337 .gitignore
-a----        01-06-2024     00:16           1775 app.py
-a----        31-05-2024     18:36         130573 poetry.lock
-a----        31-05-2024     18:36            363 pyproject.toml
-a----        01-06-2024     00:32            968 qodana.yaml
-a----        27-05-2024     22:33           6258 README.md
-a----        01-06-2024     00:25            418 test.py
Lets start by clicking on "Try Code Analysis with Qodana"
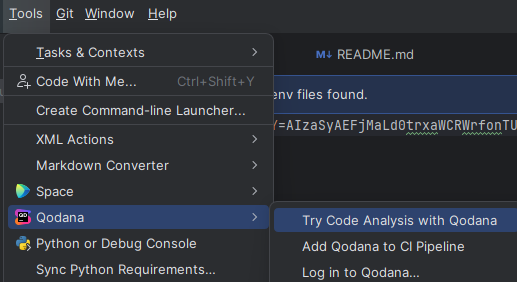
It is saying to generate qodana.yaml configuration file locally. Generated.
#-------------------------------------------------------------------------------#
#               Qodana analysis is configured by qodana.yaml file               #
#             https://www.jetbrains.com/help/qodana/qodana-yaml.html            #
#-------------------------------------------------------------------------------#
version: "1.0"

#Specify inspection profile for code analysis
profile:
  name: qodana.starter

#Enable inspections
#include:
#  - name: <SomeEnabledInspectionId>

#Disable inspections
#exclude:
#  - name: <SomeDisabledInspectionId>
#    paths:
#      - <path/where/not/run/inspection>

#Execute shell command before Qodana execution (Applied in CI/CD pipeline)
#bootstrap: sh ./prepare-qodana.sh

#Install IDE plugins before Qodana execution (Applied in CI/CD pipeline)
#plugins:
#  - id: <plugin.id> #(plugin id can be found at https://plugins.jetbrains.com)

#Specify Qodana linter for analysis (Applied in CI/CD pipeline)
linter: jetbrains/qodana-<linter>:latest
I can see only two properties are active.
profile
linter
Profile (Ref)
Inspection profiles let you configure inspections, the scope of files to analyze, and the severity settings. Qodana uses these profiles to decide how and what to inspect in a codebase.
Qodana includes predefined profiles available onGitHub_:
qodana.starteris the default profile and a subset ofqodana.recommended, triggering the3-phase analysisqodana.recommendedis suitable for CI/CD pipelines and mostly implements the default IDE profiles. For more details, see theIntelliJ IDEAdocumentation
There is also a profile called qodana.sanity (only includes sanity checks), though it is not mentioned in the documentation.
Linter (Ref)
A linter is a software tool that analyzes codebase for bugs, errors, and other mistakes that impact its quality and can cause problems. Basically, each Qodana linter is associated with a specific programming language and helps you:
Detect anomalous code and probable bugs
Eliminate dead code
Highlight spelling problems
Improve overall code structure
Introduce coding best practices
Check third-party license compatibility. This feature is available inseveral linters
Upload analysis reports toQodana Cloud
For Python, we have two linters available:
Qodana for Python /
jetbrains/qodana-python:2024.1Qodana Community for Python /
jetbrains/qodana-python-community:2024.1
These linters are Docker images that help Qodana run the checks mentioned above. They are available on DockerHub.
Local Test
qodana.yaml file
#-------------------------------------------------------------------------------#
#               Qodana analysis is configured by qodana.yaml file               #
#             https://www.jetbrains.com/help/qodana/qodana-yaml.html            #
#-------------------------------------------------------------------------------#
version: "1.0"
#Specify inspection profile for code analysis
profile:
  name: qodana.recommended
#Enable inspections
#include:
#  - name: All
#Disable inspections
#exclude:
#  - name: <SomeDisabledInspectionId>
#    paths:
#      - <path/where/not/run/inspection>
#Execute shell command before Qodana execution (Applied in CI/CD pipeline)
#bootstrap: sh ./prepare-qodana.sh
#Install IDE plugins before Qodana execution (Applied in CI/CD pipeline)
#plugins:
#  - id: <plugin.id> #(plugin id can be found at https://plugins.jetbrains.com)
#Specify Qodana linter for analysis (Applied in CI/CD pipeline)
linter: jetbrains/qodana-python:latest
Let's test the code quality locally. You can go to Tools -> Qodana -> Try Code Analysis with Qodana. After running the test, you will see all the code quality issues if any. You can also view it in the browser by clicking on "Open Qodana report in browser".

Browser
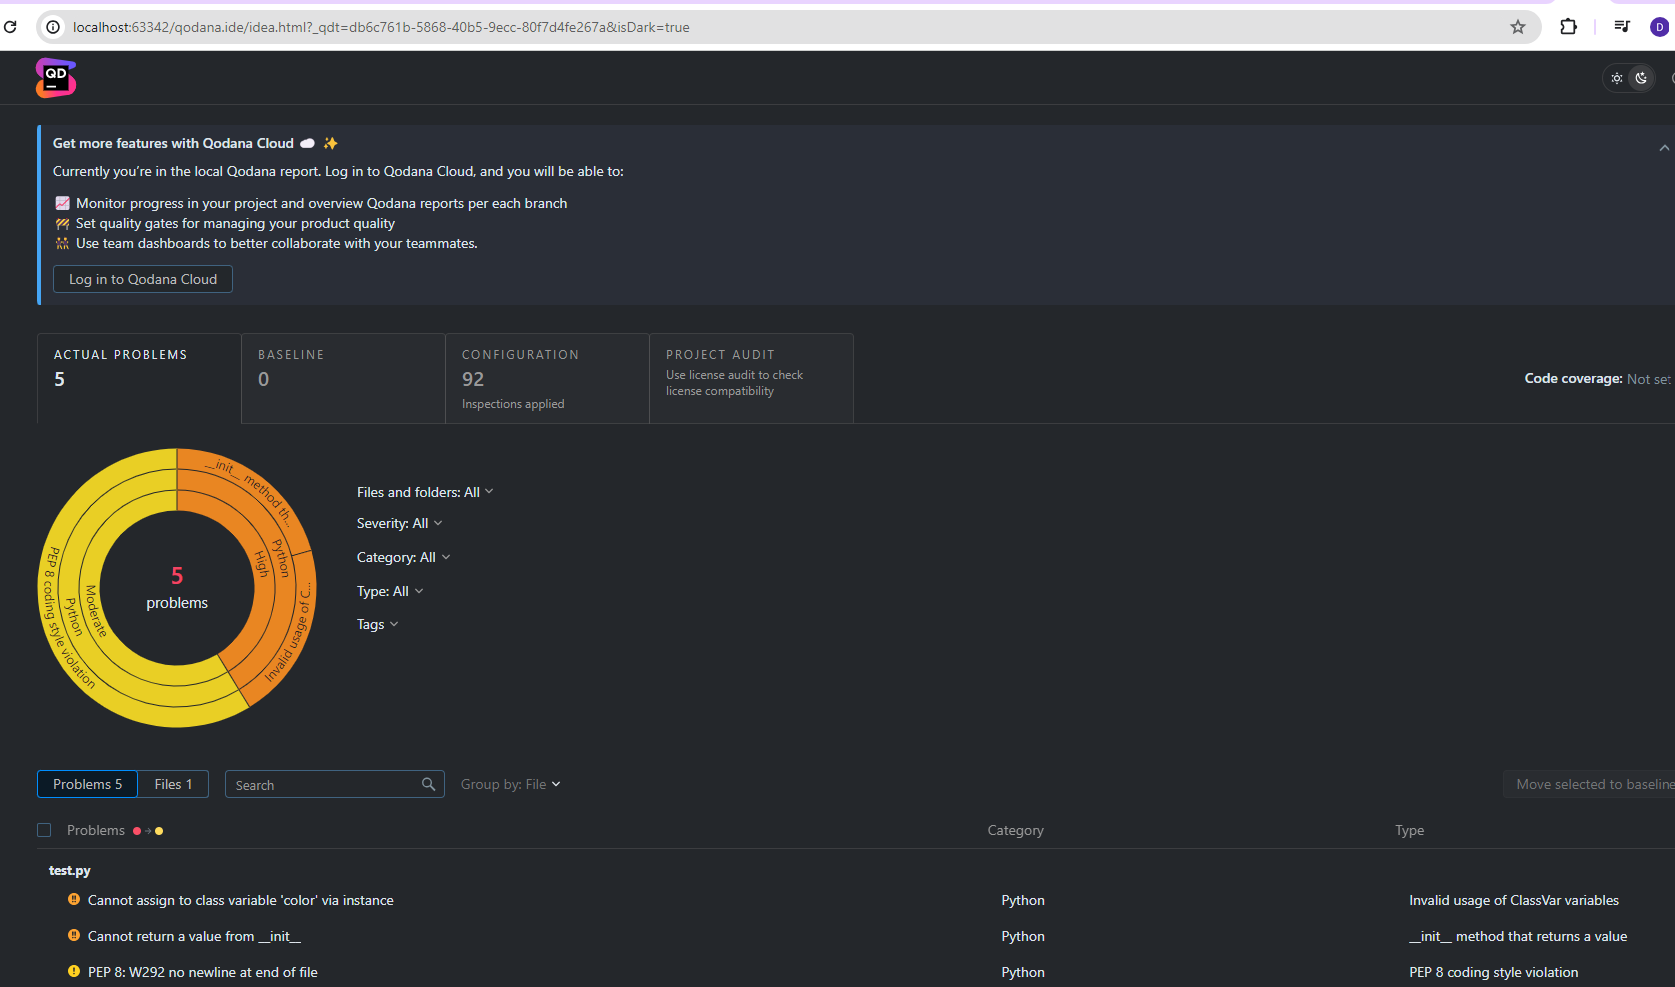
You can see got some code quality issues on test.py file.
These code quality checks are validated using Inspection configuration mentioned on the below tab
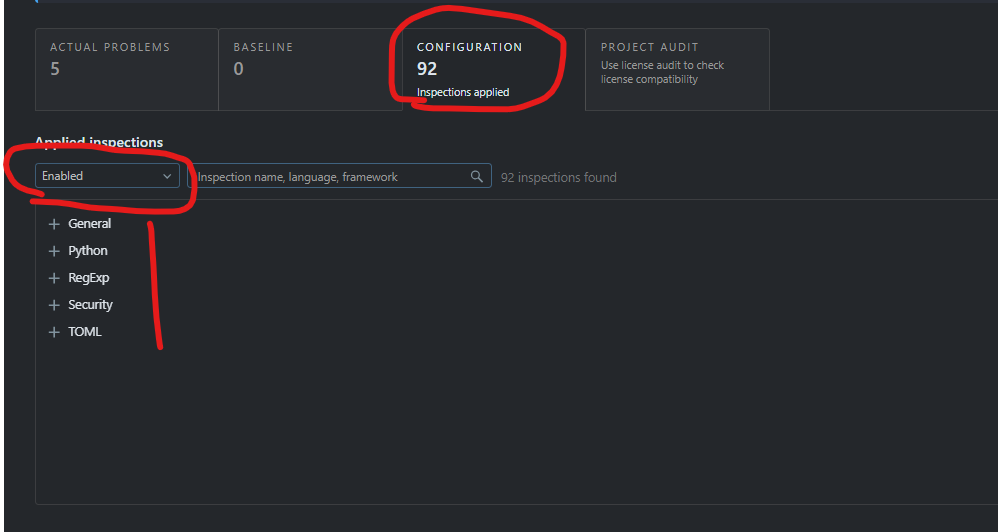
Integration - Qodana Cloud & Gitlab
If we are working on a project, we cannot force every developer to use Qodana on their local system. We need these reports to be analyzed in a central portal where users can check the code quality report. Typically, in organizations, these portals are integrated with CI/CD pipelines. So, when developers push their changes to a branch like main/master or raise a merge request (MR), the code is automatically analyzed during the pipeline run.
For that, Qodana is providing its cloud offering "Qodana Cloud".
Qodana Cloud Account Setup
Steps
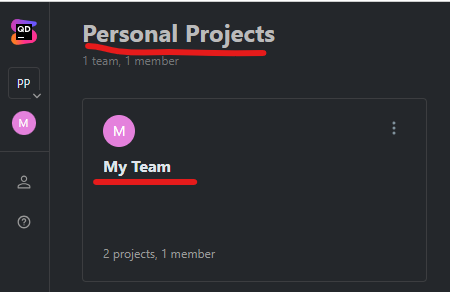
Create a Qodana Cloud Account
Create an Orginization
Create a Team
Qodana Project Creation & Integration with Gitlab
Qodana Project Setup
- Create a Project

- Put Your SSH link of Gitlab
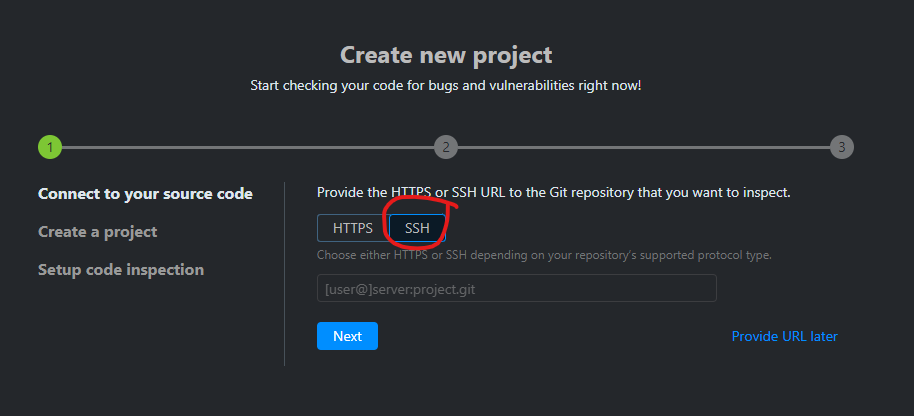
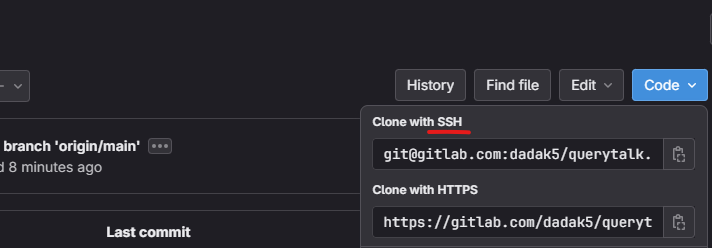
- Post providing your ssh key, it will give a public key
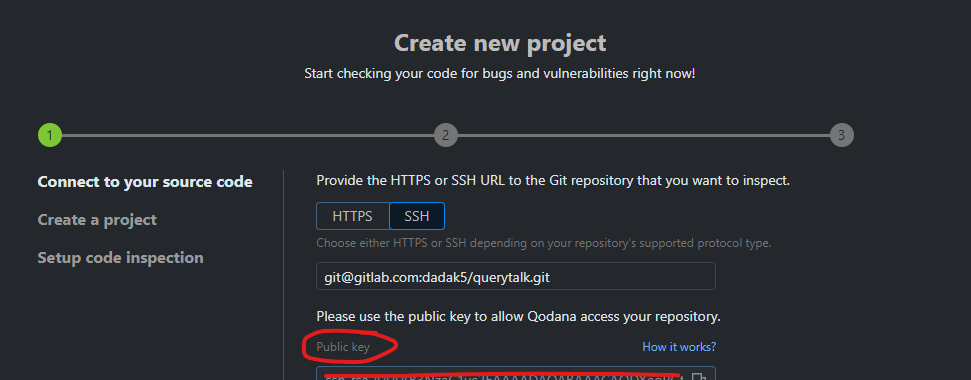
- Copy the public key & Create a Deploy Key in Gitlab. This step helps Qodana cloud to find your gitlab repository details. As you can see below, it has found my repository.

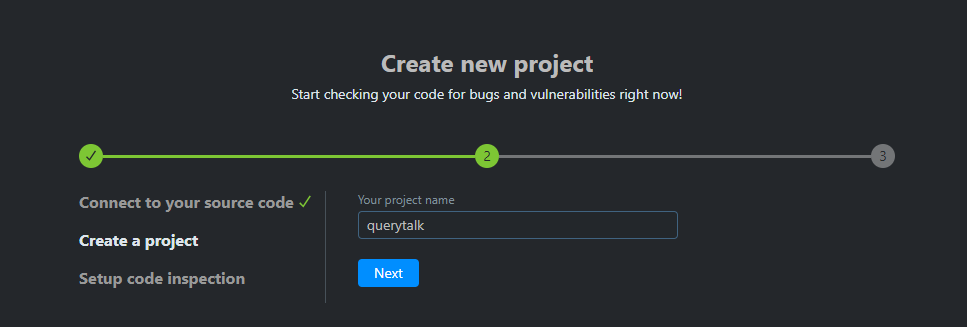
Project Created (Skip & Close)
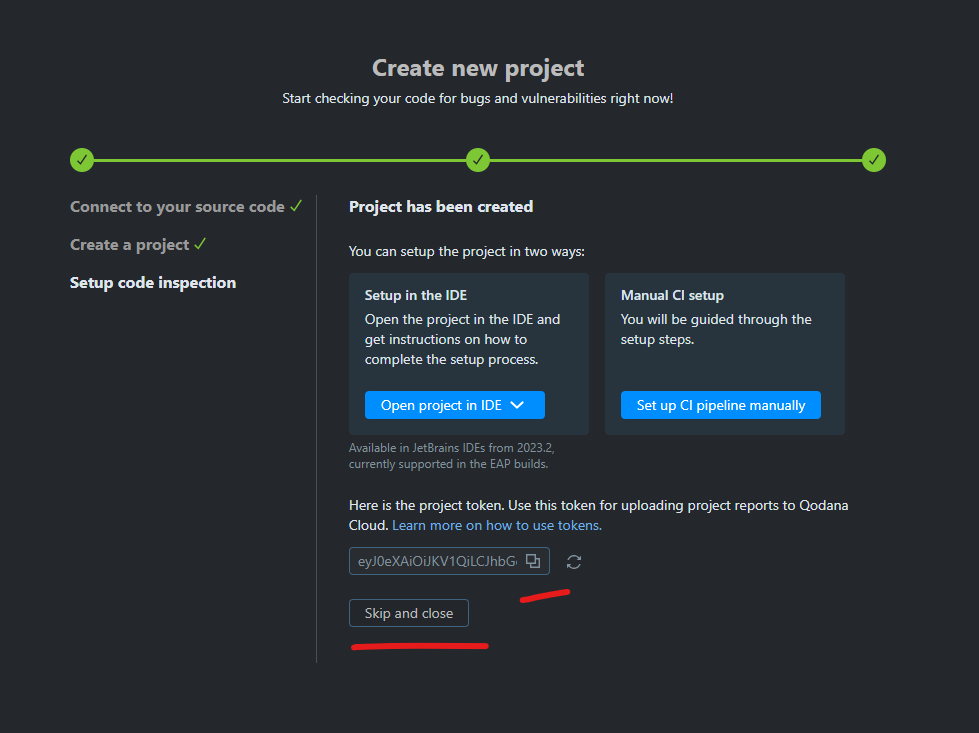
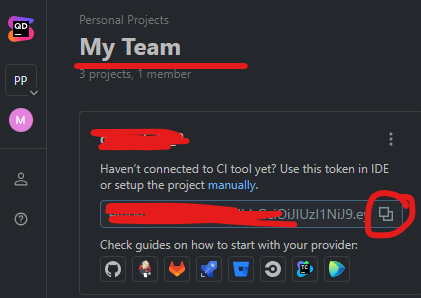
- Get the Project token & Establish a Connection with Gitlab CI/CD

This will help Qodana to communicate with CI/CD pipeline.
Note: Your variable has to be qodana_token because it will be referenced in your gitlab .gitlab-ci.yaml code (steps to follow)
Gitlab .gitlab-ci.yml changes
When ever we run Qodana check locally, it gives us a option to generate CI/CD pipeline. Click on "Add Qodana to CI/CD pipeline"

It will give option to generate .gitlab-ci.yaml file. Add it.
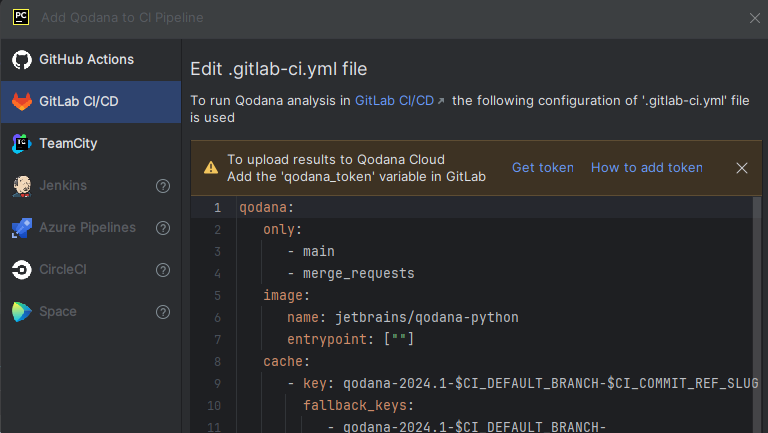
To know different options available for gitlab, you can follow this link https://www.jetbrains.com/help/qodana/gitlab.html It explained well things you can configure with Qodana - Gitlab
.gitlab-ci.yml reference I used
qodana:
   only:
      - main
      - merge_requests
   image:
      name: jetbrains/qodana-python
      entrypoint: [""]
   cache:
      - key: qodana-2024.1-$CI_DEFAULT_BRANCH-$CI_COMMIT_REF_SLUG
        fallback_keys:
           - qodana-2024.1-$CI_DEFAULT_BRANCH-
           - qodana-2024.1-
        paths:
           - .qodana/cache
   variables:
      QODANA_TOKEN: $qodana_token
   script:
      - qodana --cache-dir=$CI_PROJECT_DIR/.qodana/cache
   artifacts:
      paths:
         - $CI_PROJECT_DIR/.qodana/results/
      expose_as: 'Qodana report'
Note: Refer to the section "only". It means whenever there is a change on main branch or there is a merge request, qodana code quality check is mandatory
Run Pipeline
When you run your pipeline, you can see Qodana docker file is getting used to analyze the code & getting published to Qodana Cloud
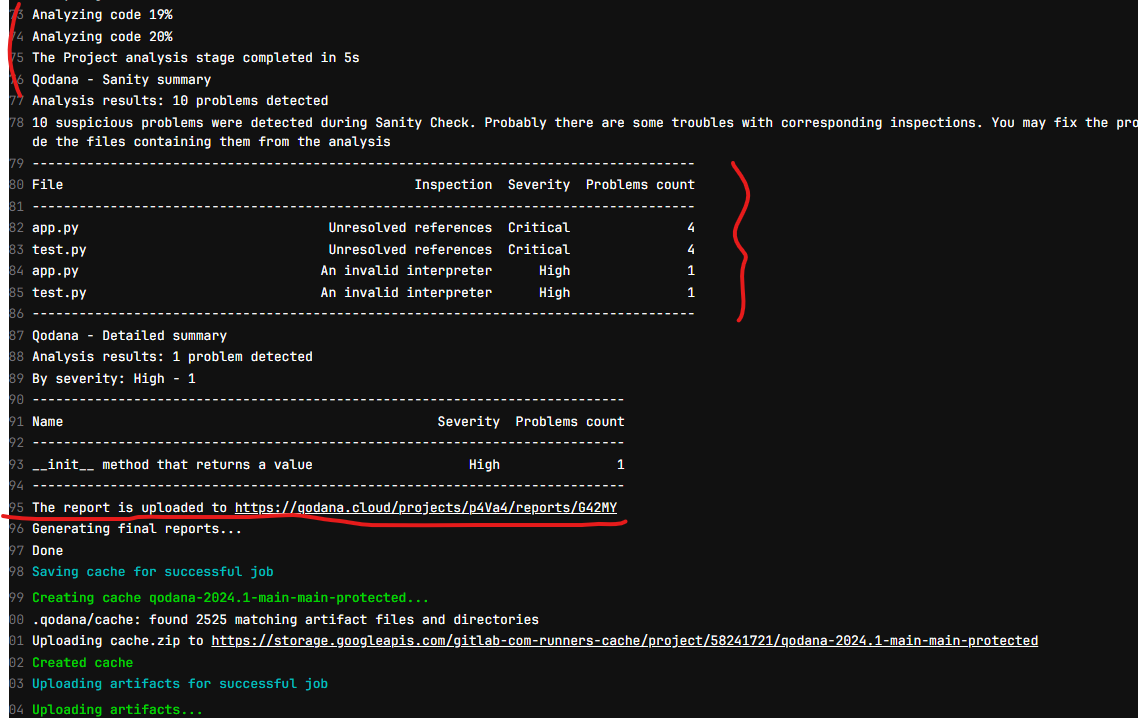
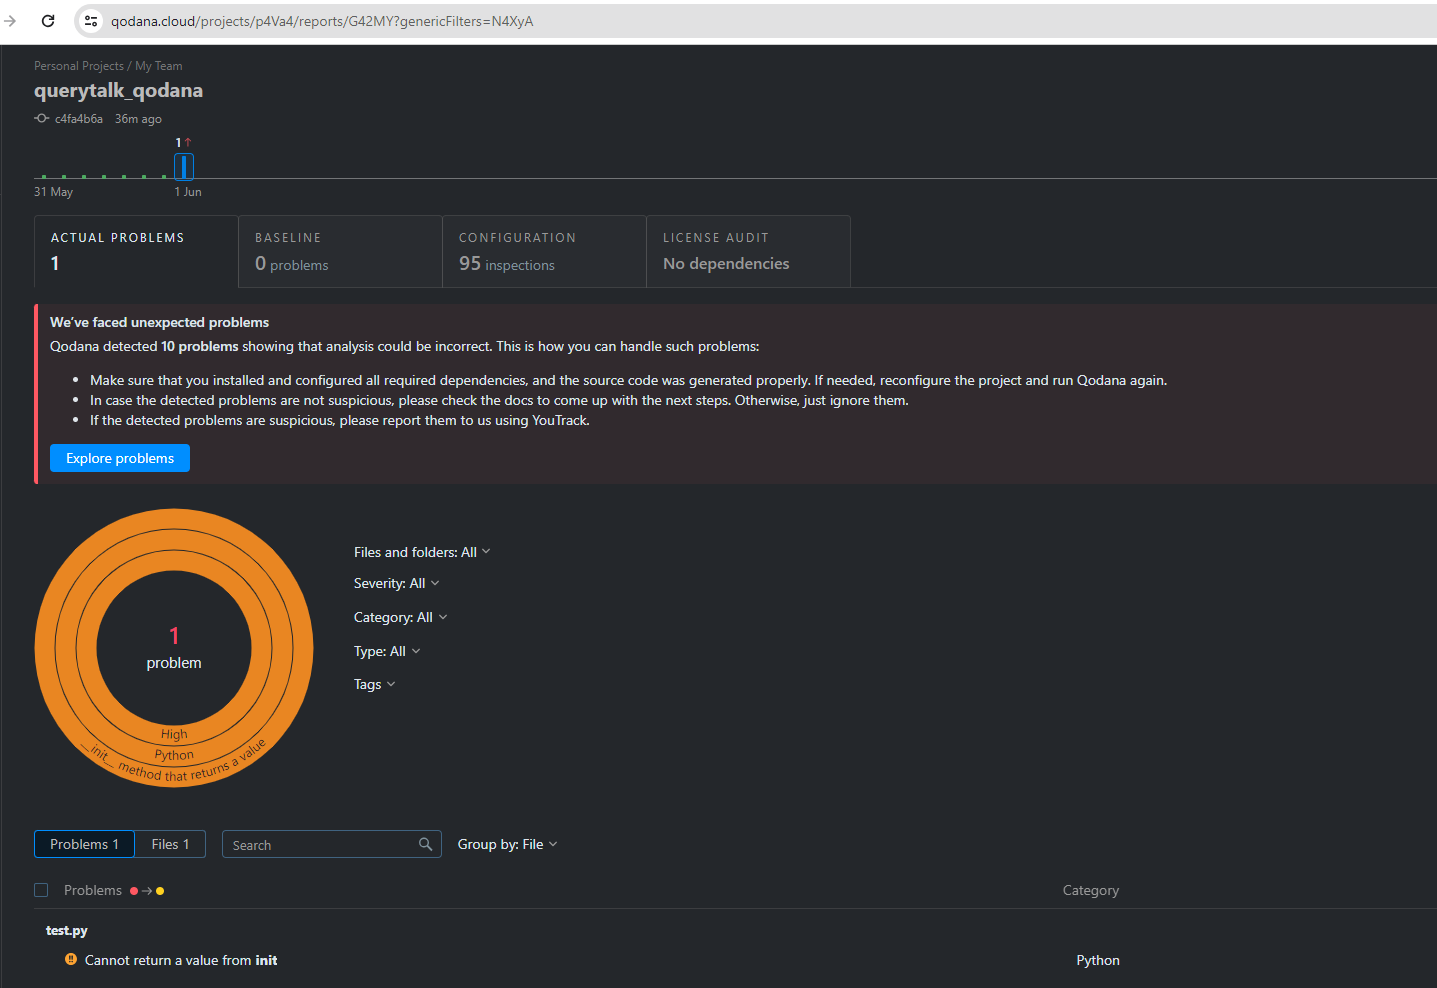
Verify In Qodana Cloud
You can see your reports in the cloud
Subscribe to my newsletter
Read articles from Debashis Adak directly inside your inbox. Subscribe to the newsletter, and don't miss out.
Written by
