Analyzing Titanic Data: Initial Findings
 Oluwadunsin Oluwaleye
Introduction
Titanic, the popular 1997 movie, is well known, mostly for its inclusion of the short-lived love story of two young lovers as the life of one was graciously sacrificed for the safety of the other. The movie, however, also dives into the tragic tale of a shipwreck, capturing the harrowing struggle for survival amidst the relentless forces of the sea.
The titanic dataset is a well-known dataset used for exploring various aspects of data analysis and predictive modeling. This dataset comprises information on passengers who were aboard the RMS Titanic, which sank on its maiden voyage in April 1912. Notable factors in the dataset encompass passenger information like age, gender, ticket class, survival outcome, among others. This report aims to conduct an initial examination of the dataset, pinpoint significant patterns and trends, and propose potential avenues for further investigation. This overview serves as a basis for in-depth exploration and model construction."
Observations
A few observations from the dataset at first glance include;
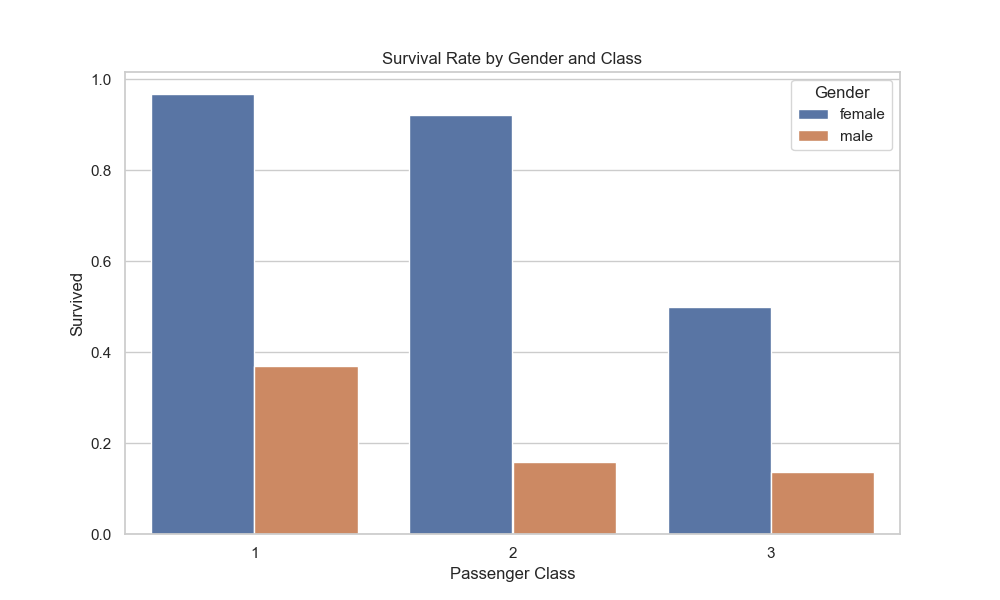
Survivors as grouped according to their gender and ticket class
Age Distributions of Passengers
1. Survivors as grouped according to their gender and class
Observation: The survival rate appears significantly higher for women compared to men. Additionally, passengers in higher ticket classes (1st and 2nd) seem to have better survival rates than those in the 3rd class.
Gender Survival Rates:
Male: 20% survived
Female: 74% survived
Class Survival Rates:
1st Class: 63% survived
2nd Class: 47% survived
3rd Class: 24% survived
This pattern aligns with historical accounts where women and children were given priority during evacuation.
Visualization:
Figure: Survival rate by gender and class.

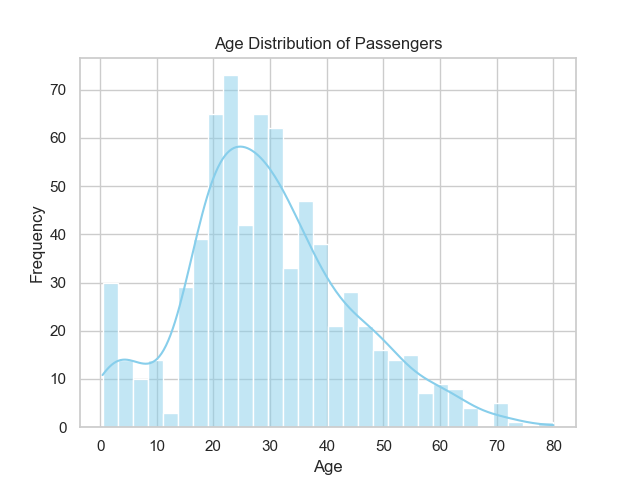
2. Age Distribution of Passengers
Observation: The age distribution of the passengers spans from infants to elderly individuals. A notable concentration is observed among younger adults (20-40 years old).
Summary Statistics:
Mean Age: 29.7 years
Median Age: 28.0 years
Standard Deviation: 14.5 years
Minimum Age: 0.42 years (approximately 5 months)
Maximum Age: 80 years
The age distribution helps identify potential biases in survival rates across different age groups, which could be explored further.
Visualization:

Figure: Age distribution of passengers.
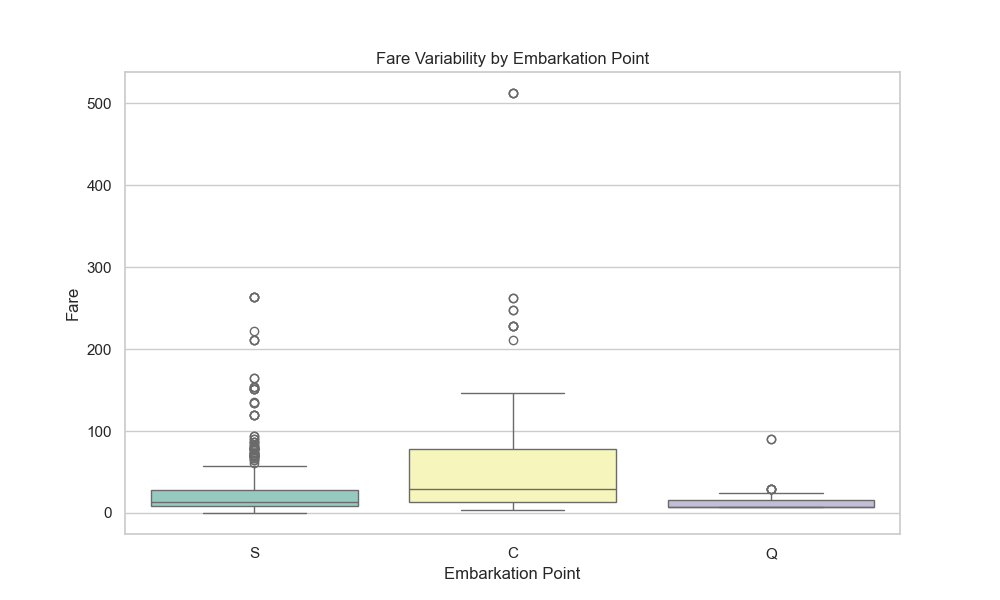
3. Embarkation Points and Fare Variability
Observation: Passengers embarked on their journey from three primary locations: Cherbourg (C), Queenstown (Q), and Southampton (S). Fare prices vary widely based on the embarkation point and ticket class, reflecting differences in socio-economic status among the passengers.
Embarkation Points:
Cherbourg: 168 passengers (19.3%)
Queenstown: 77 passengers (8.6%)
Southampton: 644 passengers (72.1%)
Fare Summary:
Mean Fare: $32.20
Median Fare: $14.45
Minimum Fare: $0.0
Maximum Fare: $512.33
These variations highlight the socio-economic diversity on board and may influence survival rates and class distinctions.
Visualization:

Figure: Fare variability by embarkation point.
Conclusion
The initial review of the Titanic dataset reveals significant patterns in survival rates influenced by gender, class, and age, as well as diverse fare distributions linked to embarkation points. These findings suggest areas for further analysis, such as the impact of socio-economic factors on survival and the role of age and class in shaping outcomes. For a more comprehensive analysis, exploring correlations and predictive modeling could provide deeper insights into the underlying factors affecting passenger survival.
For more information about the HNG Internship program, visit the HNG Internship website or explore opportunities to hire talented individuals.
Subscribe to my newsletter
Read articles from Oluwadunsin Oluwaleye directly inside your inbox. Subscribe to the newsletter, and don't miss out.
Written by
