Cyclistic Bike Share Analysis (In Excel)
 Dilshod Akhrorov

How does a bike-share navigate speedy success?
(Google Data Analytics Certification Capstone Case Study 1)
This is a capstone project for the Google Data Analytics Certification on Coursera. In this project, we are a part of marketing analysis team, working for the fictional bike share company Cyclistic in Chicago. The director of marketing believes the company’s future success depends on maximizing the number of annual memberships. Therefore, our team wants to understand how casual riders and annual members use Cyclistic bikes differently. From these insights, our team will design a new marketing strategy to convert casual riders into annual members. But first, Cyclistic executives must approve our recommendations, so they must be backed up with compelling data insights and professional data visualizations.
In order to answer the business questions, we will follow the steps of the data analysis process: Ask, Prepare, Process, Analyze, Share, and Act.
Ask Phase
Three questions will guide the future marketing program:
How do annual members and casual riders use Cyclistic bikes differently?
Why would casual riders buy Cyclistic annual memberships?
How can Cyclistic use digital media to influence casual riders to become members?
Prepare Phase
The historical trip data of Cyclistic, provided by Motivate International Inc (downloaded from https://divvy-tripdata.s3.amazonaws.com/index.html), is organized in separate tables by month and year. For this case study, I selected data ranging from January 2023 to January 2024. Each tables includes the following columns:
“ride_id” — an identifier for each ride.
“rideable_type” — bike type used in this ride.
“started_at” — start date and time of each ride.
“ended_at” — end date and time of each ride.
“start_station_name” — the name of start station.
“start_station_id” — an identifier for start station.
“end_station_name” — the name of end station.
“end_station_id” — an identifier for end station.
“start_lat” — latitude of start station.
“start_lng” — longitude of start station.
“end_lat” — latitude of end station.
“end_lng” — longitude of end station.
“member_casual” — member or casual
To analyse and visualize this data, I used Microsoft Excel for data manipulation and visualizations.
Process Phase
Before starting any analysis, I need all the data be in one file, that’s mean that I need to combine all the 12 scv files into one Excel workbook. In order to Combine multiple CSV files into one Excel workbook, we can make use of the Windows Command Prompt tool or with Power Query in MS excel itself. Power Query is one of the most powerful tools in MS Excel. Among other things, it can join and transform data from different sources.
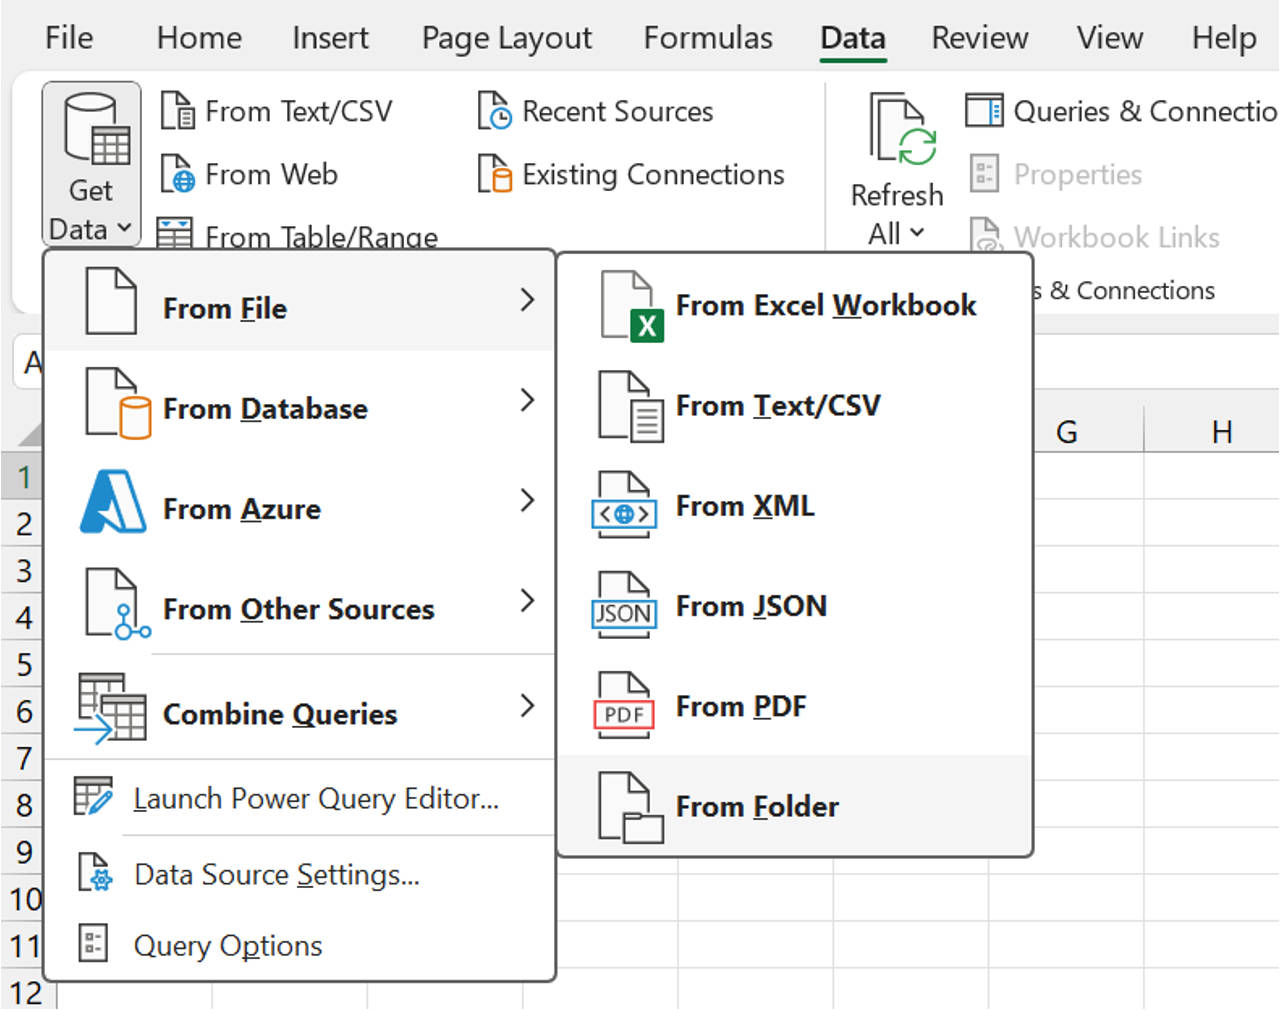
I chose Power Query to combine 12 csv files (for 12 months) into one Excel workbook, these are the steps that I followed: Firstly, I put all CSV files into one folder that contains only those scv files. On the ‘Data’ tab, in the ‘Get & Transform Data’ group, I clicked Get Data > From File > From Folder.
Then I browse the folder into which I've put the csv files and clicked Open.
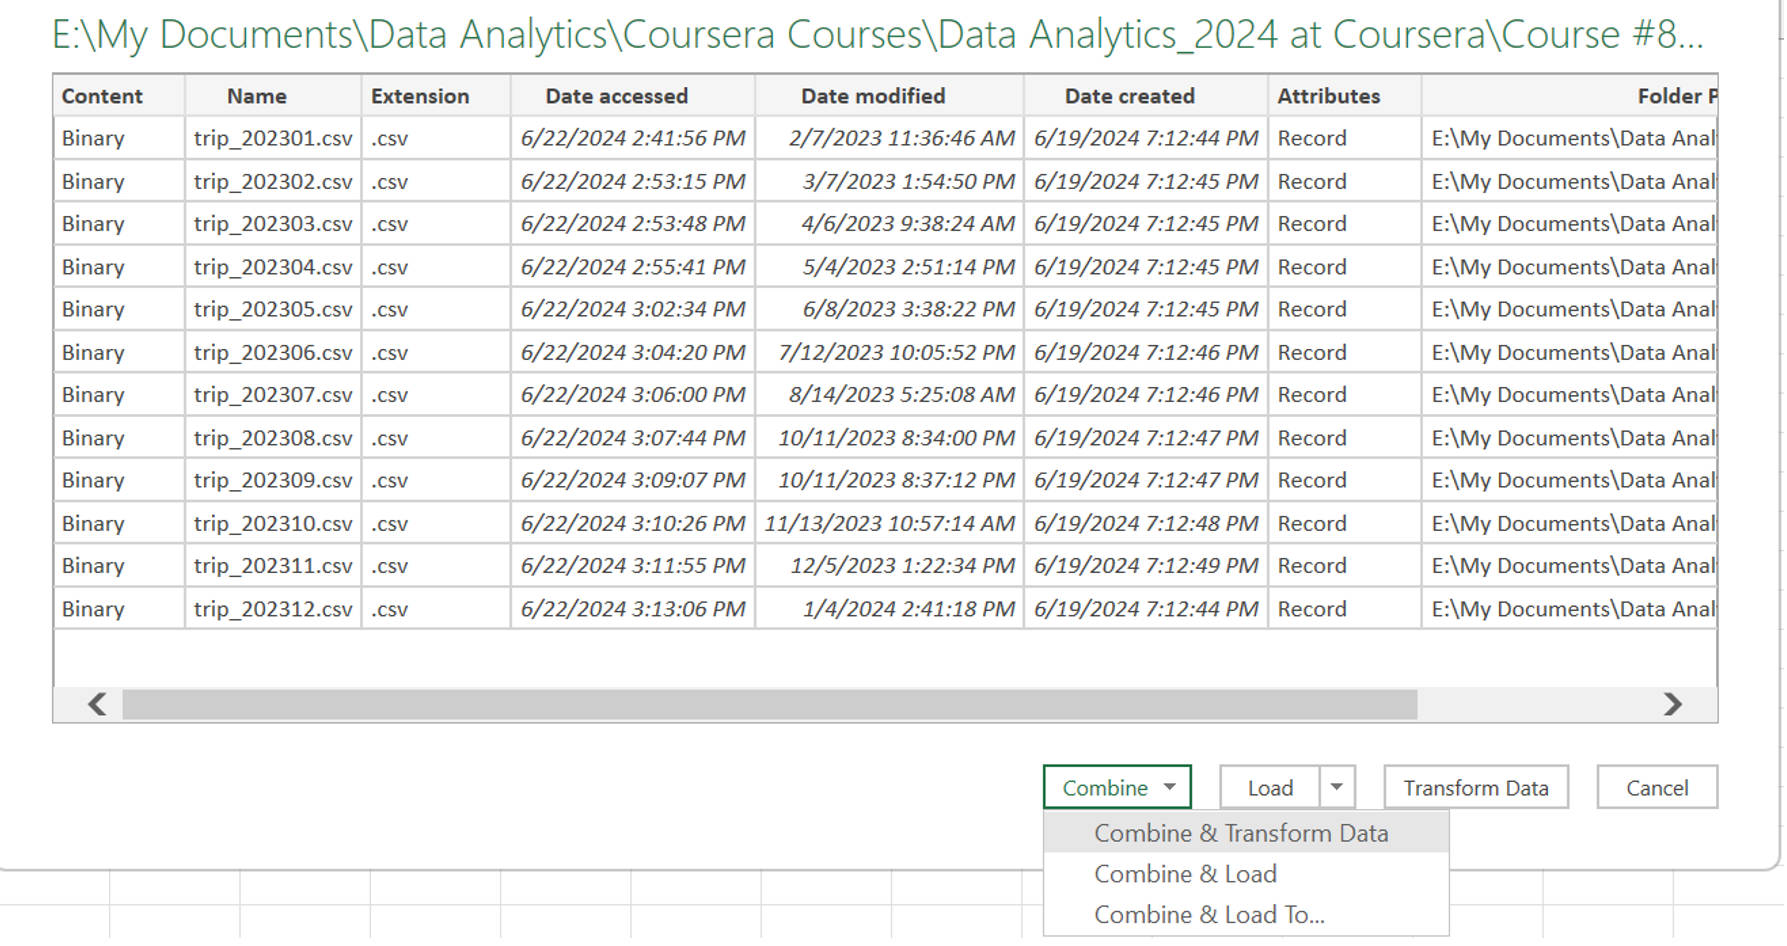
The next screen shows the details of all the files in the selected folder. In the Combine drop-down menu, three options are available to us:
Combine & Transform Data - the most flexible and feature rich one. The data from all csv files will be loaded to the Power Query Editor, where we can make various adjustments: choose data types for columns, filter out unwanted rows, remove duplicates, etc.
Combine & Load - the simplest and fastest one. Loads the combined data straight into a new worksheet.
Combine & Load To… - allows us to choose where to load the data (to an existing or new worksheet) and in what form (table, PivotTable report or chart, only a connection).
I clicked Combine & Transform Data and in the next screen I clicked Ok.
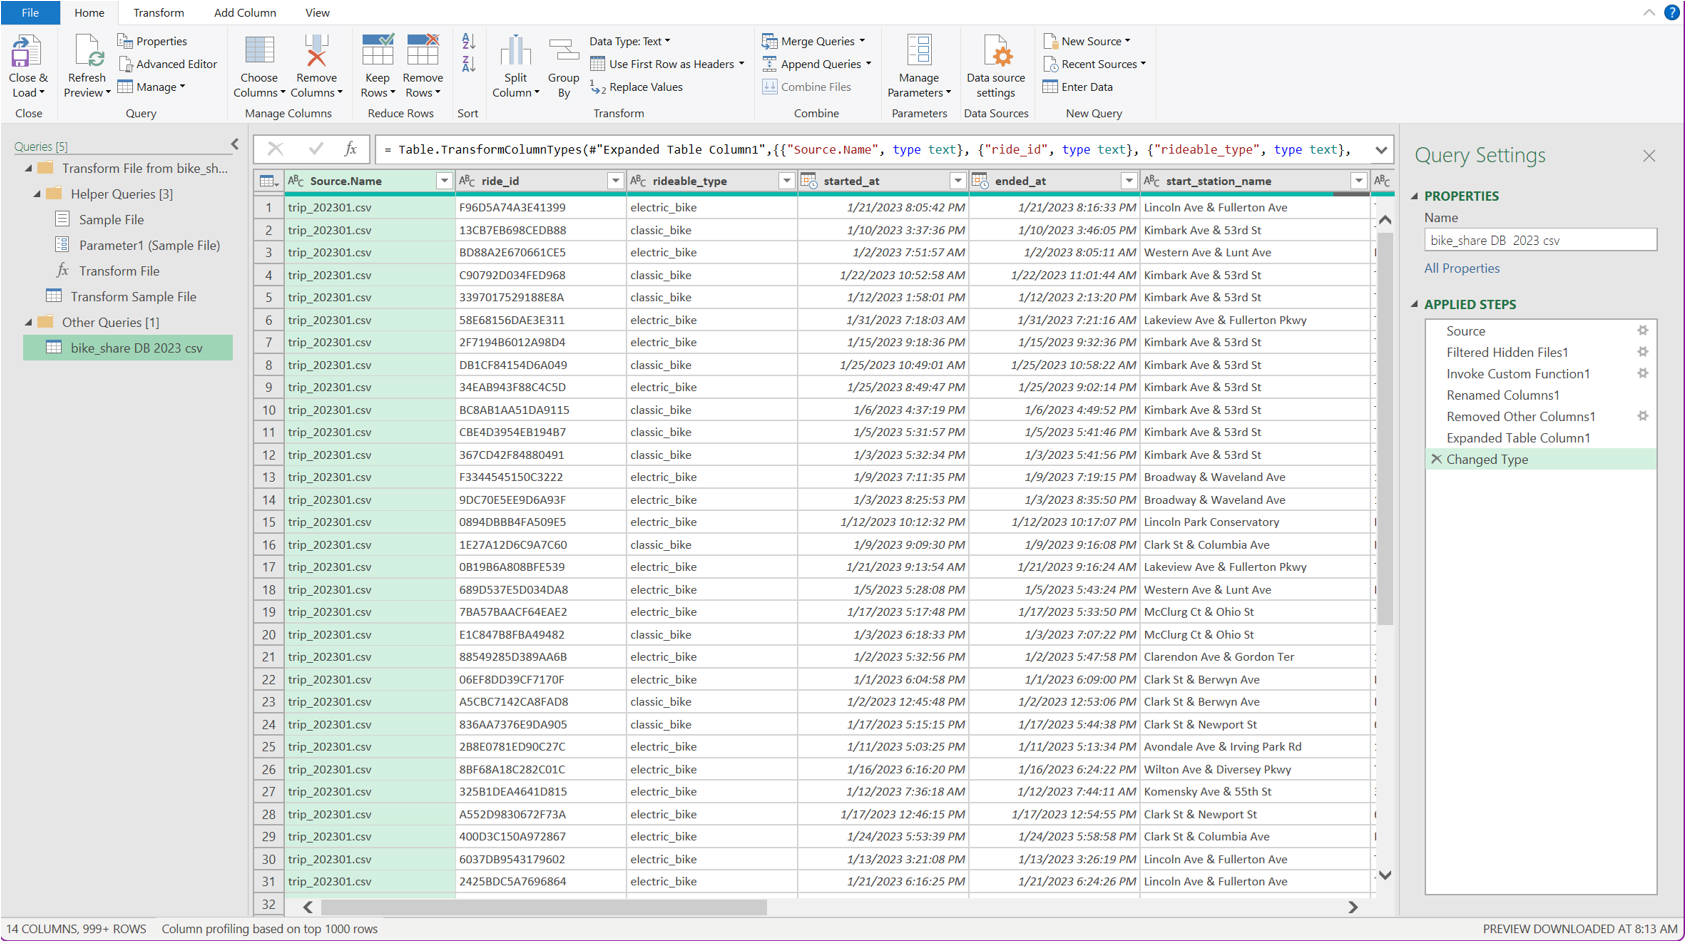
The following screen shows our combined data, and there’re some columns that I don’t really need in this analysis, so I deleted them. The final data contains the following columns which I also renamed each column:
“ride_id” - Rider ID — an identifier for each ride.
“rideable_type” - Bike Type — bike type used in this ride.
“started_at” - Started Date — start date and time of each ride.
“ended_at” - Ended Date — end date and time of each ride.
“member_casual” - Rider Type — member or casual
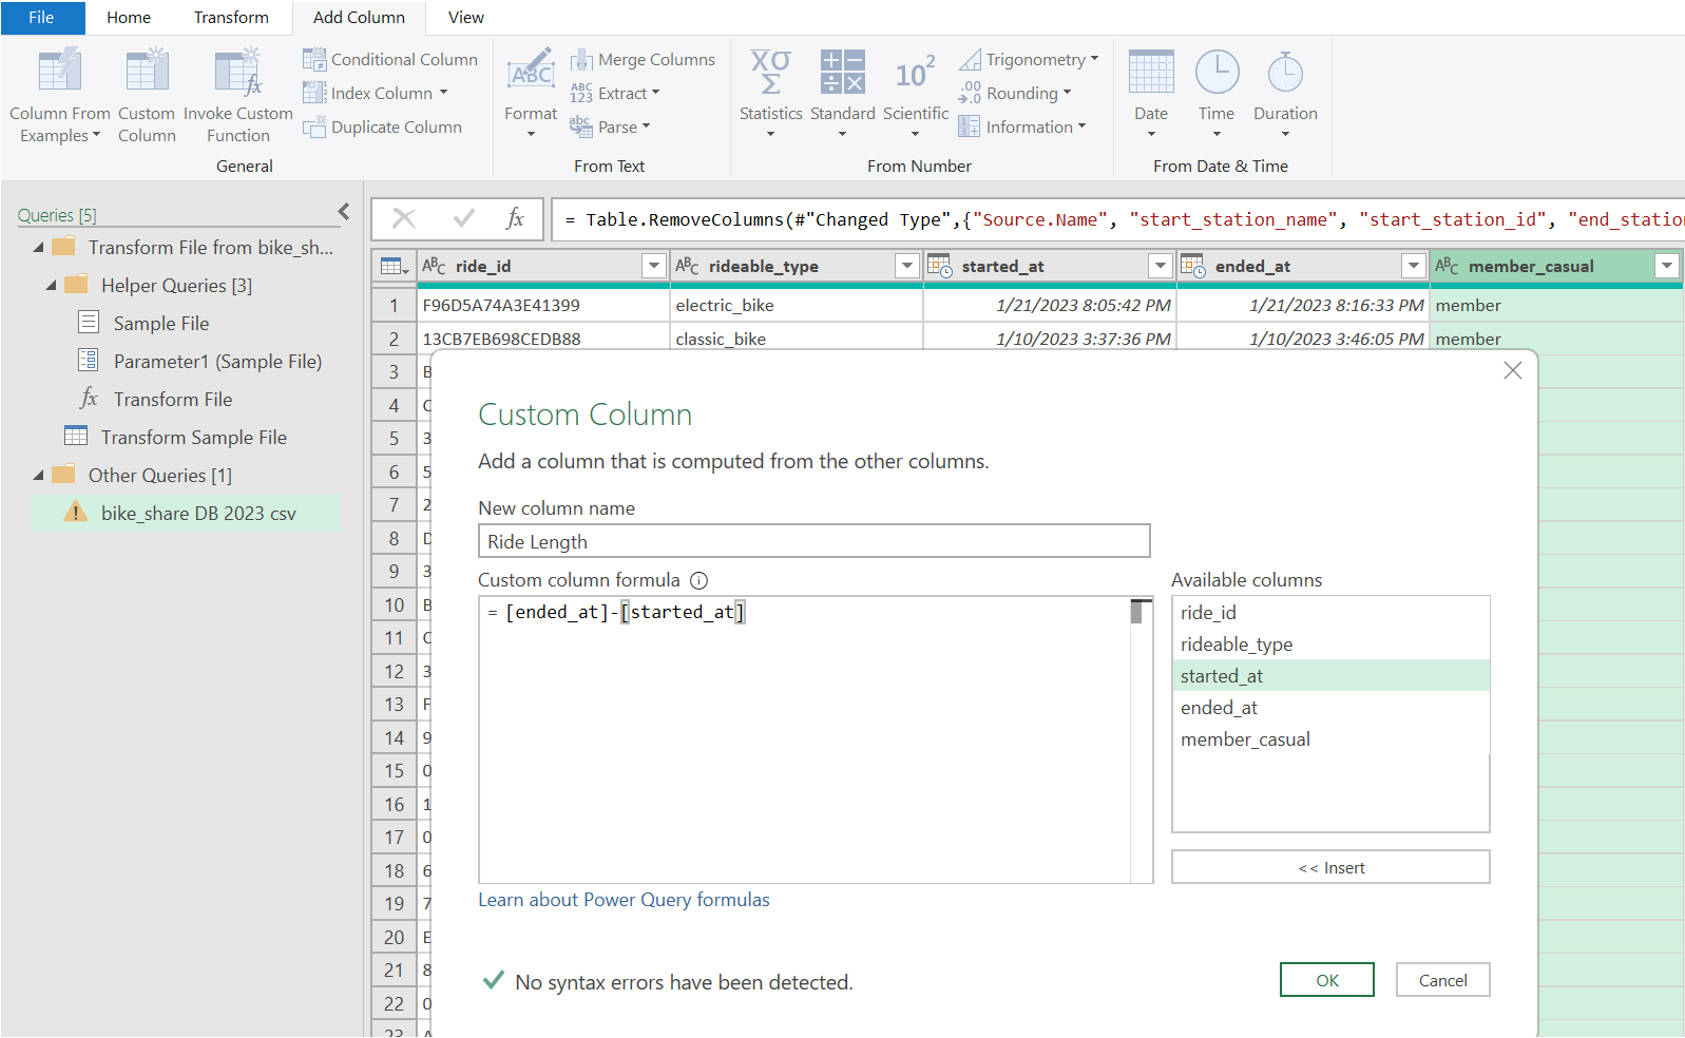
Here, on the ‘Add Column’ tab I clicked ‘Custom Column’ and calculated the ride length by subtracting ‘Ended Date’ column from ‘Started Date’ column. The result will be generated in a new separated column which contains the 'Ride length'.
Then, I selected 'Ride length' column and under Add Column tab > I clicked “Duration” then chose “Minutes”. Now it is generated a new column called ‘Minutes’, I deleted the ‘Ride Length’ column and renamed the ‘Minutes’ column into Ride Length’.
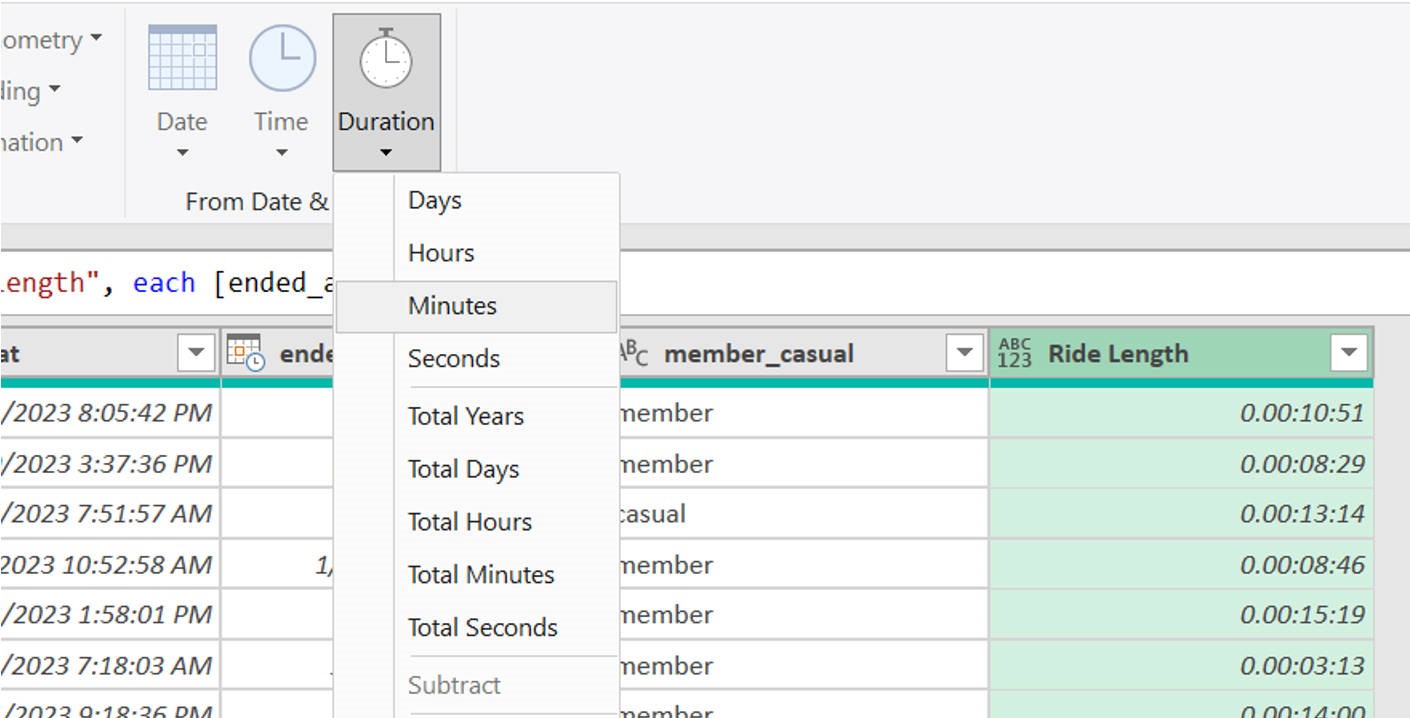
Next, I selected the ‘Started Date’ column and under ‘Add Column > Time’ I clicked ‘Time Only’ and renamed the new generated column into ‘Started Time’. I did the same with the ‘Ended Date’’ column and renamed a new column into ‘Ended Time’.
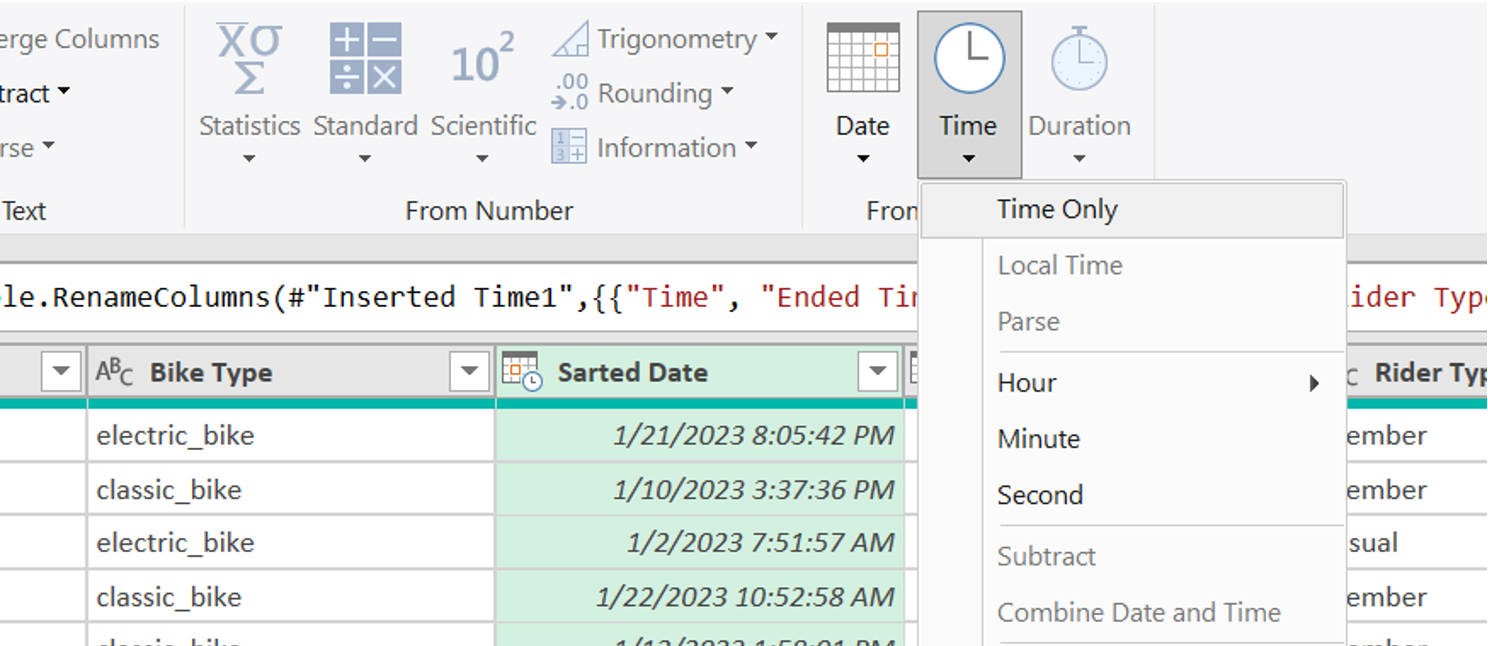
In the following screen I selected a ‘Started Date’ column and under the ‘Transform > Date’ I clicked ‘Date Only’. I did the same with the ‘Ended Date’ column. In this way, it transforms the ‘Started Date’ column into date only and removes time from it.

I also generated a new column called ‘Day of Week’ by following steps: choose ‘Started Date’ column then go to ‘Add Column > Date > Day > Day of Week. This column contains the day of week e.g. 1 is for Sunday, 2 is for Monday, 3 is Tuesday etc.
I transformed the ‘Started Time’ and ‘Ended Time’ columns into hour only: ‘Transform > Time > Hour > Start of Hour.
Here I finished transforming data and closed the ‘Combine & Transform Data’ window. The final Table include the following columns:
“Rider ID” – an identifier for each ride.
“Bike Type” — bike type used in this ride.
“Started Date” — start date and time of each ride.
“Ended Date” — end date and time of each ride.
“Day of Week” – day of week
“Rider Type” — member or casual
“Ride Length” – the duration of rider’s journey
“Started Time” – time when a rider started his/her journey
“Ended Time” – time when a rider finished his/her journey
At this step I count the number of NULL values by selecting a column header and applying a filter by marking ‘blank’ value only. In my case there were no NULL values. As I checked the data before all the processes, I found that NULL values were only in 'start_station_name', end_station_name, 'end_lat' and 'end_lng' columns. Since I don't do spatial analysis in this current project, therefore, I deleted those columns and in the final dataset there were no NULLs.
After the data cleaning and transformation under the 'Home' tab need to click 'Close & Load'
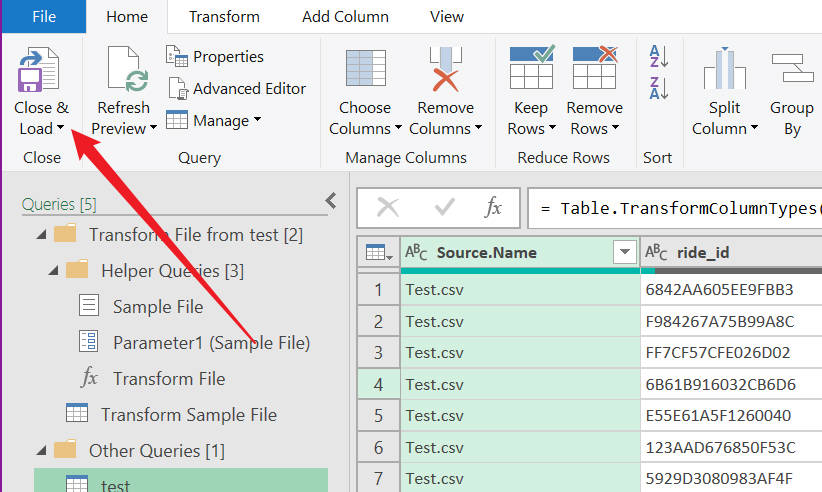
At this step Prepare phase is finished and next I’m going to start Analyse phase.
Analyse phase
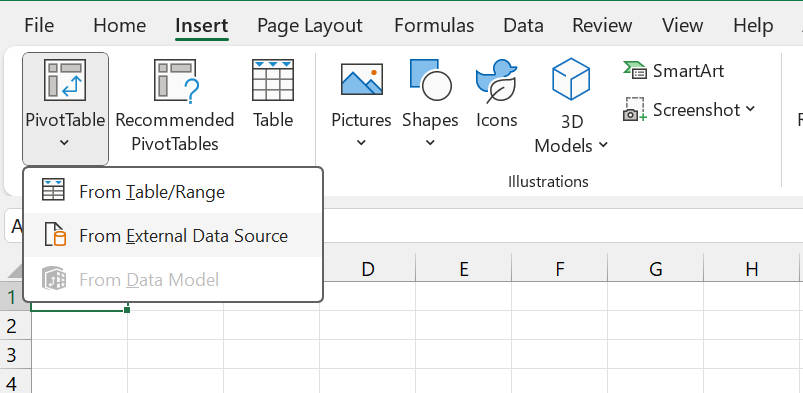
At this phase all the analyses and calculations were made through generating Pivot Tables and from those tables I made different charts. In order to insert a Pivot Table need to click Insert > Pivot Table > From External Data Source, then in a new window click 'Choose Connection...' and in the next window choose a Query that we just created.

These are some charts that I’ve made and at the end I created a dynamic Dashboard with all the calculation numbers and charts.
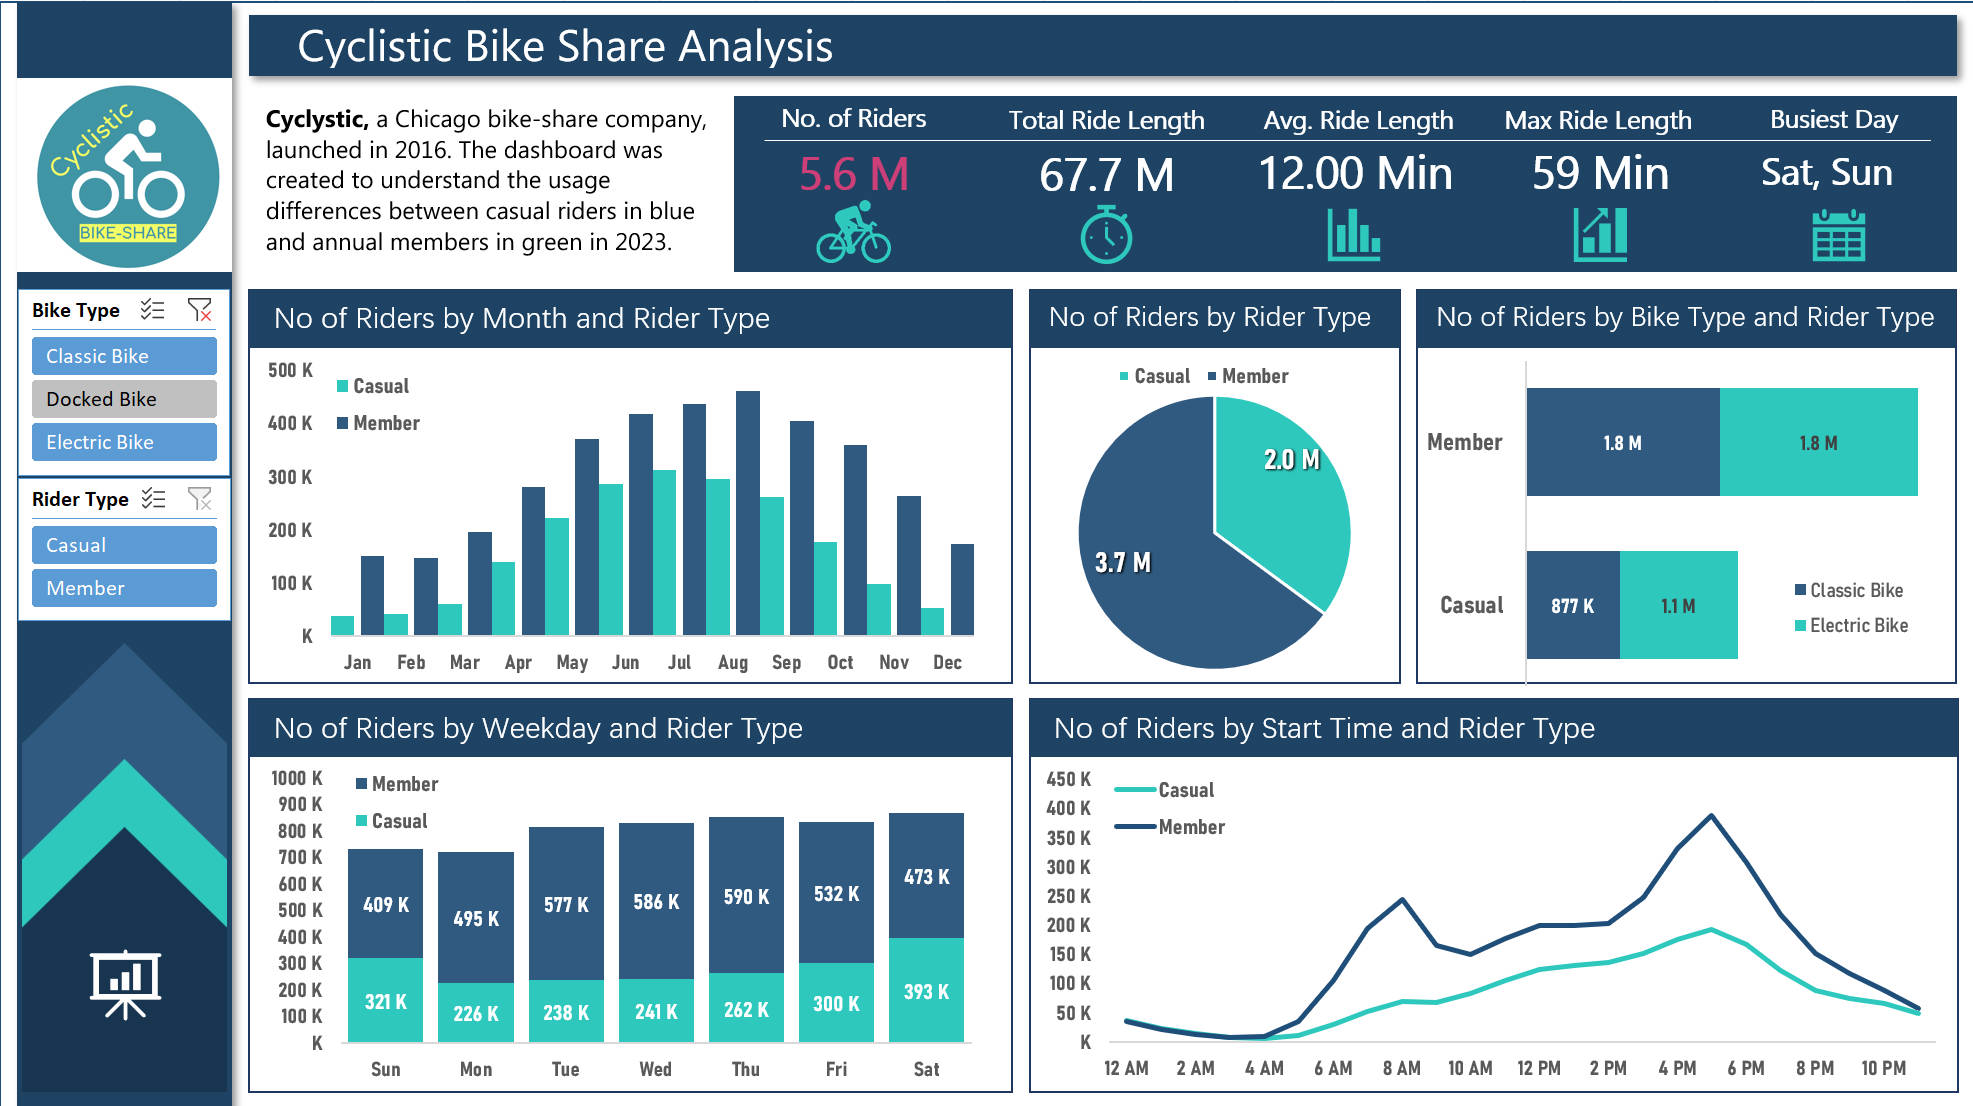
Here is the dynamic Dashboard (only a screenshot) that I've made in Excel, unfortunately, the file became too big (130 Mb), therefore I couldn't upload it and share:
Here are some findings that I discovered from the analysis process:
The total number of annual riders are 3.7 Mln. while for the casual riders the number is 2.1 Mln. The average trip duration for annual riders was 10.69 minutes, for the casual riders 14.78 minutes.
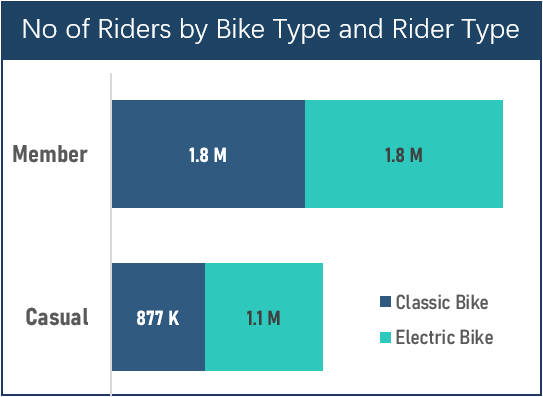
The most popular bike between both user types is the classic bike with 1.8 Mln users in both groups. For the electric bike the number of casual riders was 1.1 Mln. while for the annual members the number was 877 thousand. Annual members do not use the docked bikes.
As for the start time of using the bikes, annual members use the bikes mostly around 8 am and 5 pm and on weekdays probably use the bikes to get to their workplace or college.
On the other hand, casual members use the bikes mostly around 5 pm and on weekends, suggesting that they use the bikes for recreation in the evenings.
Act and Share Phase
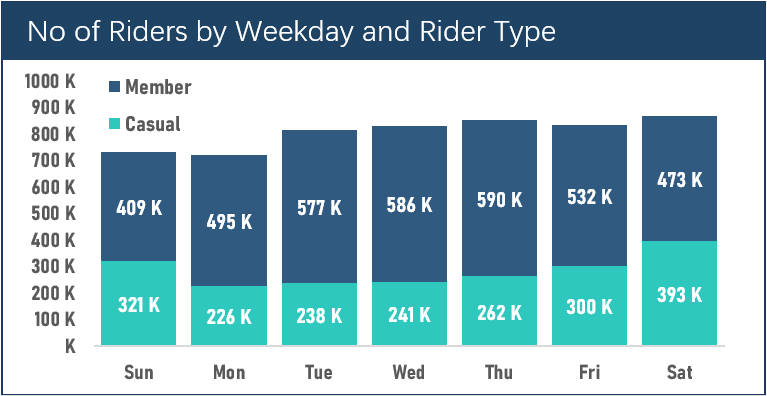
As it was previously stated, the director of marketing believes that the company’s future intends to design marketing strategies aimed at converting casual riders into annual members. Thus, this analysis was conducted to confirm or refute this hypothesis. From the results, we can see that the marketing director's hypothesis is correct. Casual riders prefer to use bicycles for longer periods, as well as for weekly trips. Casual riders tend to take longer trips on weekends. On the other hand, annual members ride more during weekdays, this could be explained by the fact that the annual members lean more on Cyclistic bikes as a way of transport in their daily lives.
Conclusion
The results of the analysis indicate different patterns of use of the bike sharing service among annual members and casual riders:
Casual riders exhibit higher weekend usage, with a longer average journey time, suggesting usage for recreational purposes.
Annual members use the bikes mostly on weekdays as a way of transportation in their daily lives.
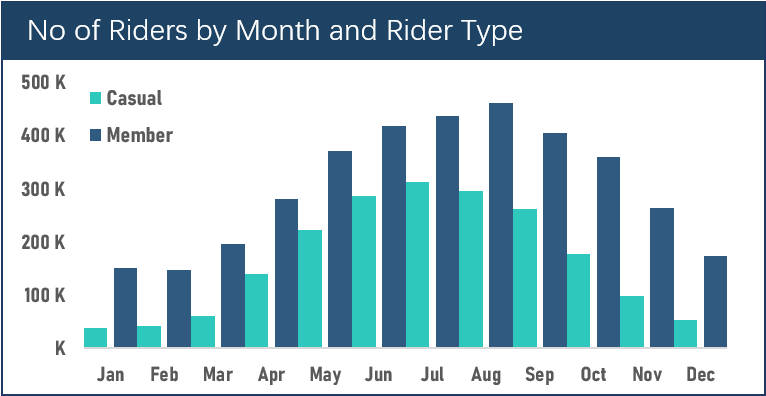
Both annual members and casual riders show a notable increase in service usage during the summer, followed by a decline in winter.
Based on these findings, the marketing analyst team recommends the following suggestions to the marketing director:
Elaborate targeted advertising campaigns aimed at turning casual riders into annual members, highlighting the benefits of their daily activities.
Run advertising campaigns mainly during the summer season.
Start promoting discounted bike sharing on weekdays to make them more popular.
Subscribe to my newsletter
Read articles from Dilshod Akhrorov directly inside your inbox. Subscribe to the newsletter, and don't miss out.
Written by
Dilshod Akhrorov
Dilshod Akhrorov
With prior experience in data analysis and a foundation in environmental science, I'm diving into data analytics and programming to unlock valuable insights and drive change. As an aspiring data enthusiast, I am eager to combine my strong technical skills with my passion for environmental science to contribute to the global progress of our data-driven world. I am organized, communicative, and a quick learner.