Sales Technical Report
 Emediong Harrison
INTRODUCTION:
This dataset provides detailed information about sales orders for an automobile company. Each row in the dataset represents a line item within an order, containing information about the order itself, the product, customer details, and sales performance.
Purpose Of Review:
The purpose of this review is to help develop skills in quickly interpreting data and communicating findings.
INITIAL OBSERVATIONS:
At first glance, I observed that:
The dataset contains 2,823 rows, representing a total of 2,823 orders placed between January 6th, 2003 (first recorded date) and May 31st, 2005 (last recorded date).
There appears to be a discrepancy in the “PRICEEACH” column. Entries with a value of “100” (presumably indicating a unit price of 100) might not be reflected correctly in the sales figures. Further investigation is needed.
The “orderline number” column likely acts as a unique identifier for each item within an order. It might represent the sequence in which items were added to the order.
The company deals in a wide range of products, including cars, buses, trucks, planes, ships, trains, and motorcycles.
The sales dataset contains both categorical and numerical variables as well as different data types.
Some columns with their variables and data types are:
ORDER NUMBER: This column holds numerical variables with an integer data type
QUANTITY ORDERED: This column holds numerical variables with an integer data type
PRICE EACH: This column holds numerical variables with a float data type
SALES: This column holds numerical variables with a float data type.
ORDER DATE: This column holds numerical variables with a Date data type.
STATUS: This column holds categorical variables with a string data type.
YEAR_ID: This column holds categorical variables with an integer data type
PRODUCT LINE: This column holds categorical variables with a string data type
MSRP: This column holds numerical variables with a float data type
DEAL SIZE: This column holds categorical variables with a string data type
DATA EXPLORATION
There are a total of 307 unique orders, each representing an instance where a customer placed an order. Each of these unique orders includes multiple product items.
Between January 6, 2003, and May 31, 2005, a cumulative quantity of 99,067 products was ordered. Of these, 91,403 units have been successfully shipped, while the remaining 7,664 units are in various statuses such as canceled, on hold, resolved, disputed, or in process.
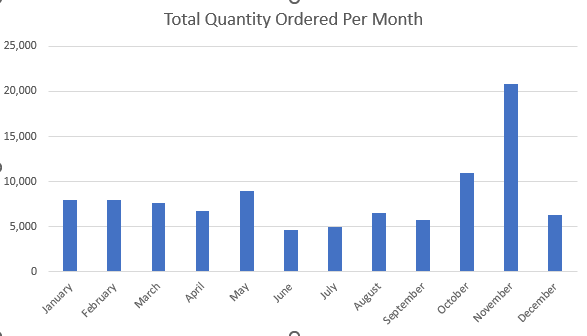
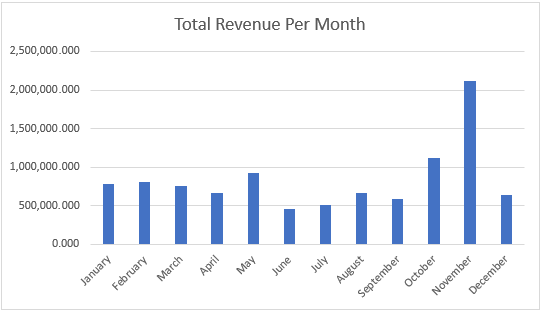
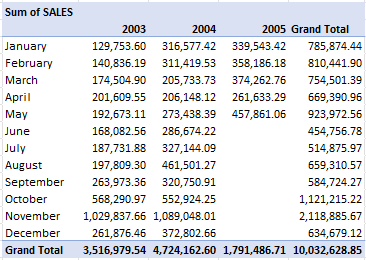
The company has generated approximately $10 million in total revenue, with peak sales typically occurring in the fourth quarter, particularly in November.


Sales appear lower in 2005 because our data only extends up to May 31, 2005. Consequently, we lack the complete sales records for the entire year.

However, from the table above we can say that 2005 might likely be our best performing year because the revenue from January to May exceeds that of previous years.
CONCLUSION
To further this analysis, I can investigate the cause of the sales spike observed in November. This involves pinpointing the top-selling products based on both quantity and revenue, as well as identifying the country and city where these products achieved the highest sales. Additionally, we can examine the dataset to identify our top customers, analyzing their purchasing behaviors, including buying frequency, order quantities, and expenditure patterns.
This article is written in fulfillment of my Task in the ongoing HNG internship program. Click on the links below to learn more about the program. https://hng.tech/internship, https://hng.tech/hire.
Subscribe to my newsletter
Read articles from Emediong Harrison directly inside your inbox. Subscribe to the newsletter, and don't miss out.
Written by

Emediong Harrison
Emediong Harrison
I am a Data Analyst who loves the planet