Understanding Distributed Tracing for Microservices
 Srijan Rastogi
In the ever-evolving landscape of software development, micro-services architectures have become a dominant paradigm. These architectures break down monolithic applications into smaller, independent services, fostering agility and scalability. However, with this newfound independence comes a challenge: maintaining observability. Traditional monitoring tools often struggle to track requests as they weave through a complex web of micro-services. This is where distributed tracing steps in, acting as a powerful tool to illuminate the intricate path of data in a micro-service ecosystem.
The Footprints of Execution
Tracing, in essence, is the process of recording the execution path of a request or transaction within an application. Logs, a fundamental monitoring tool, offer snapshots of events at specific points in time. Tracing, on the other hand, builds a narrative by stitching these snapshots together, providing a holistic view of the request’s journey. This narrative is composed of “spans,” which represent individual units of work within the application. Spans are often associated with specific functions or service calls, and they capture key details like timestamps, call duration, and any relevant error messages.
Distributed Tracing: Bridging the Microservice Divide
While tracing offers valuable insights within a single service, the real power lies in distributed tracing. This specialised approach extends tracing across service boundaries, enabling us to map the flow of a request as it hops between multiple micro-services. Distributed tracing relies on a unique identifier, often called a “trace ID,” to correlate spans across services. With this ID, we can visualise the entire request lifecycle, pinpointing bottlenecks, identifying latency issues, and diagnosing errors more effectively.
The Observability Advantage: Shining a Light on Microservice Health
Distributed tracing significantly enhances observability in micro-service architectures. Here’s how:
Root Cause Analysis: When an issue arises, logs alone often offer a fragmented picture. Distributed tracing, however, allows us to trace the request back to its origin, pinpointing the exact micro-service responsible for the problem. This streamlines troubleshooting and reduces time spent chasing ghosts in the codebase.
Performance Optimisation: Distributed traces provide detailed timing information for each service involved in a request. By identifying slow spans, developers can focus optimisation efforts on the most critical areas, leading to a more responsive application.
Dependency Mapping: Distributed tracing maps how micro-services interact, revealing dependencies and potential bottlenecks. This knowledge empowers developers to identify architectural improvements to optimize the overall system flow.
Service Health Monitoring: Tracing data can be aggregated to monitor the health and performance of individual micro-services. By analysing metrics like average latency and error rates, teams can proactively identify potential issues and ensure service resilience.
Debugging at Scale: Micro-service architectures often involve numerous services and complex interactions. Distributed tracing provides a level of context and visibility that is invaluable for debugging intricate issues across the entire system.
Considerations and Trade-offs
While distributed tracing offers a abundance of benefits, it’s crucial to acknowledge the associated considerations:
Performance Overhead: Introducing tracing adds a layer of complexity to your application. While the impact is typically minimal, careful configuration and potential sampling strategies may be necessary to balance observability needs with performance.
Storage and Management: The volume of data generated by tracing can be significant. Choosing the right storage and analysis tools becomes essential to ensure efficient data handling and avoid getting bogged down in a sea of information.
Implementation Effort: Integrating tracing libraries and configuring tools requires some development effort. However, this investment often pays off in the long run with improved application maintainability.
Building the Lighthouse: Tools for Distributed Tracing
Several open-source and commercial tools are available to facilitate distributed tracing. Popular choices include:
Jaeger: A widely adopted open-source tracing platform offering comprehensive features and a user-friendly UI.
Zipkin: Another popular open-source option known for its ease of use and scalability.
Datadog: A comprehensive monitoring platform with built-in distributed tracing capabilities.
Honeycomb: A cloud-based platform that excels in analysing distributed trace data and providing actionable insights.
Embracing the Power of Distributed Tracing
In the intricate world of micro-services, distributed tracing is no longer a luxury; it’s a necessity. By shedding light on the intricate flow of data across services, distributed tracing empowers developers to build robust, performant, and easily maintainable applications. As your micro-service architecture evolves, consider embracing distributed tracing to gain a deeper understanding of your system’s inner workings and ensure a bright future for your application.
Distributed Tracing in GoFr: Unveiling the Secrets of Microservice Performance
In the intricate world of micro-services, where applications are fragmented into independent, collaborating services, troubleshooting performance bottlenecks and pinpointing errors can be a daunting task. Distributed tracing emerges as a potent solution, offering a bird’s-eye view of request execution across your entire distributed system. Let’s delve into the essence of distributed tracing in GoFr, a popular Golang framework, and illuminate the multifaceted benefits it bestows upon developers.
GoFr’s distributed tracing meticulously tracks the complete lifecycle of a request as it traverses various services within a micro-services architecture. It injects a unique identifier, known as a “Correlation-ID”, into each request, meticulously recording timestamps and relevant details at each service interaction. This meticulous data collection enables the construction of a visual representation, a trace, that meticulously maps the request’s journey, exposing potential performance issues and error sources.
Automated Tracing in GoFr
GoFr automatically exports traces for all requests and responses. GoFr uses OpenTelemetry , a popular tracing framework, to automatically add traces to all requests and responses.
Automatic Correlation ID Propagation:
When a request enters your GoFr application, GoFr automatically generates a correlation-ID X-Correlation-ID and adds it to the response headers. This correlation ID is then propagated to all downstream requests. This means that you can track a request as it travels through your distributed system by simply looking at the correlation ID in the request headers.
Introduction to GoFr
Before moving ahead, a brief knowledge of GoFr would be required. You can visit the official website.
To get familiar with micro-service implementation with GoFr, you can read the following brief articles:
Configuration & Usage:
GoFr has support for following trace-exporters:
1. Zipkin:
To see the traces install zipkin image using the following Docker command:
docker run --name gofr-zipkin -p 2005:9411 -d openzipkin/zipkin:latest
Add Tracer configs in .env file, your .env will be updated to
# tracing configs
TRACE_EXPORTER=zipkin
TRACER_HOST=localhost
TRACER_PORT=2005
NOTE: If the value of
TRACER_PORTis not provided, GoFr uses port9411by default.
Open zipkin and search by TraceID (correlationID) to see the trace.

2. Jaeger:
To see the traces install jaeger image using the following Docker command:
docker run -d --name jaeger \
  -e COLLECTOR_OTLP_ENABLED=true \
  -p 16686:16686 \
  -p 14317:4317 \
  -p 14318:4318 \
  jaegertracing/all-in-one:1.41
Add Jaeger Tracer configs in .env file, your .env will be updated to
# tracing configs
TRACE_EXPORTER=jaeger
TRACER_HOST=localhost
TRACER_PORT=14317
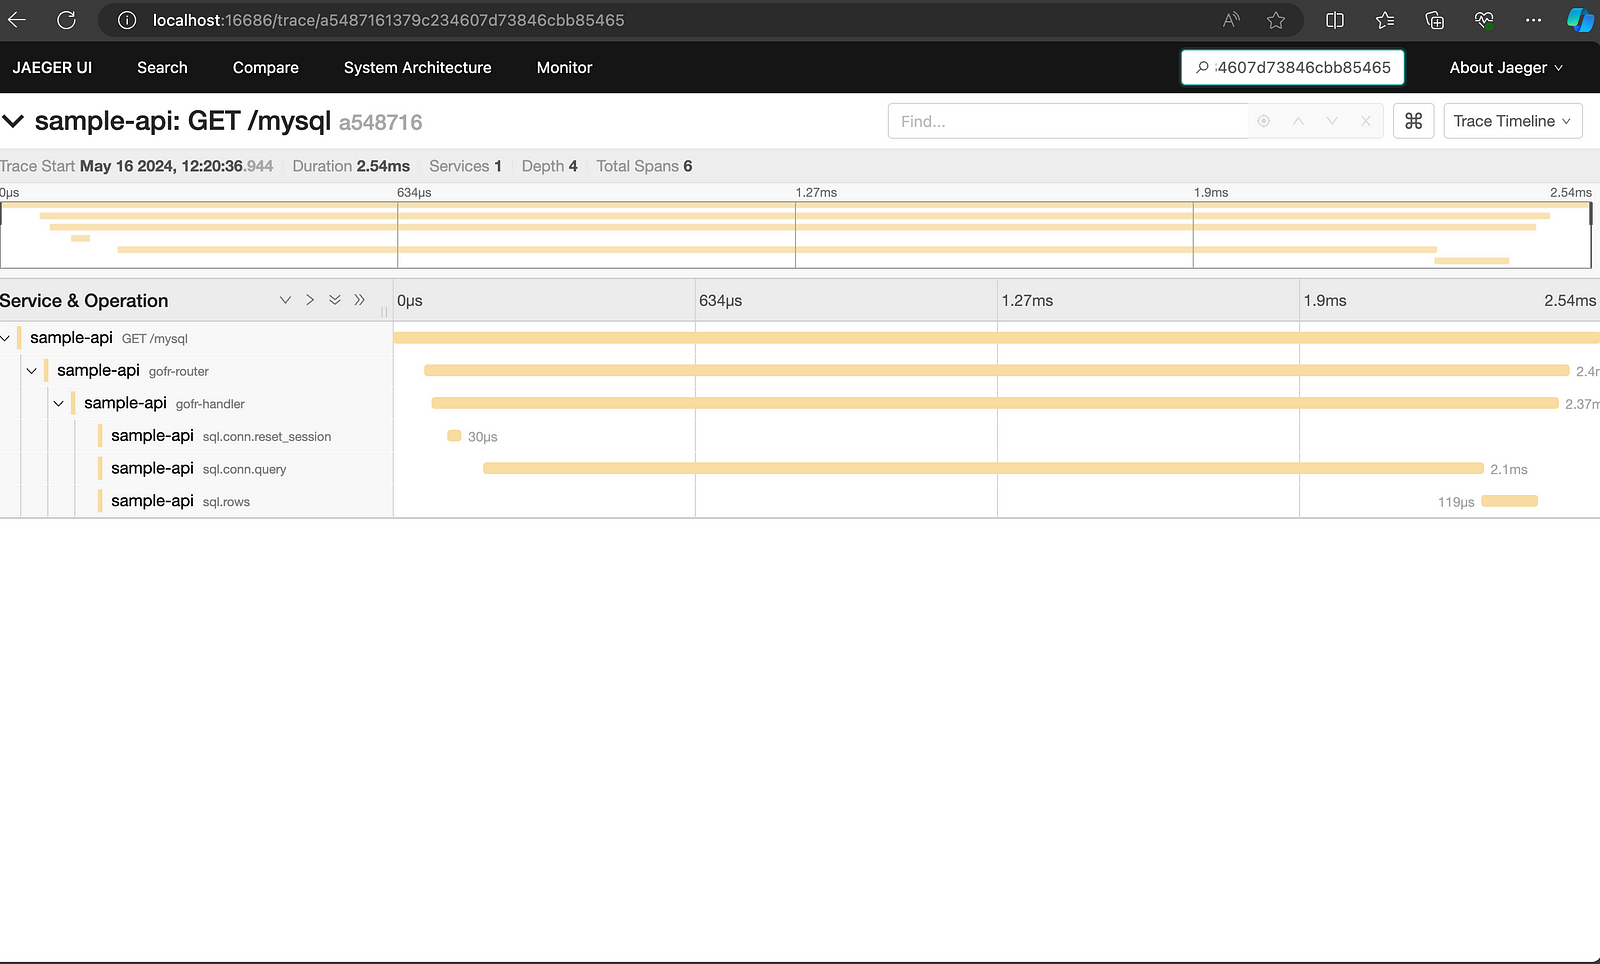
Open jaeger and search by TraceID (correlationID) to see the trace.

3. GoFr Tracer:
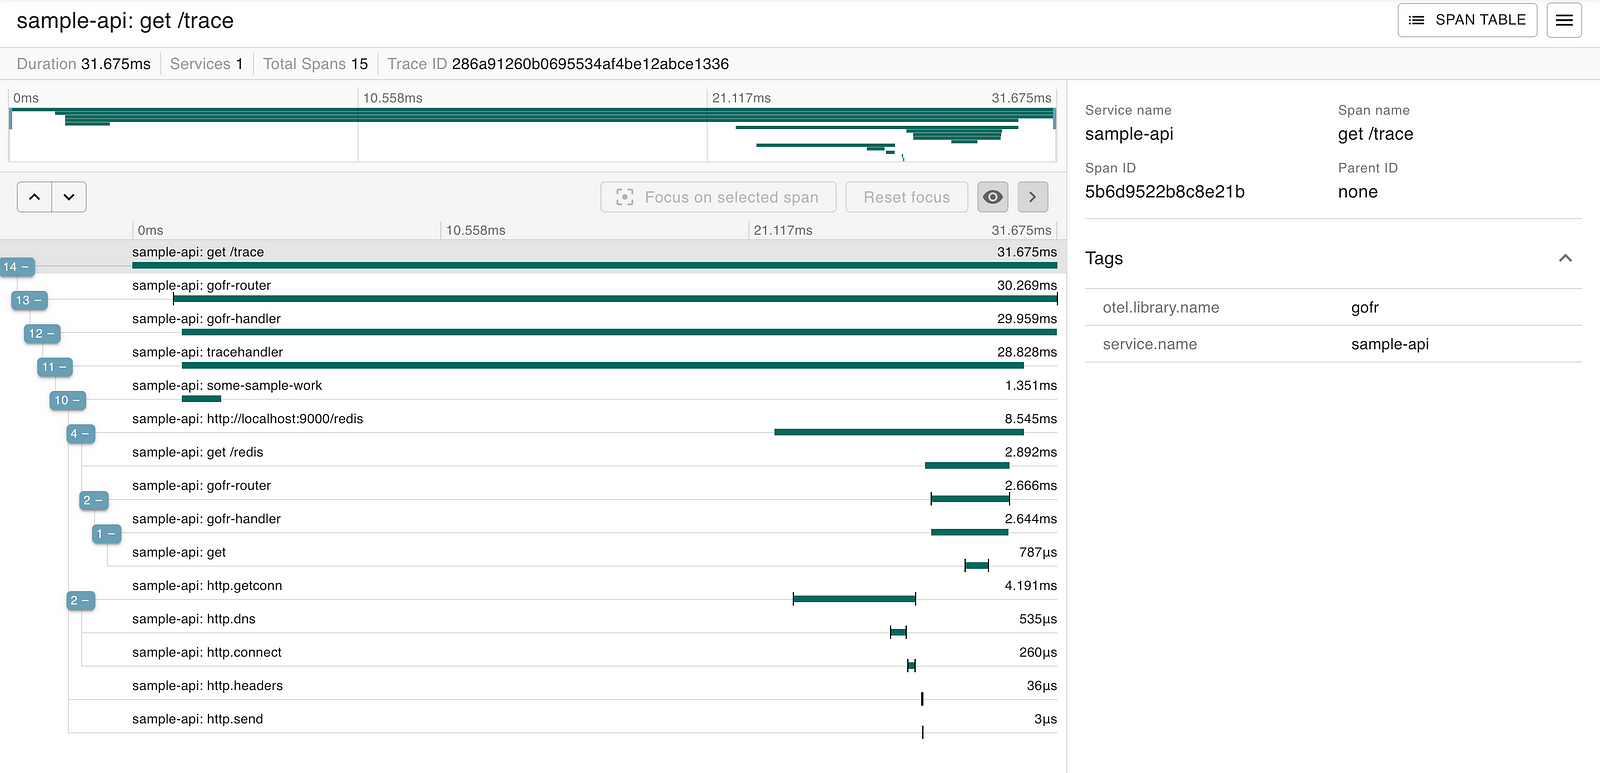
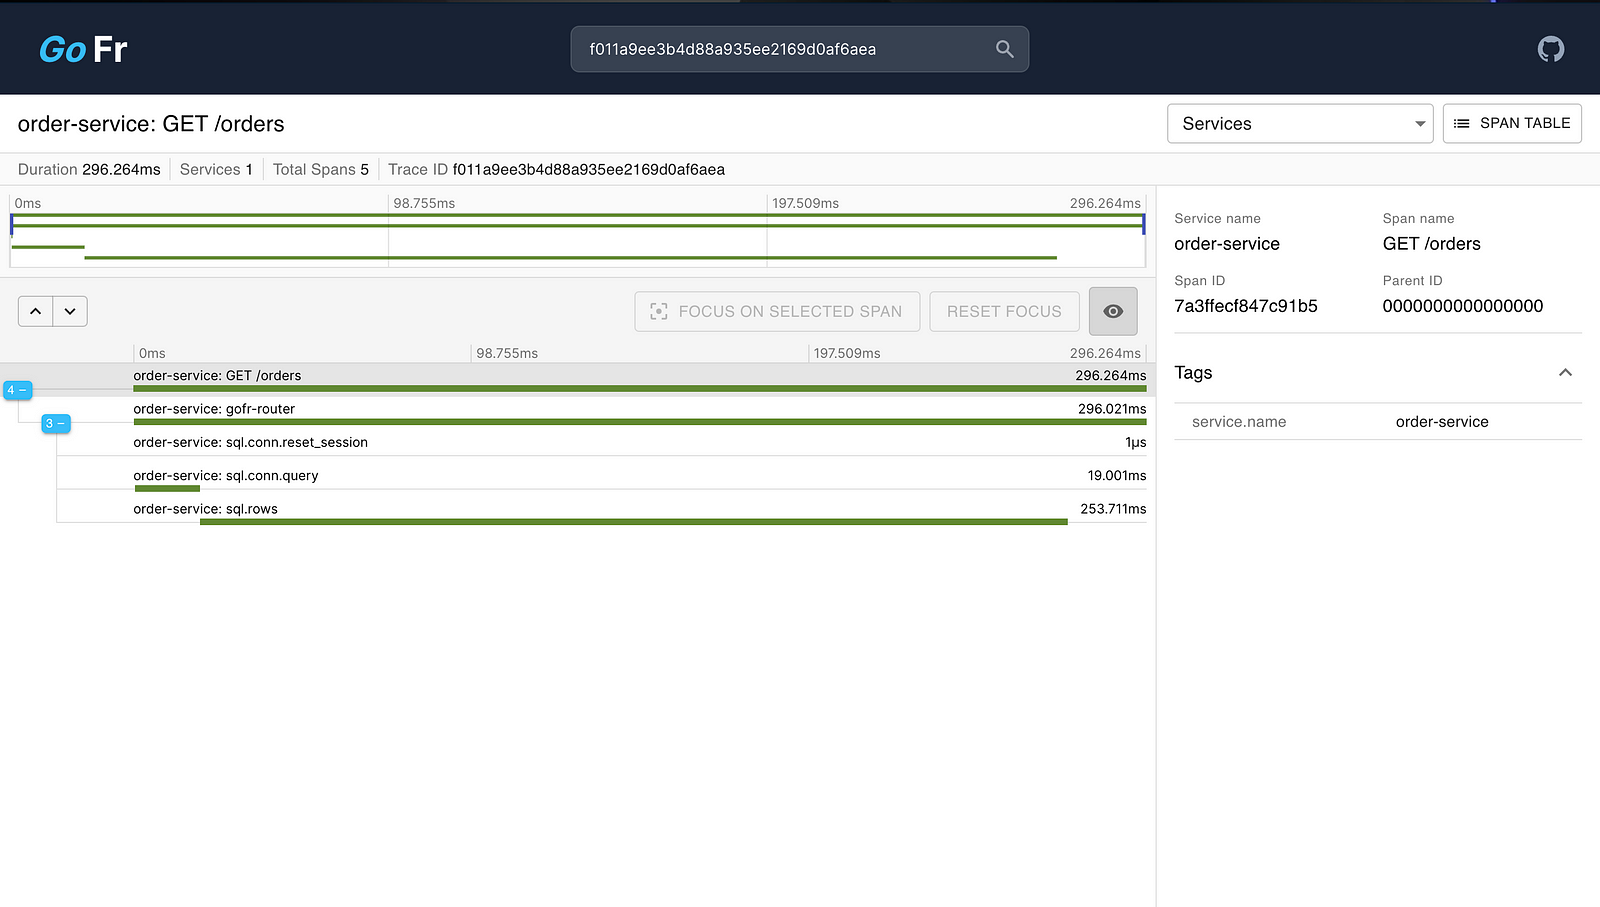
GoFr tracer is GoFr’s own custom trace exporter as well as collector. You can search a trace by its TraceID (correlationID) in GoFr’s own tracer service available anywhere, anytime.
Add GoFr Tracer configs in .env file, your .env will be updated to
# tracing configs
TRACE_EXPORTER=gofr
Open gofr-tracer and search by TraceID (correlationID) to see the trace.

Custom Spans In Tracing
While GoFr’s built-in tracing offers valuable application behaviour insights, sometimes you crave even finer details. This is where custom spans come into play.
In essence, custom spans act as a magnifying glass, allowing you to zoom in on the intricate details of your application’s performance. This granular insight empowers you to make informed decisions about optimisation, troubleshooting, and overall application health.
Usage
To add a custom trace to a request, GoFr context provides Trace() method, which takes the name of the span as an argument and returns a trace.Span.
func MyHandler(c context.Context) error {
    span := c.Trace("my-custom-span")
    defer span.Close()

    // Do some work here
    return nil
}
The Power of Distributed Tracing in GoFr
By incorporating distributed tracing, you unlock a treasure trove of advantages that significantly enhance your GoFr microservices:
Pinpoint Performance Bottlenecks: Distributed tracing paints a vivid picture of how long each service call takes within a request’s lifecycle. This pinpoints performance inefficiencies, allowing you to focus your optimisation efforts on the most impactful areas.
Expedite Error Localisation: When an error occurs, traces act as a time machine, rewinding the request’s execution and revealing precisely where the error originated. This expedites troubleshooting and streamlines error resolution.
Enhanced Debugging: Traces provide a detailed narrative of request execution, exposing correlations and dependencies between services. This invaluable information empowers developers to reason effectively about complex workflows and pinpoint issues more quickly.
Improved Service-Level Optimisation: Distributed tracing empowers you to assess the performance of individual services in isolation, helping to identify areas for service-specific optimisation.
Profound Visibility: Traces offer a comprehensive overview of your entire microservices ecosystem, revealing service interactions, dependencies, and potential bottlenecks. This holistic view fosters data-driven decision-making for infrastructure and code improvements.
By embracing distributed tracing in GoFr, you unlock a potent tool to navigate the complexities of microservices development, ensuring your applications run smoothly, efficiently, and deliver exceptional user experiences.
Beyond the Basics: Advanced Techniques
Propagate Context: Ensure the trace context, encapsulating the trace ID and other tracing data, is propagated across service calls. This guarantees that the complete request is traced seamlessly across all microservices.
Distributed Sampling: With large-scale applications, tracing every request might become overwhelming. Distributed sampling techniques can be implemented to selectively trace a subset of requests, ensuring valuable insights while optimising resource utilisation.
Error Handling: Develop robust error handling mechanisms within your tracer to capture and propagate error information within traces, facilitating the identification of service failures.
Beyond the Technical: A Call to Action
However, the true strength of distributed tracing lies not just in its technical prowess, but in the cultural shift it fosters. It encourages collaboration and communication between teams responsible for different microservices. By sharing traces and working together to analyze them, teams can develop a deeper understanding of the entire system, fostering a shared sense of ownership and responsibility.
This collaborative approach, empowered by the insights gleaned from distributed tracing, paves the way for a more agile, efficient, and productive microservices development process. As your GoFr-based microservices architecture evolves, distributed tracing remains an indispensable tool for ensuring its continued success.
Additional Considerations
While this article has focused on the fundamentals of distributed tracing in GoFr, several additional factors merit consideration:
Security: Distributed tracing can potentially expose sensitive data within traces. Implement robust security practices, such as data masking and access controls, to mitigate risks.
Monitoring and Alerting: Leverage your chosen tracing backend to establish monitoring and alerting mechanisms. Set up alerts to be notified of potential performance issues or errors identified through traces.
Continuous Integration and Deployment (CI/CD): Integrate distributed tracing into your CI/CD pipeline to ensure consistent visibility and performance optimisation throughout the development lifecycle.
Community Resources: The OpenTelemetry community offers a wealth of resources, including documentation, tutorials, and best practices. Actively engage with the community to enhance your understanding and implementation of distributed tracing.
By taking these considerations into account, you can effectively leverage distributed tracing to elevate the performance, maintainability, and overall health of your GoFr micro-services.
If you like GoFr please support us by giving the repository a 🌟
Happy Coding 🚀
Thank you for reading until the end. Before you go:
Please consider liking and following! 👏
You can also go through my other article on Monitoring GoLang APIs
Subscribe to my newsletter
Read articles from Srijan Rastogi directly inside your inbox. Subscribe to the newsletter, and don't miss out.
Written by

Srijan Rastogi
Srijan Rastogi
GoLang apprentice by day, sensei by night. Learning and building cool stuff, one commit at a time.