Analyzing Titanic dataset and first-glance observations
 Chepkirui Dorothy
This analysis is part of the HNG internship series.
The dataset used for this study is the Titanic dataset, downloaded from Kaggle. The file consists of three datasets, but this study will only focus on gender_submission.csv file. After downloading, the first step is to load the dataset using Pandas.
import pandas as pd
titanic = pd.read_csv('titanic/gender_submission.csv')
print(titanic.head())
The output is as follows:
   PassengerId  Survived
0          892         0
1          893         1
2          894         0
3          895         0
4          896         1
<class 'pandas.core.frame.DataFrame'>
RangeIndex: 418 entries, 0 to 417
From the results above, there were 418 passengers on the Titanic, whereby those who survived were marked as 1, and those who did not survive as 0.
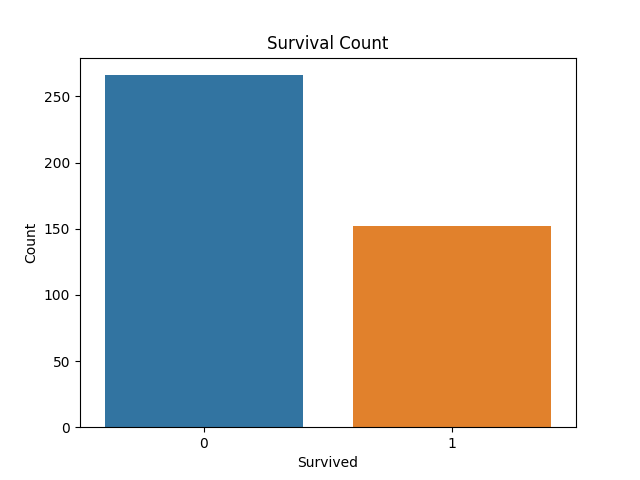
This analysis used seaborn to analyze further the count of those who survived vs those who did not.
import seaborn as sns
import matplotlib.pyplot as plt

sns.countplot(x='Survived', data=titanic)
plt.xlabel('Survived')
plt.ylabel('Count')
plt.title('Survival Count')
plt.show()

From the plot above, many people did not survive the Titanic, compared to those who did.
To determine the exact number of people who survived, you can filter the data as follows:
print(len(titanic[titanic['Survived'] == 1]))
print(len(titanic[titanic['Survived'] == 0]))
152
266
From the results above, 152 people survived, while 266 did not survive the Titanic.
This study's limitation is the limited number of variables. Further analysis is needed to check on the correlation between survival and other external factors like age.
Check out more about the HNG here or here.
Happy data analysis.
Subscribe to my newsletter
Read articles from Chepkirui Dorothy directly inside your inbox. Subscribe to the newsletter, and don't miss out.
Written by

Chepkirui Dorothy
Chepkirui Dorothy
I am a self taught software developer in Kenya. Django, html and css