Analyzing Auto Insurance Data for Better Risk Management and Customer Engagement
 Iman Adeko
Project Overview
Splendor Analytics Insurance is a company specializing in offering a variety of insurance products to its customers. The company's portfolio includes auto insurance, which covers losses or damages related to vehicles. The provided dataset contains anonymized information about the policyholders, their vehicles, and their claim histories. The goal of this project is to analyze this dataset to uncover insights that can help Splendor Analytics Insurance improve its services, optimize premiums, and reduce claim costs.
Splendor Analytics Insurance aims to enhance its auto insurance division by leveraging data analysis to:
Identify patterns in claim frequencies and amounts.
Understand the demographics and characteristics of high-risk and low-risk policyholders.
Optimize premium pricing models based on risk factors.
Develop targeted marketing strategies to attract and retain customers.
Data Source
The dataset provided is a single CSV file, accessible here. It contains information on 37,543 policyholders and includes features such as age, gender, marital status, car details, and claim history. The data dictionary for the dataset can be found here.
Data Cleaning and Manipulation
The data cleaning and manipulation process was carried out in Microsoft Excel, following these steps:
The dates in the birthdate column were inconsistent. Some dates used forward slashes instead of hyphens, and some were in text format. I corrected these issues using the text-to-columns feature under data tools.
I added an age column, which I calculated by subtracting each policyholder's year of birth from the current year.
=YEAR(TODAY())-YEAR([@birthdate])I added another column,
age category, to group the policyholders' ages into the following categories: Young Adults (less than 29 years old), Middle-aged Adults (30 to 49 years old), and Older Adults (50 years and above).=IF([@age]<=29,"Young Adult", IF([@age]<=49,"Middle-aged Adult", "Old Adult"))I added two columns:
car_ageandcar_age_category. The car_age is calculated by subtracting the car_year (the year the car was built) from the current year. Thecar_age_categorygroups thecar_ageinto these categories: New car (less than 10 years old), Modern car (10-19 years old), Vintage car (20-29 years old), Classic car (30-44 years old), and Antique car (45 years and above).# car_age =2024-[@[car_year]] # car_age_category =IF([@[car_age]]<10,"New car", IF([@[car_age]]<20,"Modern car", IF([@[car_age]]<30,"Vintage car", IF([@[car_age]]<45,"Classic car", "Antique car"))))I grouped the household income of policyholders into three categories in a new column,
household_income_category. These are the categories: Low Income (less than or equal to $100K), Middle Income (between $100K and $200K), and High Income (above $200K).=IF([@[household_income]]<=100000,"Low Income", IF([@[household_income]]<=200000,"Middle Income", "High Income"))
Exploratory Data Analysis
There were 37,543 policyholders registered with the company.
Policyholders' ages ranged from 22 to 75 years.
The maximum number of children driving was 3.
The ages of policyholders' cars ranged from 11 to 115 years.
Claim frequencies ranged from 0 to 3, with an average of 0.51.
The total claim amount was around $1.88 billion, with an average claim of $50,000.
Household incomes ranged from $45,000 to $250,000.
Key Questions to Answer
Claim Frequency and Amount Analysis
- What are the average claim frequencies and amounts for different demographic groups (e.g., age, gender, marital status)?
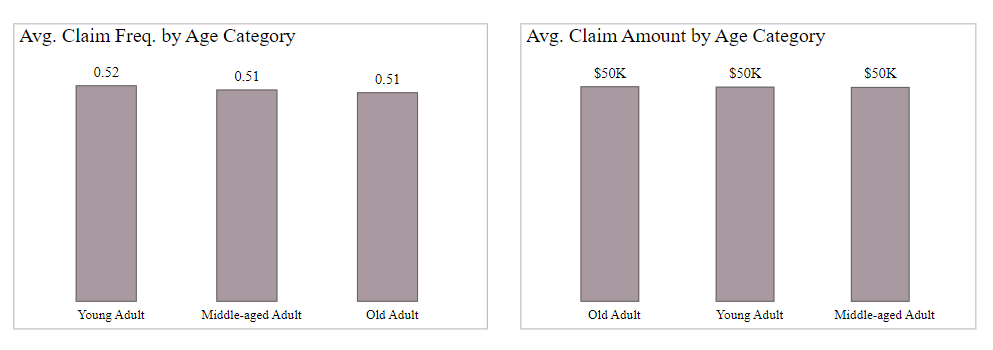

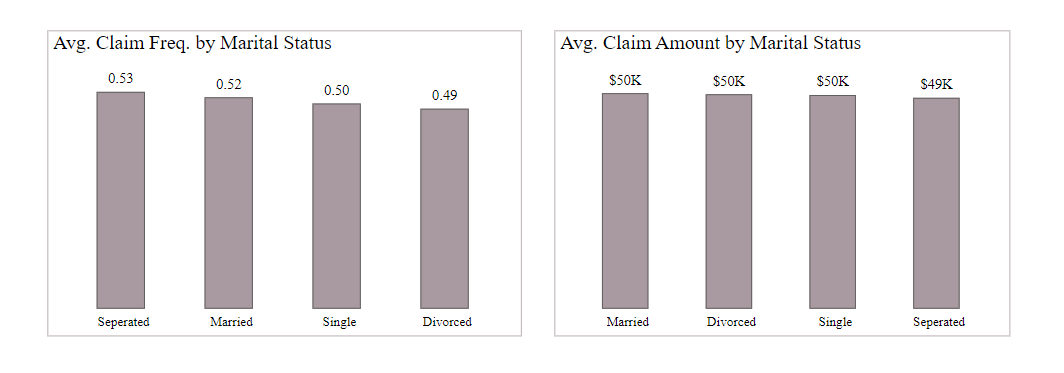
Across all demographic groups (age, gender, and marital status), the average claim amount for policyholders is about $50K, except for those who are separated, where it is $49K.
The average claim frequency is slightly higher in young adults (0.52) compared to middle-aged and older adults (0.51). This might be because young adults have less driving experience and are more likely to be distracted by their phones while driving.
There is no difference in the average claim frequency between males and females.
According to the data, separated and married people are more likely to file claims than single and divorced people.
- Are there any specific vehicle characteristics (e.g., make, model, year) that correlate with higher claim frequencies or amounts?
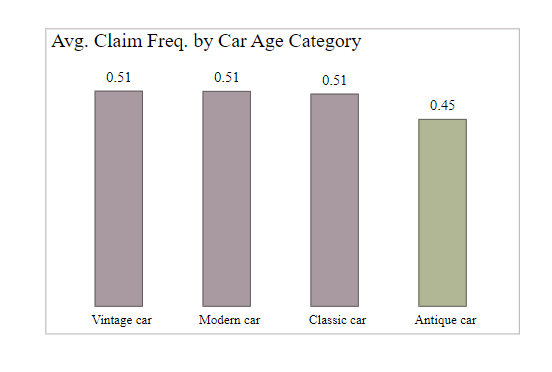
Owners of non-antique cars are more likely to file claims. This may be due to driving habits, as antique cars are usually driven only on special occasions, reducing their exposure to risk.
Risk Assessment
Which factors (e.g., household income, education level, coverage zone) are most indicative of high-risk policyholders?
Can we identify any common characteristics among policyholders who make frequent claims?
High risk policyholders are individuals that are more likely to file claims or incur losses, resulting in higher costs for the insurer.
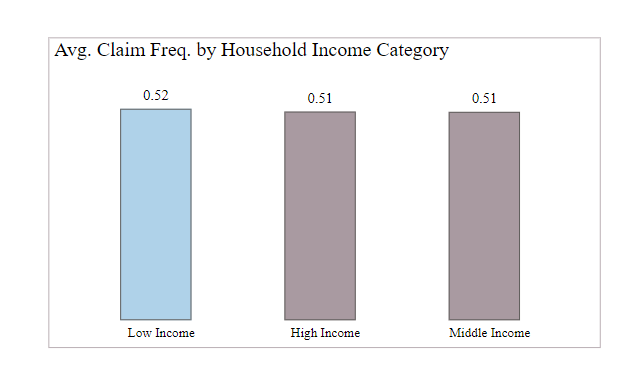
Low-income policyholders are more likely to file claims because they often drive older, high-mileage cars that break down more frequently. Financial constraints can also cause them to delay repairs, leading to bigger problems and higher repair costs when they finally file a claim.
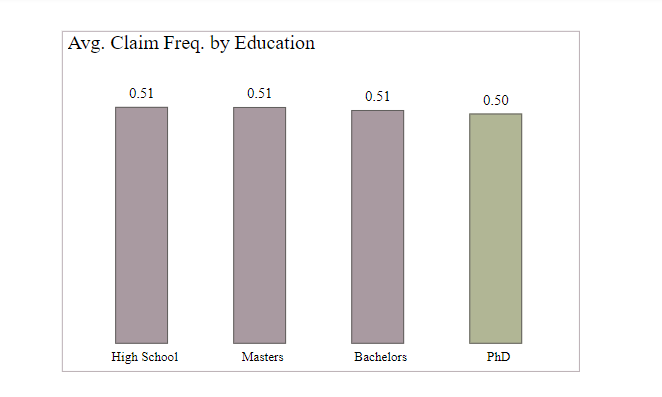
Policyholders who haven't completed their PhDs are more likely to file claims than those who have. This aligns with the common assumption that higher education translates to lower risk.
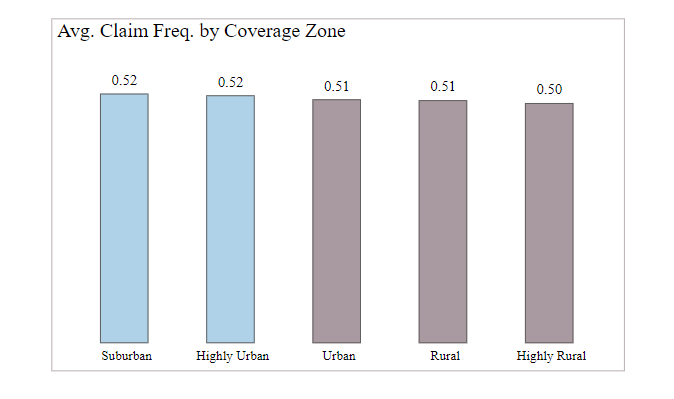
Policyholders living in urban and suburban areas are more likely to file claims. These areas tend to have higher traffic density, increasing the chance of accidents. Additionally, urban and suburban areas often have higher crime rates, raising the risk of car theft or vandalism, which would also require filing a claim.
Customer Segmentation and Marketing
What are the key characteristics of policyholders with low claim frequencies and high household incomes?
How can we segment the customer base to identify high-value customers for targeted marketing campaigns?
High-value customers are those policyholders that come from high income households and are less likely to file for claims.
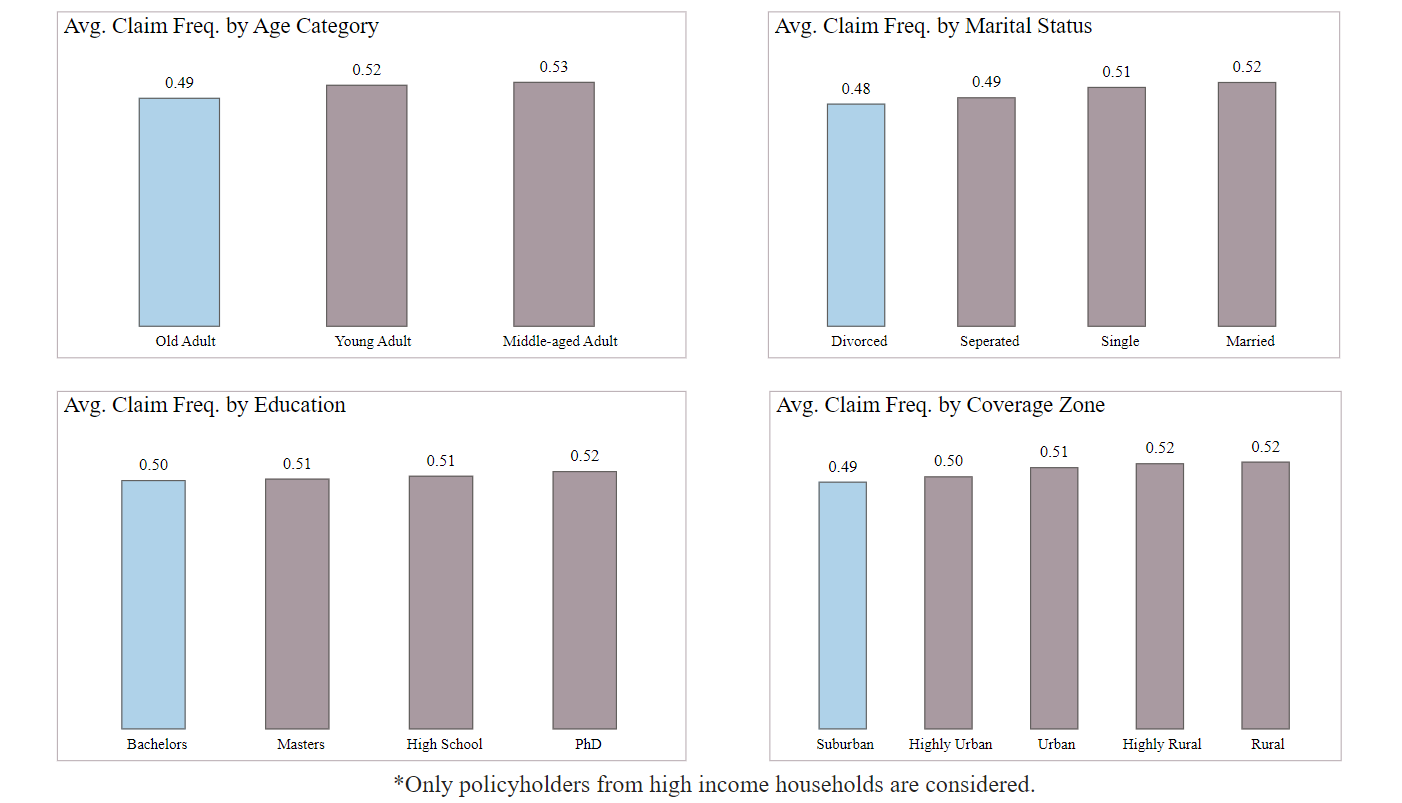
Policyholders from high-income households with low claim frequencies often share these characteristics:
They are older adults
They are divorced
They have a bachelor's degree
They live in suburban areas
Demographic Analysis
- How does the distribution of policyholders vary across different demographic factors (age, gender, marital status)?
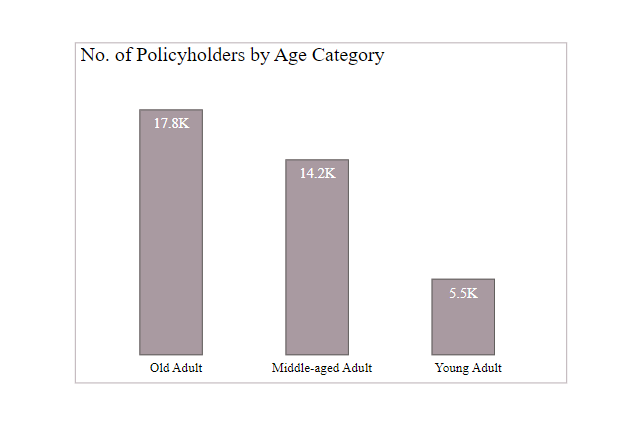
Older adults are the largest age group among policyholders, making up nearly half of the total. This suggests the company should tailor its services and marketing strategies to meet the needs and preferences of this demographic.
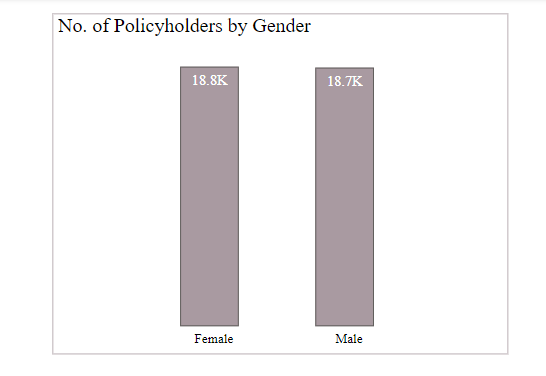
The gender distribution of policyholders is nearly equal, with 18.8K females and 18.7K males.
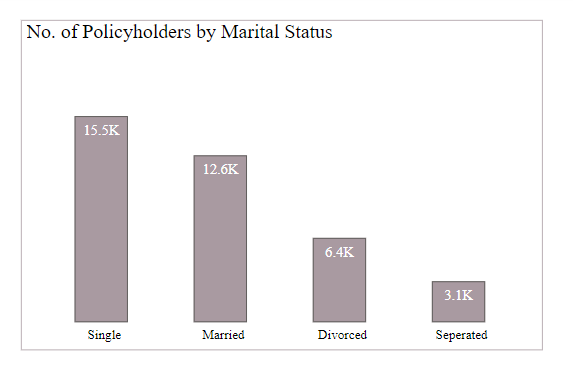
When examining the distribution of policyholders by marital status, singles are the most represented, numbering over 15K. In contrast, those who are separated are the least represented, with just around 3K.
- Are there any noticeable trends in car usage and ownership among different demographic groups?


Across all demographic groups, car use and ownership patterns are similar. Most policyholders use their cars for private purposes rather than commercial ones. Car ownership trends are also consistent, with Modern cars being the most common, followed by Vintage, Classic, and Antique cars.
Geographic Analysis
How do claim frequencies and amounts vary across different coverage zones?
Are there any regional trends or patterns that should be taken into consideration for marketing or risk assessment?

Average claim frequencies and amounts are slightly higher in urban and suburban areas. These areas usually have more traffic, which increases the chance of accidents. Additionally, higher crime rates in these areas raise the risk of car theft or vandalism, resulting in more claims.
Customer Behaviour Insights
Are there any trends or patterns in the behavior of policyholders who have children driving?
How does the presence of children driving affect the frequency and number of claims?

Policyholders with three children driving are more likely to file claims than those with fewer children. Teen drivers are generally newer to the road and haven't developed the same level of risk assessment or defensive driving skills as older drivers. This can lead to a higher likelihood of accidents.
Recommendations
Targeted marketing campaigns should focus on owners of antique cars. These individuals are likely from high-income households, as owning and maintaining an antique car is expensive. This means they can probably afford higher premiums. Additionally, antique cars are typically used only on special occasions, reducing their exposure to risk and the likelihood of filing claims.
Offer Specialized Coverage Options: Antique cars are driven less often and usually for leisure. Promote custom insurance plans with features like limited mileage discounts or pay-per-mile options to match this lower risk.
Partner with Antique Car Clubs and Events: Work with groups and events that antique car fans attend. This helps you reach your target audience directly and show that you understand their unique needs.
Address Security Concerns: Antique cars can be prime targets for theft. Promote strong security features and offer discounts for installing anti-theft systems or keeping the vehicle in a secure place.
Limitations of the Project
The project aimed to improve premium pricing models based on risk factors. However, a major limitation was the lack of data on current premiums. This missing information makes it hard to effectively optimize premium pricing models based on risk factors.
Conclusion
Splendor's insurance data provided useful insights on claims, risks, and customers. This can help improve pricing and marketing. Although missing premium data limited full optimization, the findings still benefit Splendor's risk management and customer engagement.
Check out the full documentation and solutions on my GitHub.
Subscribe to my newsletter
Read articles from Iman Adeko directly inside your inbox. Subscribe to the newsletter, and don't miss out.
Written by
