Outlier Detection in Election Data Using Geospatial Analysis
 Pauline B.
Introduction 👋
Hello everyone! This analysis focuses on the voting trends across different polling units within Bayelsa state. The main objective is to pinpoint any unusual patterns and potential discrepancies in the voting procedures.
I found this task quite interesting as it provided an opportunity to thoroughly examine the data related to the 2023 Nigerian election and address any doubts regarding its accuracy. The report outlines the process and findings of the geospatial analysis used to identify any irregularities in the voting process. Let's dive in!
Methodology 📈
The analysis focused on the 2023 election data for Bayelsa State. The initial phase involved retrieving and examining the data to ensure its integrity by identifying and resolving potential issues such as missing values or duplicate entries.
Data preparation.
To begin the exploratory data analysis, I obtained basic information about the dataset, checked for missing values and duplicate entries, and determined the overall structure of the data. Additionally, I utilized Python's geopy library and ArcGIS geolocator to generate longitude and latitude values for each polling unit and merged key details to streamline the dataset. This process involved removing unnecessary columns and successfully retrieving the coordinates for each polling unit address.Clustering and Neighbor Identification.
To group polling units based on their geographic proximity, I used the DBSCAN algorithm to cluster polling units within a 1 km radius, forming neighborhoods based on their spatial closeness. To speed up the process of finding nearby units for further analysis, I implemented a BallTree structure. This approach enabled quick spatial queries, making it easier to identify neighboring polling units and uncover meaningful insights from the data. These steps were essential for exploring spatial relationships effectively and making informed decisions based on the clustering results.Outlier Score Calculation.
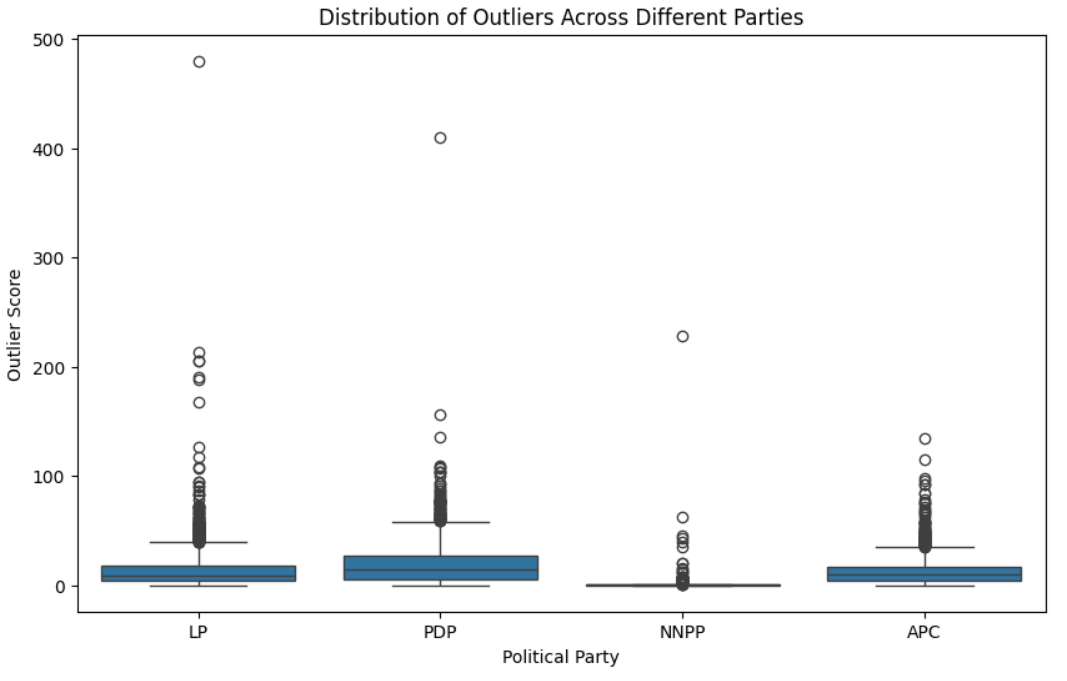
To uncover unusual voting patterns within each cluster, I examined how the votes for APC, LP, PDP, and NNPP at each polling unit deviated from the average votes of nearby units. This helped identify polling units where one party's support sharply differed from its neighbors, potentially indicating unique voting trends or irregularities.
Sorting and Reporting.
Once the outlier scores were calculated, I sorted them to highlight the most pronounced deviations. This sorting process aimed to prioritize and analyze the parties and clusters showing the most significant variations in voting behavior compared to their surroundings.
Summary of Findings 📑
Below is an overview of insights and significant observations derived from the analysis.
Analysis of the top 3 outliers.
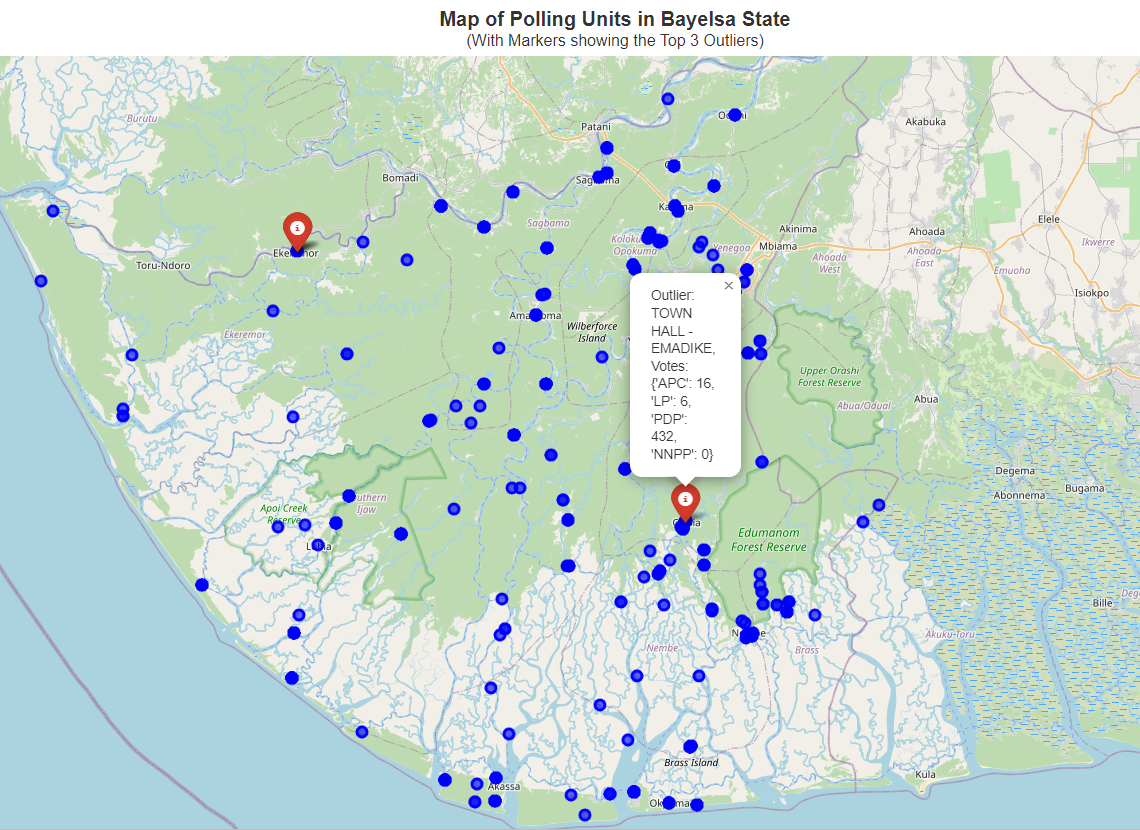
After the exploratory analysis, I focused on the top outliers, documenting their cluster memberships and how their voting habits differed for each party (APC, LP, PDP, and NNPP). The research found polling units with the greatest differences in votes, indicating possible anomalies. Here is a summary of the top three outliers.
AGBOGIDI DUDU SQUARE (PU-Code: 06-02-04-004): There was a significant deviation of 480.03 for the LP party at this polling unit compared to nearby polling stations. It suggests an unusual voting pattern that could indicate an anomaly in the voting process or a significant event. This outcome could caused by local issues, community dynamics, or specific campaigning efforts that resonate uniquely in this locality.
TOWN HALL - EMADIKE (PU-Code: 06-05-05-018): This polling unit exhibits a deviation of 409.84 for the PDP party. It indicates a significant departure in PDP's voting support compared to neighboring polling units within the same cluster. Various factors, including local governance problems, community customs, or socioeconomic factors may influence this distinct voting pattern.
AGBOGIDI DUDU SQUARE (PU-Code: 06-02-04-004): This location reappears with a deviation of 228.33 for the NNPP party. Although lower than LP's deviation, the outlier status of NNPP shows a significant difference in voting patterns compared to neighboring polling stations. Local factors such as candidate popularity, regional policies, or demographic shifts might influence this variation.

Upon identifying the top 3 outliers and examining their nearest polling units, it is clear that these anomalies are noticeable due to significant differences in voting patterns compared to their neighboring units. Local issues and dynamics can impact how people vote, making these areas crucial for further analysis.
Correlation matrix.
The correlation matrix analysis provides a detailed look into how different factors interrelate within the Bayelsa state voting dataset. When we look at political parties like APC, LP, PDP, and NNPP, we see varying correlations, indicating different voting patterns and levels of competition across the state.Voter turnout: The correlation matrix shows a moderate positive correlation between accredited and registered voters, suggesting that voter turnout tends to be consistent across the polling units.
Voting patterns between parties: The APC and PDP parties have a minor positive correlation (0.34), meaning that voters who typically vote for APC are more likely to vote for PDP than any other party, and vice versa. This could be due to several factors, such as voters in certain areas typically voting for a certain party, or voters who are against one party being more likely to vote for the other.
Relationship between registered voters and political party: The correlation between registered voters and all the parties is weak (around 0.4 or less), which shows that the number of registered voters in a precinct is not a strong indication of how many people will vote for a particular party.
Outlier scores and party affiliations: The APC_outlier_score and PDP_outlier_score have a weak positive correlation (0.017), implying that polling stations with high outlier scores for the APC party may also have high outlier ratings for the PDP.
Location impact on voting patterns: There is a weak positive correlation between longitude and the LP party (0.19) and a weak negative correlation between longitude and the NNPP party (-0.029), which suggests that there may be some geographic trends in voting patterns, with voters in more northern areas being more likely to vote for the LP and less likely to vote for the NNPP.
Conclusion ✅
The geospatial analysis successfully identified significant outliers in the voting patterns across polling units. The top 3 outliers, as indicated by their deviations in votes for specific parties, suggest potential irregularities that warrant further investigation, and the correlation matrix offers additional insights into the relationships between various voting metrics.
This report contributes to understanding and potentially addressing voting anomalies in the region, ensuring the integrity and fairness of the electoral process. Feel free to delve deeper into the data and provide your insights for further analysis. Here are the links to the cleaned data and the outlier data.
Thanks for reading! 😊
Subscribe to my newsletter
Read articles from Pauline B. directly inside your inbox. Subscribe to the newsletter, and don't miss out.
Written by
