Exploratory Data Analysis of Sales Data
 Shukurat Bello
Introduction
The retail sales dataset used for this Exploratory Data Analysis (EDA) contains comprehensive details of motorcycle sales transactions over a span of a few years. This dataset has 25 rows and 2823 columns. The objective of this report is to perform an initial review of the dataset to identify key variables, uncover observable patterns and trends, and provide immediate insights that can guide further analysis.
The dataset includes categorical and numeric attributes:
Categorical Attributes:
ORDERNUMBER: Unique identifier for each order (categorical)
ORDERLINENUMBER: The line number of the order (categorical)
ORDERDATE: The date on which the order was placed (datetime)
STATUS: The status of the order (categorical)
QTR_ID: The quarter in which the order was placed (categorical)
MONTH_ID: The month in which the order was placed (categorical)
YEAR_ID: The year in which the order was placed (categorical)
PRODUCTLINE: The product line category (categorical)
PRODUCTCODE: The product code (categorical)
CUSTOMERNAME: The name of the customer (categorical)
CITY: The city of the customer (categorical)
STATE: The state of the customer (categorical)
POSTALCODE: The postal code of the customer (categorical)
COUNTRY: The country of the customer (categorical) etc.
Numerical Attributes:
QUANTITYORDERED: The number of units ordered (numerical)
PRICEEACH: The price per unit of the product (numerical)
SALES: The total sales amount for the order (numerical)
MSRP: The manufacturer's suggested retail price (numerical)
Observations
Anomalies
At first glance I could see that
The ORDERDATE column is a date time datatype and the date and time is not consistent across each row.
Some columns like ADDRESS, POSTALCODE and STATE has missing values.
The PHONE column listing phone numbers has inconsistent formating.
Insights and Trends
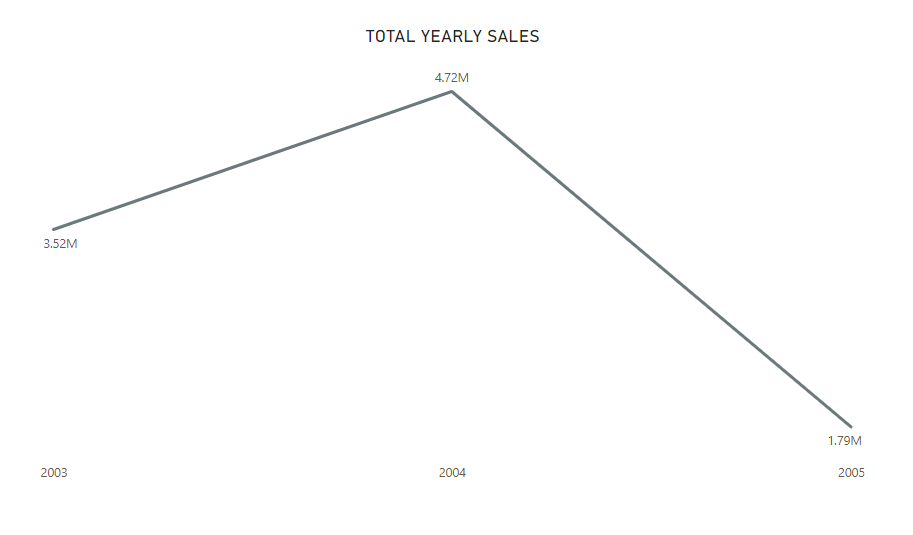
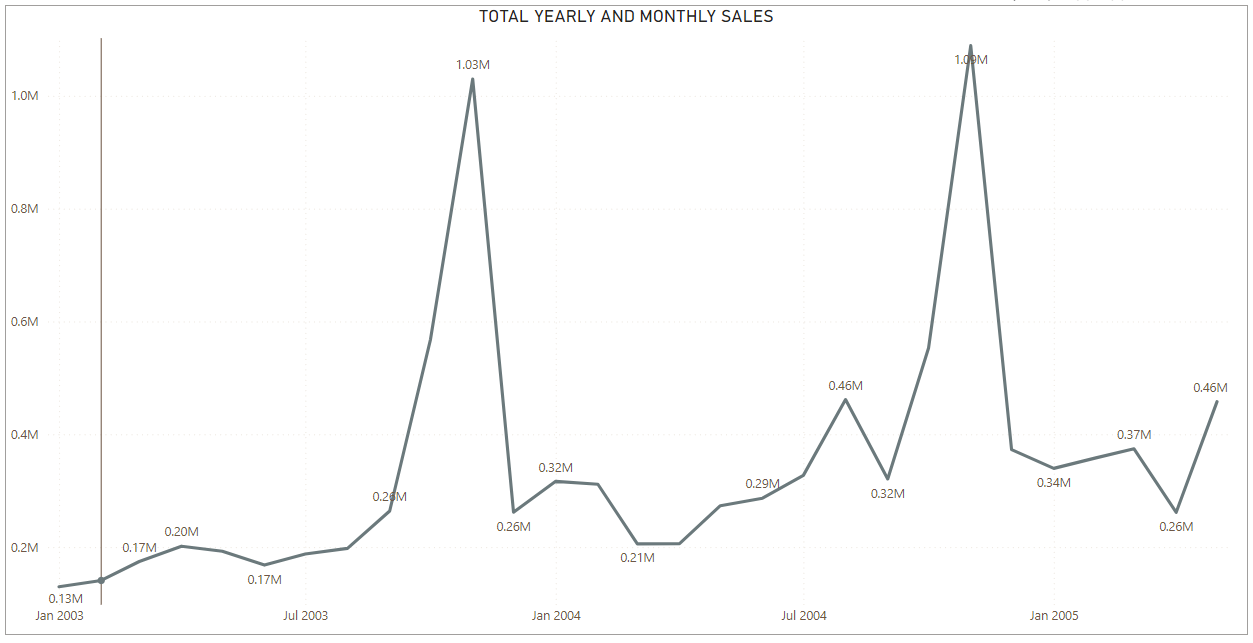
Sales Distribution Across Time: There are variations in sales figures across different months and years.
The dataset spans three years. (Jan 2003- May 2005)
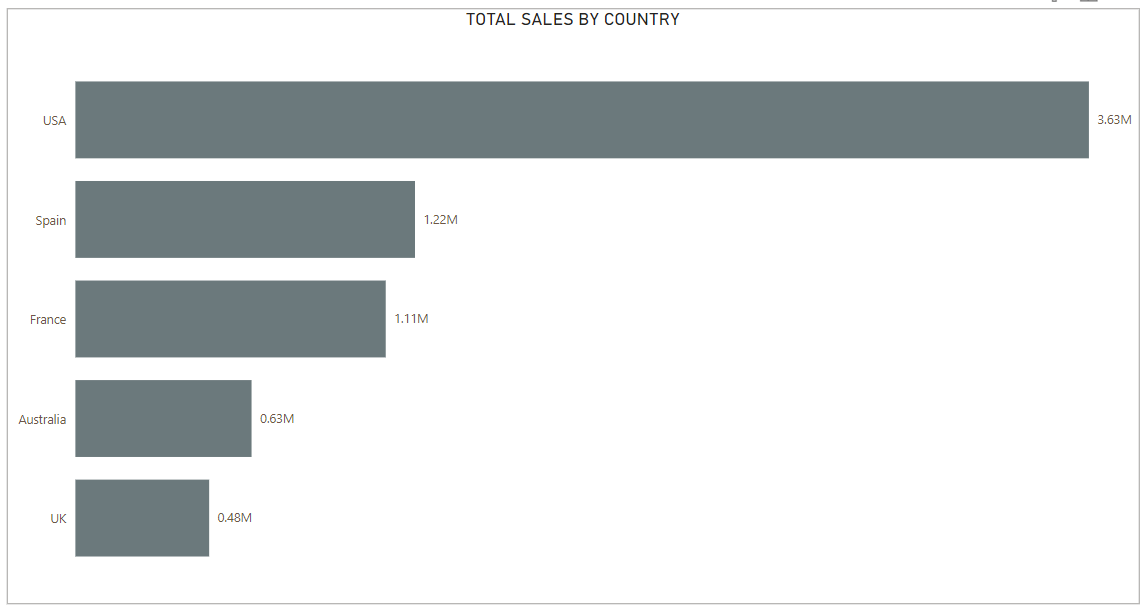
Top Countries: Top Countries according to the amount of Revenue made from the vehicles sold
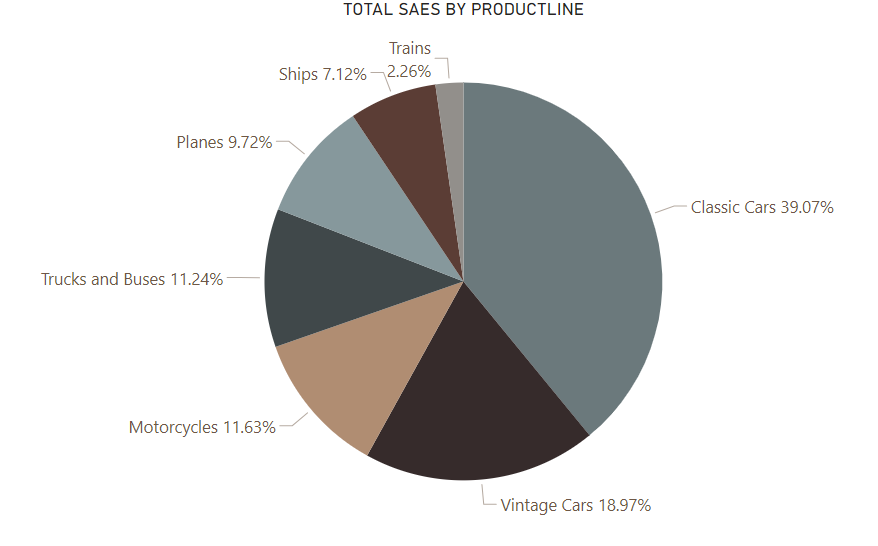
Sales Distribution of Products:
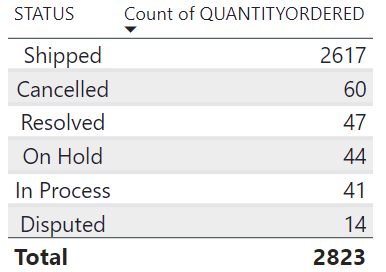
Number of Orders per Status:
Conclusion
The initial review of the retail sales dataset reveals several key insights, including variations in sales figures across different months and years, differences in order sizes in each status, and the distribution of customers and sales across various country and productlines. These observations suggest areas for deeper analysis, such as investigating the factors driving sales fluctuations, analyzing the impact of deal sizes on total sales, and exploring regional sales performance amongst other things.
This task was completed as part of my activities for the HNG internship, you can learn more about the program on the HNG websites https://hng.tech/premium and https://hng.tech/hire.
Subscribe to my newsletter
Read articles from Shukurat Bello directly inside your inbox. Subscribe to the newsletter, and don't miss out.
Written by
