Geospatial and Outlier Analysis of Presidential Election Data in Anambra State.
 Carlson Oranu
Introduction
Ensuring the integrity of elections is critical for maintaining public trust in democratic processes. This report covers my analysis of the 2023 presidential elections for Anambra state, focusing on detecting voting irregularities by identifying neighbouring polling units through an algorithm and detecting the outlier votes for each political party. The analysis involves using a clustering technique to group geographical neighbouring polling units and then identifying outliers within each 1km radius cluster based on the votes received by each party. The political parties analysed are APC, LP, PDP, and NNPP.
Exploring Our Dataset: Our Anambra elections dataset is publicly accessible and obtained from this drive link. The Anambra_crosschecked CSV file was used for this analysis and it contains the validated votes for the Anambra state. The Dataset used comprises the following fields, “State”, “LGA”, “Ward“, “PU-Code“, “PU-Name“, “Accredited_Voters“, “Registered_Voters“, “Results_Found“, “Result_Sheet_Stamped“, “Result_Sheet_Corrected“, “Result_Sheet_Invalid“, “Result_Sheet_Unclear“, “APC“, “LP“, “PDP“, “NNPP“.
Tools used for Analysis: Excel, Google Sheets, Geocode API by Awesome Table, and Python (Pandas, numpy, sklearn.cluster, matplotlib, seaborn, folium, os).
Methodology
1. Data Preparation
Observations: The dataset used for this analysis was inspected to check for missing values and to understand the structure of the data frame, The dataset contains votes for four political parties (APC, LP, PDP, NNPP) across 3679 polling units. along with the states, wards, Local government areas and polling unit names.
Concatenation: For us to get the exact location of each polling unit, the CSV file was uploaded to Google sheet and the “State”, “LGA”, and “PU-Name” were concatenated to form a new column with a more accurate representation of the address, this was done to increase the accuracy of the geocoding process by the Geocode API by Awesome Table in Google Sheets. Geocoding: This concatenated address was geocoded with Geocode by Awesome Table in Google Sheets to give more precise geographic coordinates (latitude and longitude) of these pulling units.
Data cleaning: The dataset with longitude and latitude was then imported into Jupyter Notebook and processed using Python to check for any missing or inconsistent longitude and latitude values that would obscure the results of our analysis.
Data preparation: Redundant columns that were not useful for our analysis such as ['State', 'PU-Code', 'Results_Found', 'Result_Sheet_Unclear', 'Results_File', 'Result_Sheet_Unsigned'] were dropped.
2. Clustering
Clustering Algorithm: In deciding the clustering technique to use, one option was to get the geocoding of the wards and use them as a centroid for our centroid-based clustering with the geolocation of the wards. This would have been very effective, but the limitation is that the wards will become the centre of the radius of our clusters, meaning that some PU locations might be closer to other PU locations in different clusters than they are to PU locations in their own cluster.
That is why a density-based clustering technique was preferred because it groups clusters closest to themselves irrespective of their ward location or LGA but purely based on the distance of every pulling unit to the distance of every other 3678 pulling units in the dataset stored in an (I, j) array.
K-means Vs DBSCAN: Now a decision was made to either use the K-means cluster technique in Python or to use the DBSCAN technique. Let’s have a brief overview of the thought process-
K-means uses centroid-based clustering (mean point of each cluster) that assumes spherical clusters with similar densities, it requires a predefined number of clusters, which can greatly affect the effectiveness of our analysis by forcing some PU locations to be in one cluster, it is also sensitive to outliers. On the other hand DBSCAN technique Uses density-based clustering (finds regions of high density), does not assume a specific cluster shape or density, and it is robust to noise. So DBSCAN technique was best suited for our application.
Distance between PU coordinates: In order to apply the DBSCAN, the distance between the coordinates (longitude and latitude) points was calculated using the Haversine formula storing the distance of each point to every other point in that dataset in a (i, j) matrix.
DBSCAN Clustering: We applied the DBSCAN clustering algorithm to group polling units based on their geographic coordinates. DBSCAN was chosen due to its ability to handle noise and discover clusters of varying shapes and sizes. Each polling unit was assigned a cluster label. The 3679 pulling units were clustered into 187 clusters,
Noise Handling: The PU addresses that were so far apart from any other pulling unit and that did not belong to any density cluster, were labelled as -1 Cluster. This was done to handle the noise in our dataset that would have affected the results of our analysis.
3. Outlier Detection
Within each cluster, we calculated the outlier score for each party independently (APC, LP, PDP, and NNPP). This score measures the deviation of votes for each party within the cluster, allowing us to identify irregular voting patterns. The steps involved are:
- For each cluster, the mean (average vote for each party in a cluster) and standard deviation (the difference in votes for each party compared to the votes of its neighbouring units) of votes for each party were calculated.
Mean:

Standard Deviation:

Where:
· n is the number of votes in a cluster.
· xi is the i-th vote in a cluster.
· xˉis the mean of the votes in a cluster.
· Σ is the standard deviation of the votes in a cluster.
- Outlier Score: Compute the z-score for each party's votes within the cluster using the formula:
Formula: Z-score = ((Votes – Mean Voted) / std votes)

Where,
· x is the vote for which the z-score is being calculated.
· xˉ is the mean of the votes in a cluster.
· σ is the standard deviation of the votes in a cluster.
· z is the z-score of the vote.
Votes with a high absolute z-score (Outlier Score) indicate potential outliers.
The dataset was duplicated Into 4 sheets representing each party, and each sheet was sorted in descending order of the outlier score for each party independently (APC, LP, PDP, and NNPP).
Findings
The following points outline my findings from the outlier analysis of the Anambra state 2023 presidential elections along with some visualisations to support them. The findings will highlight detailed examples of the top 3 outliers for each party.
1. Overview of Votes:
For the verified votes in our dataset, there was a total of 1657748 registered voters, and a total of 390817 voters cast their vote for either APC, LP, PDP, or NNPP.
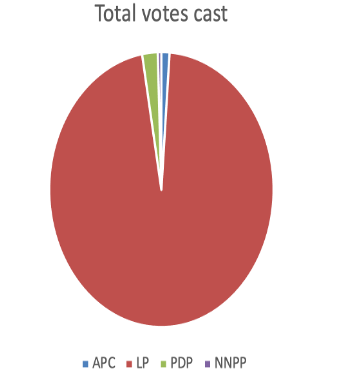
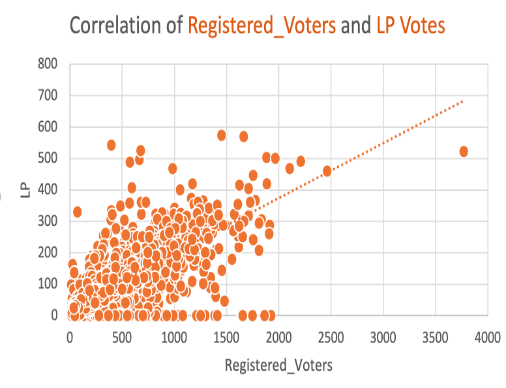
The pie chart above shows the vote distribution for APC, LP, PDP and NNPP with LP having 96 % of the total votes cast in Anambra state. The correlation map shows a very strong correlation between registered voters and LP votes, implying that LP got the most votes in most registered voters’ polling units.
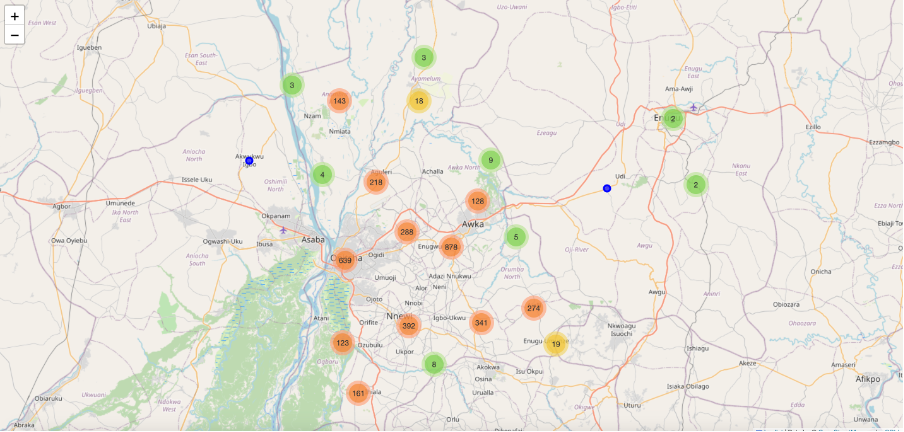
The folium map was generated to show the locations of polling units, colour-coded by cluster. Outliers were marked with larger, differently coloured markers.
1. Top 3 outliers
Top outlier:
The top outlier from our data set comes from the PDP at the polling unit "PIONEER PRY. SCHOOL III" in Odoakpu I ward, Onitsha-South LGA. This polling unit recorded an exceptionally high number of votes for PDP, with the highest outlier score of 22.095177. The PDP votes at this polling unit are extremely high compared to its neighbouring polling units.
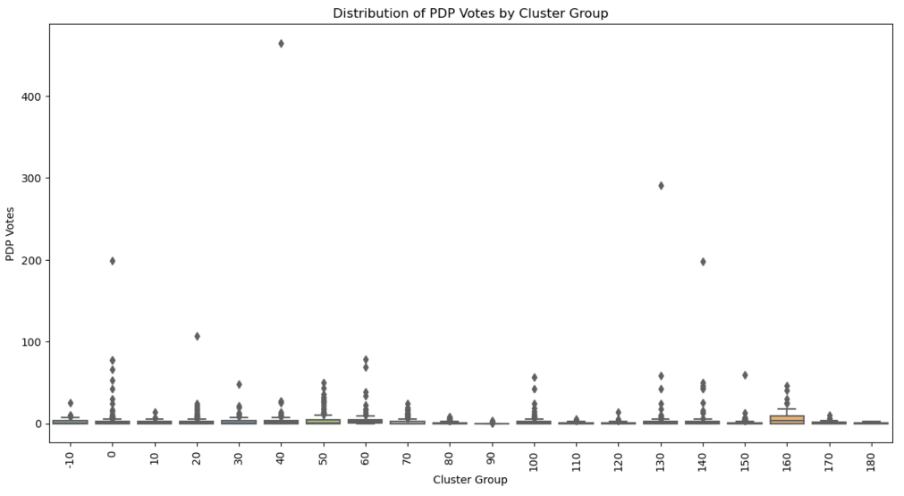
This is a significant deviation from the mean shown in the box plot above, the outliers by far the maximum point which is 1.5 times the interquartile range, indicating an unusual voting pattern that stands out in the data, such a high Z-score could suggest irregularities such as targeted campaigning, a strong local preference for PDP or factoring in the fact that the result sheet was not stamped, this additional input could imply election malpractice.
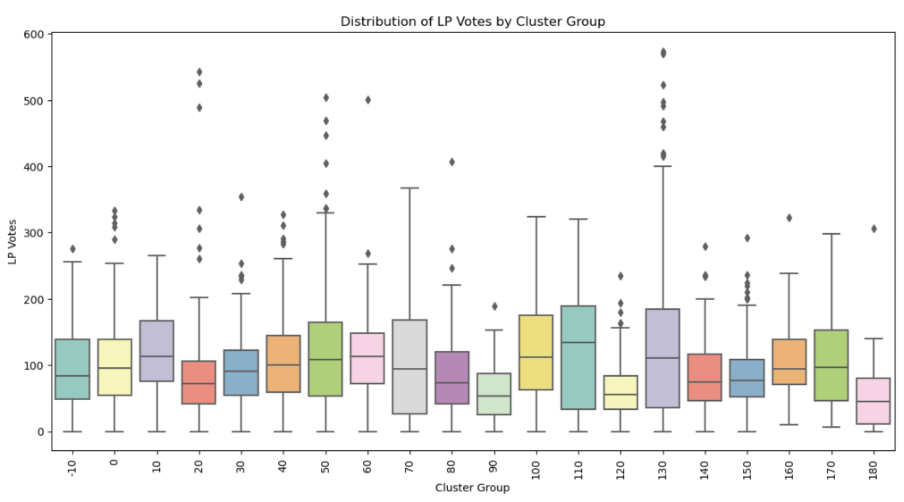
For reference, here is the box plot for LP vote distribution across the 180 clusters. We can see that the deviation of the outliers from the mean is minimal, which represents a more consistent voting pattern across the entire state.
Second top outlier:
Another significant outlier is the NNPP at "URBAN BOYS SECONDARY SCHOOL I" in Fegge III ward, Onitsha-South LGA. This polling unit had an outlier score of 16.76542278 for NNPP, indicating a substantial deviation from its neighbouring polling units.
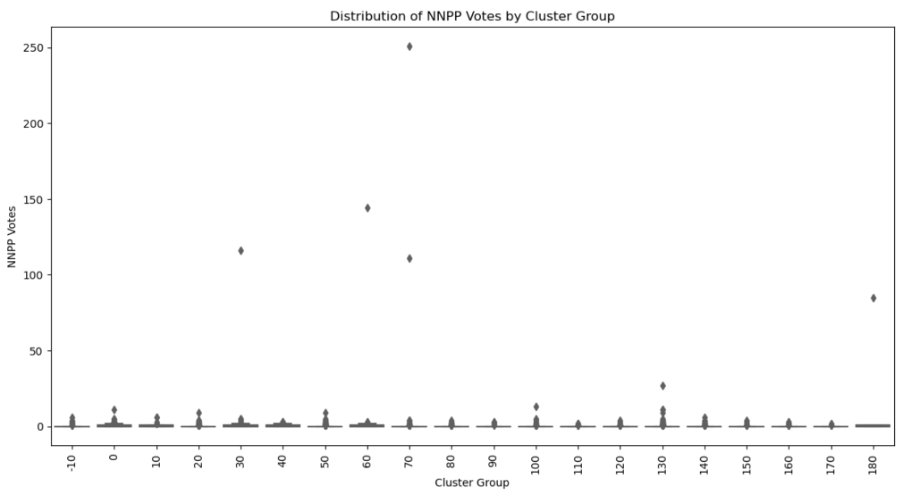
In this polling unit, NNPC had 27 votes, which is a huge deviation from the mean NNPP votes in its cluster of 0.48 votes. The high concentration of votes for NNPP in this polling unit compared to other neighbouring polling units, coupled with the absence of votes for other parties (except LP), points to specific factors such as effective local campaigns or demographic preferences favouring NNPP, marking it as an outlier.
Third top outlier:
The third outlier is for the APC at "NKWO AMENYI SQUARE II" in Awka II ward, Awka South LGA.
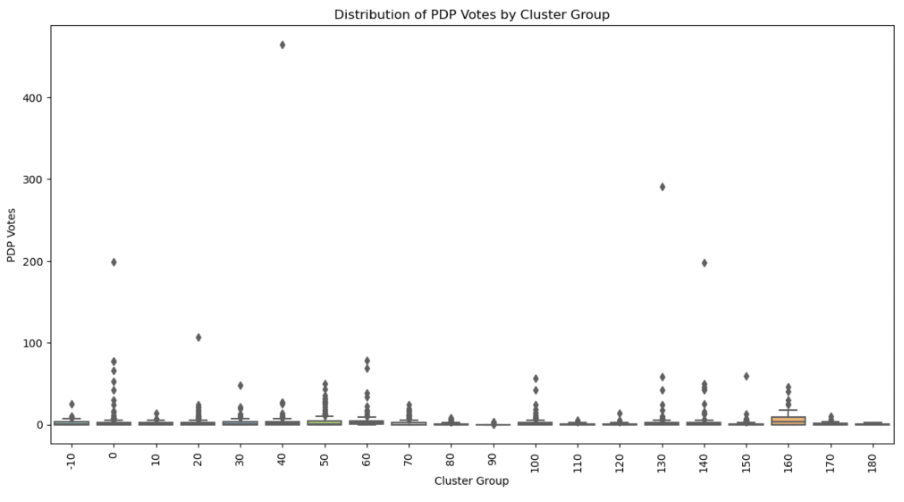
As seen in the box plat above, the APC recorded a Z-score of 15.98, indicating an exceptional deviation from the cluster mean of 1.84 votes. The polling unit had 246 accredited voters and 939 registered voters, with APC receiving 228 votes. LP and NNPP received no votes, while PDP received only 3 votes. The overwhelming support for APC at this polling unit could be a result of localized political influences, and polling unit exposure to malpractice. The absence of LP votes, along with minimal votes for PDP and NNPP in the capital of Anambra state that has strong support for ABGA, LP and PDP, further accentuates the presence of an external influence in that polling unit.
Conclusion: Summary of Findings
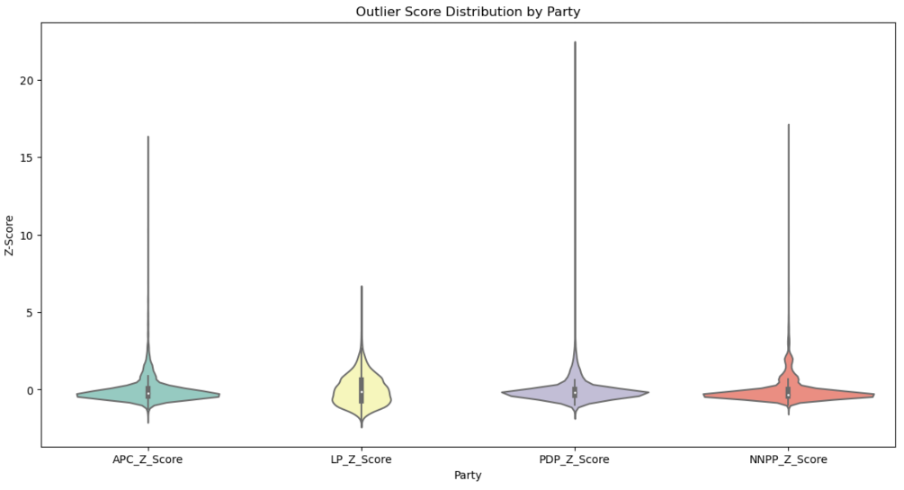
This violin plot above summarises the outliers across all parties that are considered significant due to their substantial deviation from the cluster means, as measured by the Z-scores. The violin plot also shows the density distribution of the outlier score, the top outliers per party and the mean outlier scores. LP seems to have the widest distribution of outliers, while the other parties show outlier activity at specific polling units.
Such deviations suggest unusual voting behaviours that stand out in the dataset. Factors contributing to these outliers could include targeted political campaigns, demographic influences, or potential irregularities in the voting process.
Links
Subscribe to my newsletter
Read articles from Carlson Oranu directly inside your inbox. Subscribe to the newsletter, and don't miss out.
Written by

