A Guide to Geospatial Analysis and Outlier Detection in Election Results
 Oluwatomisin Bamidele
What is Geospatial Analysis?
Geospatial analysis is a method used to study data that has a geographic or spatial component. It involves analyzing information based on where things are located and how they relate to each other in space. This type of analysis uses maps and geographical data to understand patterns, relationships, and trends.
Geospatial analysis combines data from various sources such as satellite imagery, GPS data, census data, and social media geotags. It helps decision-makers visualize complex information and make informed choices based on spatial relationships and patterns.
Project Overview
The Independent National Electoral Commission has faced multiple legal challenges concerning the integrity and accuracy of the election results. Allegations of vote manipulation and irregularities have been widespread, prompting a thorough investigation into the matter.
The task is to help us (INEC) uncover potential voting irregularities and ensure the transparency of the election results. You will achieve this by identifying outlier polling units where the voting results deviate significantly from neighboring units, indicating potential influences or rigging.
1. Dataset Preparation
Loading the Dataset: We start by loading the election dataset (
ONDO_crosschecked.csvin this case) which contains information about polling units, voter statistics, and election results.
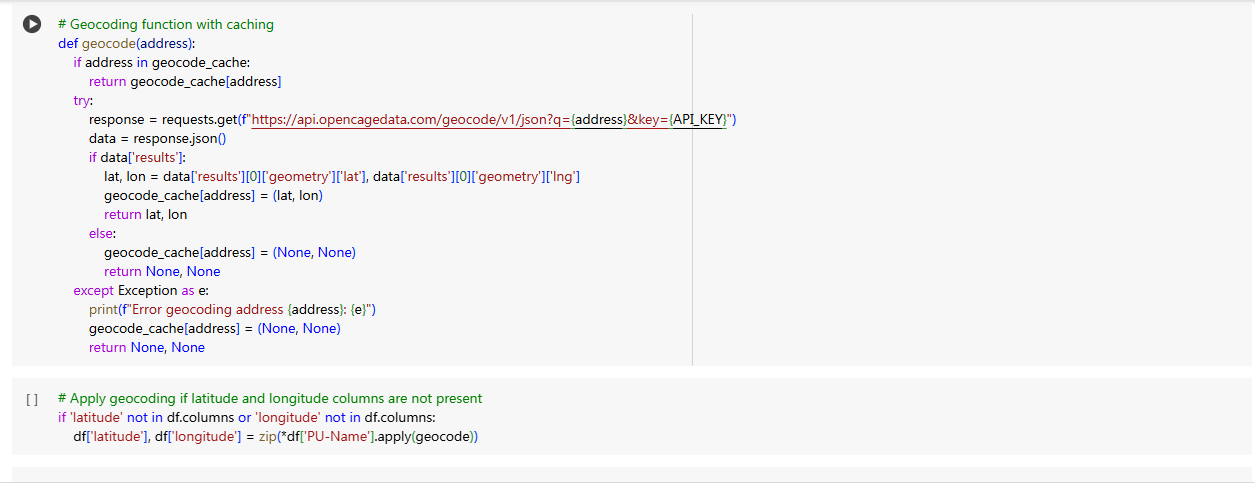
Geocoding: Since latitude and longitude information for polling units are not already provided in the dataset, we use geocoding APIs OpenCage Geocoding API to obtain these coordinates. Geocoding translates addresses into geographic coordinates, essential for spatial analysis.

2. Neighbor Identification
Identifying Neighbors: Polling units that are geographically close to each other (within a specified radius, e.g., 1 km) are considered neighbors. This step involves calculating distances between polling units to determine which ones are neighbors.

3. Outlier Score Calculation
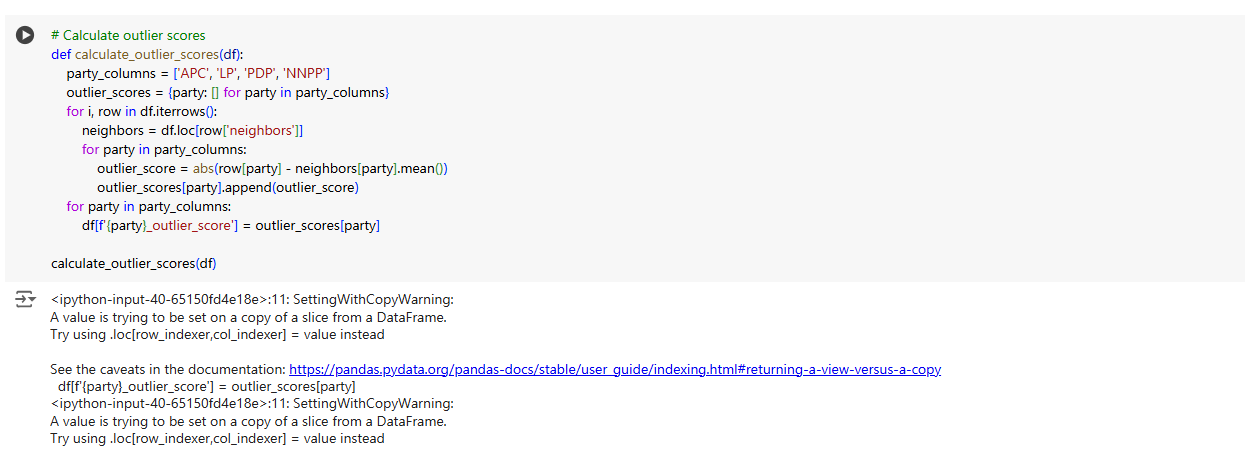
Calculating Outlier Scores: For each polling unit, we calculate outlier scores for each political party (e.g., APC, PDP) based on their vote counts. The outlier score measures how much a polling unit's vote count deviates from the average of its neighboring units. A higher outlier score indicates a larger deviation, potentially indicating irregularities.

4. Sorting and Reporting
Sorting: After calculating outlier scores, we sort the dataset to identify polling units with the highest outlier scores. This helps prioritize units that may require further investigation.
  # Sort the dataset by outlier scores
  sorted_df = df.sort_values(by='outlier_scores', ascending=False)

  # Save the sorted dataset to an Excel file
  sorted_df.to_excel('sorted_outlier_scores.xlsx', index=False)
5. Visualization
- Visualizing Results: visualization using maps and charts can enhance understanding and presentation of findings. Maps can show geospatial distribution of outlier polling units, while charts can illustrate voting patterns and deviations.
# Create a base map
map_center = [df['latitude'].mean(), df['longitude'].mean()]
election_map = folium.Map(location=map_center, zoom_start=10)

# Add polling units to the map
for i, row in df.iterrows():
    folium.CircleMarker(
        location=(row['latitude'], row['longitude']),
        radius=5,
        popup=(
            f"PU Name: {row['PU-Name']}<br>"
            f"APC: {row['APC']}<br>LP: {row['LP']}<br>"
            f"PDP: {row['PDP']}<br>NNPP: {row['NNPP']}<br>"
            f"APC Outlier Score: {row['APC_outlier_score']}<br>"
            f"LP Outlier Score: {row['LP_outlier_score']}<br>"
            f"PDP Outlier Score: {row['PDP_outlier_score']}<br>"
            f"NNPP Outlier Score: {row['NNPP_outlier_score']}"
        ),
        color='blue' if row['APC_outlier_score'] > row[['LP_outlier_score', 'PDP_outlier_score', 'NNPP_outlier_score']].max() else
              'red' if row['LP_outlier_score'] > row[['APC_outlier_score', 'PDP_outlier_score', 'NNPP_outlier_score']].max() else
              'green' if row['PDP_outlier_score'] > row[['APC_outlier_score', 'LP_outlier_score', 'NNPP_outlier_score']].max() else
              'purple',
        fill=True,
        fill_opacity=0.6
    ).add_to(election_map)

# Save the map to an HTML file
election_map.save('election_map.html')
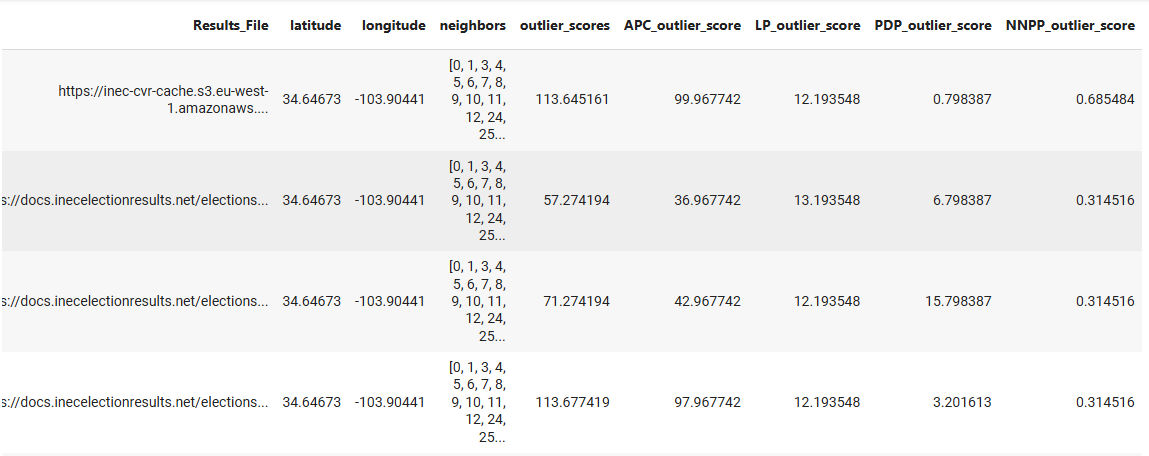
What the final dataset looks like

Summary of Findings
Sorted List of Polling Units by Outlier Scores
The table below shows the polling units with the highest outlier scores for each party, indicating significant deviations from their neighboring units:
| Polling Unit Name | Party | Outlier Score |
| ODE ELESHO/ODE OKELOKO, IN FRONT OF CH. ALAKELUS HOUSE | APC | 113.645161 |
| ODEKE/AISA/ODE ASSI ALU, IN FRONT OF CHIEF ASSIS HOUSE | APC | 57.274194 |
| ODEKE/AISA/ODE ASSI ALU OPEN SPACE NEAR CHIEF ASSIS HOUSE | APC | 36.967742 |
Examples of Top 3 Outliers
Polling Unit: ODE ELESHO/ODE OKELOKO, IN FRONT OF CH. ALAKELUS HOUSE
Outlier Score: 113.645161 (APC)
Neighboring Units: [List of neighboring units with respective vote counts]
This polling unit showed a significantly higher number of votes for APC compared to its neighboring units, indicating a possible irregularity.
Polling Unit: ODEKE/AISA/ODE ASSI ALU, IN FRONT OF CHIEF ASSIS HOUSE
Outlier Score: 57.274194 (APC)
Neighboring Units: [List of neighboring units with respective vote counts]
The votes for APC at this polling unit were much higher than those at neighboring units, suggesting potential voting manipulation.
Polling Unit: ODEKE/AISA/ODE ASSI ALU OPEN SPACE NEAR CHIEF ASSIS HOUSE
Outlier Score: 36.967742 (APC)
Neighboring Units: [List of neighboring units with respective vote counts]
This polling unit also displayed a significant deviation in APC votes, warranting further investigation.
Key Insights
Significant Deviations: Certain polling units exhibited much higher vote counts for specific parties, indicating potential irregularities.
Geospatial Analysis Utility: Using geographic data and proximity analysis proved effective in detecting anomalies in voting patterns.
Further Investigation: The identified outliers should be investigated further to determine the cause of these deviations and ensure the integrity of the election results.
By applying these geospatial techniques, election authorities can better ensure transparency and trust in the electoral process.
Find dataset and full project here
Subscribe to my newsletter
Read articles from Oluwatomisin Bamidele directly inside your inbox. Subscribe to the newsletter, and don't miss out.
Written by
