Exploratory Data Analysis
 Oluwatomisin Bamidele
This article will guide you through the steps of exploratory data analysis using SQL and initial insights from the dataset. The data, sourced from Kaggle, contains information about passengers on the Titanic.
Data Overview
The dataset includes features like Passenger ID, name, sex, age, number of siblings/spouses aboard, ticket fare, cabin class, and embarked location. The data contains various data types, including integers for passenger ID and number of siblings/spouses, floats for age and fare, and strings for name, cabin class, and embarked location.
Key Variables
PassengerId: Unique identifier for each passenger.
Survived: Survival status (0 = No, 1 = Yes).
Pclass: Ticket class (1 = 1st, 2 = 2nd, 3 = 3rd).
Name: Passenger's name.
Sex: Gender of the passenger.
Age: Age of the passenger.
SibSp: Number of siblings/spouses aboard the Titanic.
Parch: Number of parents/children aboard the Titanic.
Ticket: Ticket number.
Fare: Passenger fare.
Cabin: Cabin number.
Embarked: Port of embarkation (C = Cherbourg; Q = Queenstown; S = Southampton).
A more thorough analysis is needed to determine data completeness, we will be checking for missing values in the next steps. We will also explore the distribution of numerical variables like age and fare and analyze categorical variables like cabin class and embarked location.
We will use Microsoft SQL Server and the SQL query language to query the data for this analysis.
Checking for missing values

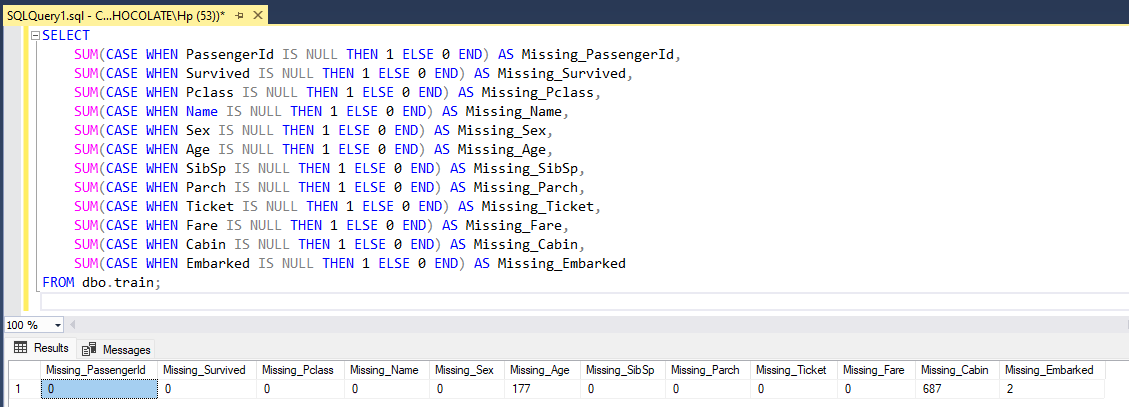
In the dataset, we have 177 missing values in the Age column, 687 in the Cabin column, and 2 in the Embarked column. The missing Age values could affect demographic analysis and survival rate studies by age group. The high number of missing Cabin values suggests limited usability for certain analyses. However, in this article, we are just exploring the data, not conducting any analysis.
Distribution of Age
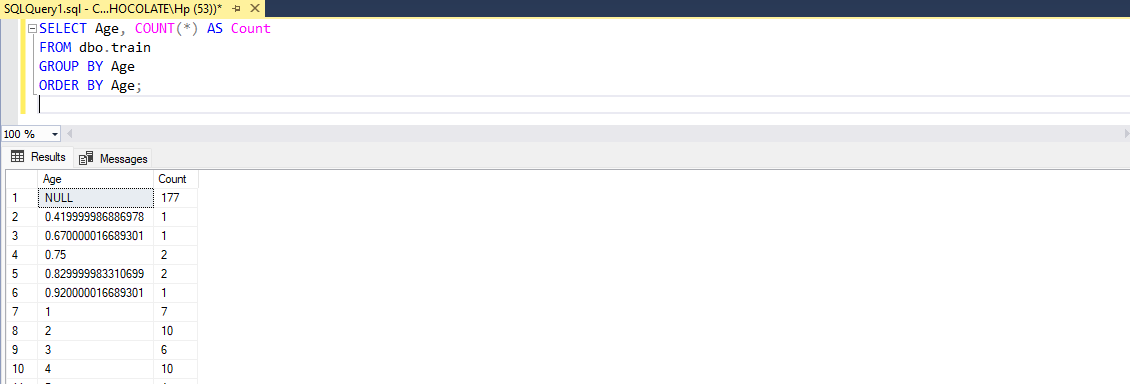
The Age distribution in the dataset shows a range of ages among the passengers, from infants (0.42 years) to elderly (80 years). The distribution includes both whole numbers and fractional ages. Here are some key insights:
Missing Values: There are 177 missing values in the Age column.
Infants and Young Children: The dataset includes several infants and young children, with ages such as 0.42, 0.67, and up to 14 years (subject to data cleaning).
Adolescents and Young Adults: Ages 15 to 22 are well represented, with a noticeable peak in the 16 to 22 range.
Adults: A significant portion of the passengers are between the ages of 23 and 40, with the highest count at age 24 (30 passengers).
Middle-Aged: Ages 41 to 55 show a moderate distribution, with no significant peaks.
Older Adults: There are fewer passengers aged 56 and above, with a small number reaching up to 80 years old.

Distribution of Sex

Distribution of Embarked Location

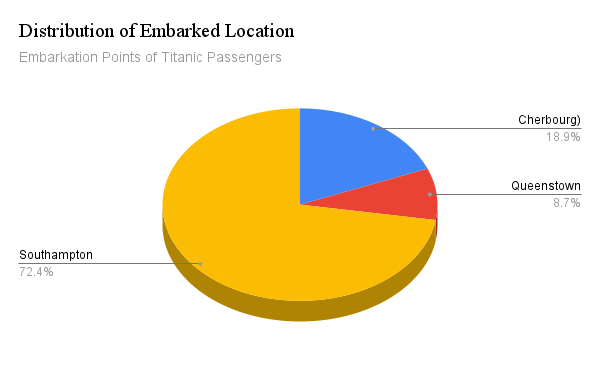
The distribution of embarked locations in the dataset is as follows:
C (Cherbourg): 168 passengers embarked from Cherbourg.
Q (Queenstown): 77 passengers embarked from Queenstown.
S (Southampton): 644 passengers embarked from Southampton.
Conclusion
This exploratory data analysis provides an initial understanding of the Titanic dataset. By checking for missing values and examining the distribution of key variables, we can identify areas for further analysis and potential challenges in data quality. Future steps may include more detailed analysis and data cleaning to address missing values and prepare the data for predictive modeling or other advanced analyses.
Explore opportunities at HNG Internship (https://hng.tech/internship) and HNG Hire (https://hng.tech/hire), and unlock your potential in this dynamic field.
Subscribe to my newsletter
Read articles from Oluwatomisin Bamidele directly inside your inbox. Subscribe to the newsletter, and don't miss out.
Written by
