Logistic Regression
 Shrey Shah
What is Classification?
Before starting Logistic Regression, let me explain the term classification. Classification is a method used to categorize data into different types or groups based on some given criteria. For example, you are given data of age along with a boolean value, associated with age, which shows whether the person bought insurance or not. In this example, our requirement is to classify whether a person of a specific age will buy insurance or not. There are various models available for this type of problem, one of which is Logistic Regression.
What is Logistic Regression?
Logistic Regression is a machine learning algorithm commonly used for binary classification. It categorizes the output into two distinct groups based on the given input. For example, in insurance data, Logistic Regression can classify whether a person will buy insurance or not based on their age. Therefore, in cases where a given set of input values needs to be classified into two groups, Logistic Regression is used.
Example to understand Logistic Regression
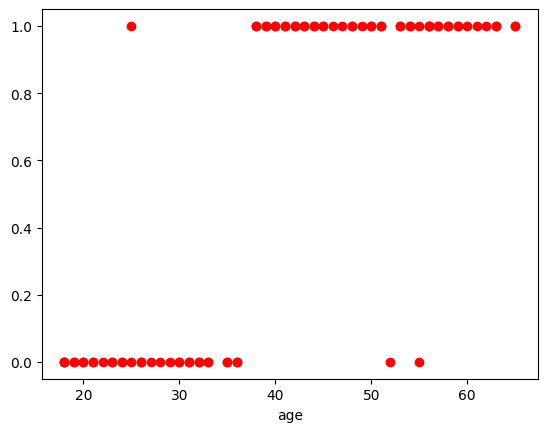
For example, I have a dataset containing two columns: age (integer) and insurance_bought (boolean), which specify whether a person of a certain age has bought insurance or not. Here is the scatter plot for the dataset.

These scatter plots clearly show that there are only two possible values: 0 and 1. Logistic regression helps in such cases by creating a line that can pass through the majority of these points. Let’s move on to the coding part to understand how to implement logistic regression and how we can predict these types of values.
Coding Part
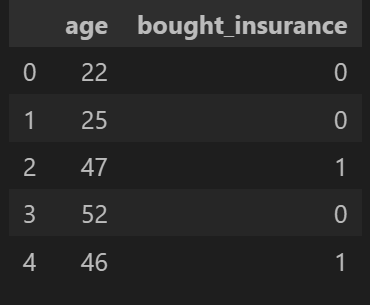
Here comes the easy part, Let’s start with creating the data frame from the csv file of the data set.
Importing the required libraries
The following file will be required for the code prediction and visualization of the model and data set.
import pandas as pd  # importing pandas for creating data frame
from sklearn.linear_model import LogisticRegression # logistic regression class provided by the sklearn
import matplotlib.pyplot as plt # matplotlib for drawing the graph as per the requiremnet
from sklearn.model_selection import train_test_split # to split the data into two parts for train and testing
import numpy as np # importing numpy for linspace function
Creating Dataframe from the csv file
df = pd.read_csv('insurance_data.csv') # reading the csv file and creating data frame from this file
df.head(5) # printing the first five values from the data frame

Prediction and Visualization
Now, we will split the data for training and test and then fit the training data for model training and predict the values from the test data.
inputs = df[['age']]  # creating a 2d array to pass as the input
target = df['bought_insurance'] # a target variable for output column

X_train,X_test,y_train,y_test = train_test_split(inputs,target,test_size=0.2)  # spliting the data for test and train
model.fit(X_train,y_train) # fitting the training data for model training

model.score(X_test,y_test) # calculating the score for the trained model
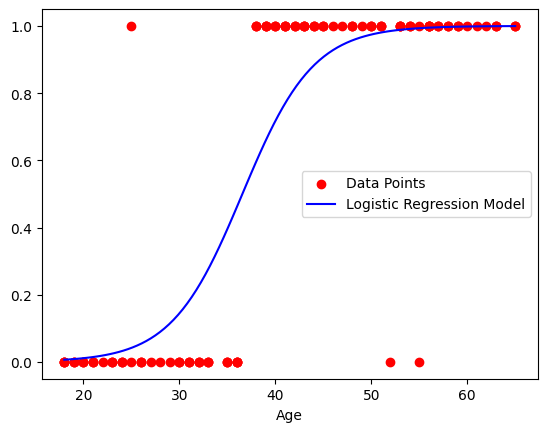
Now, the scatter plot for the data points from the csv and the plot for the model trained with these values.
x_values = np.linspace(df.age.min(), df.age.max(), 100) # creating a sequence of ages for ploting the graph
y_values = model.predict_proba(x_values.reshape(-1, 1))[:, 1]  # predicting the values for the creating x values for ploting

plt.scatter(df.age, df['bought_insurance'], color='red', label='Data Points') # ploting the dots from the data frame
plt.xlabel('Age') # labeling the x-axis as Age
plt.plot(x_values, y_values, color='blue', label='Logistic Regression Model') # ploting the graph of the model created
plt.legend() # to show the name for the type of pattern on the graph

The curvature for model in graph given by function name sigmoid. The basic idea about this curve is try to create a linear equation,like in linear regression, and then pass it to the sigmoid function and it will give the values for the logistic regression model in the given plot. The function sigmoid is f(x) = 1/(1+(e^-z)).
The range of this function is (0,1). So for every input the model will try to create a line of the type y = mx + c and then pass it to the sigmoid function at the place z. The output of the function will be then used for the model training or optimizing the weights.
Conclusion
This post provides an overview of logistic regression. For more insights on machine learning and data science, follow me on Medium. You can also connect with me on LinkedIn, Twitter, and Instagram.
Subscribe to my newsletter
Read articles from Shrey Shah directly inside your inbox. Subscribe to the newsletter, and don't miss out.
Written by
