7/05 - IMC TVET Nations
 Nana Azhar
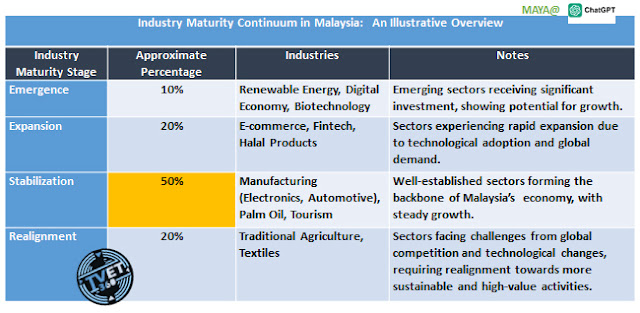
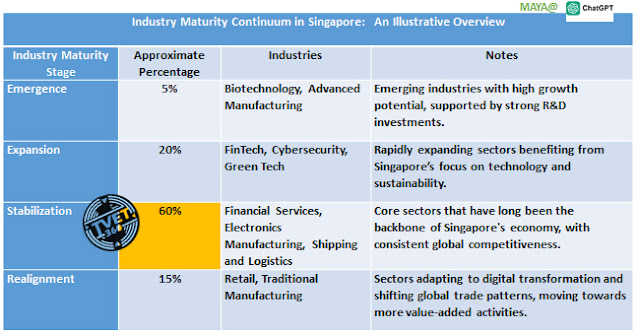
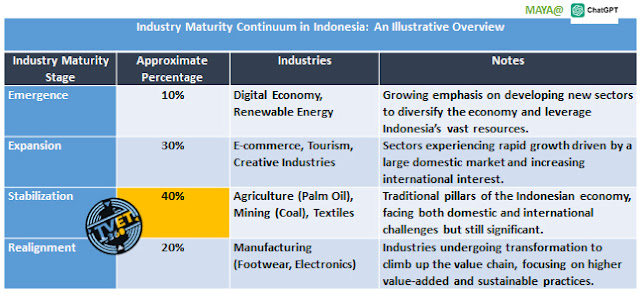
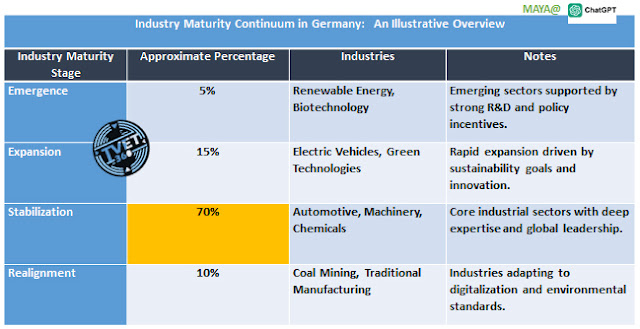
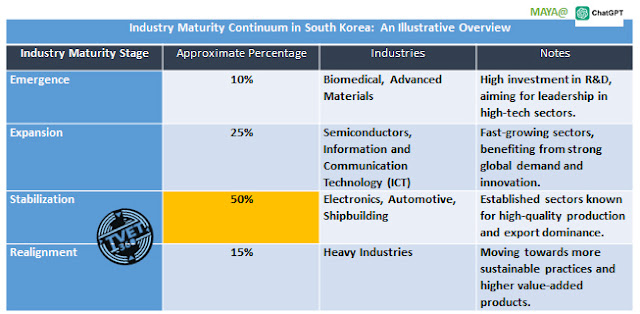
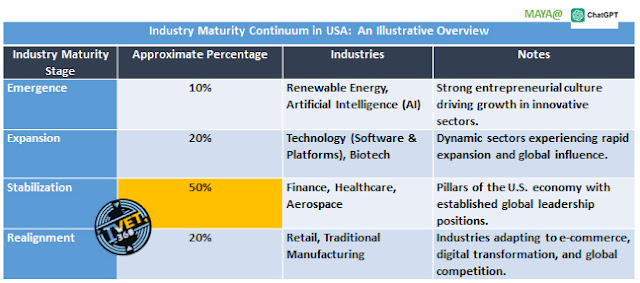
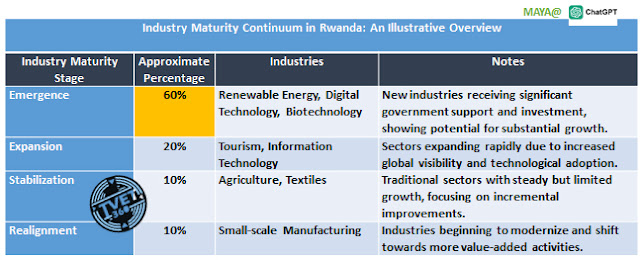
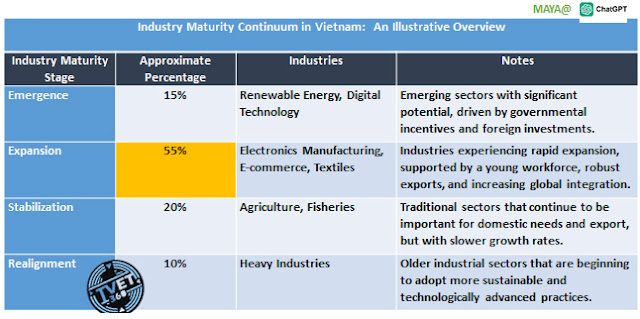
The tables presented provide a hypothetical but valid and detailed overview of the Industry Maturity Continuum (IMC) across various countries, illustrating the stages of industrial development from introduction to transition.
These tables are essential for understanding how different sectors within each country are evolving, their current economic focus, and the strategic initiatives driving their industrial progress. By analyzing these stages, stakeholders—from policymakers to business leaders—can make informed decisions that align with their nation’s industrial capabilities and future growth trajectories.
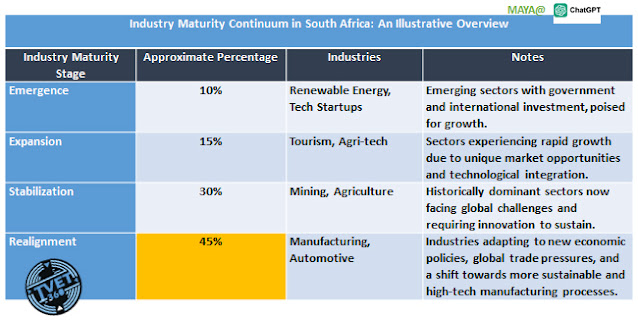
Why Countries Are at Specific Stages
Economic policies and history: Countries like Germany and Switzerland have historically focused on precision engineering and high-value production, supported by policies that encourage technological innovation and high-quality standards.
Market dynamics: Nations such as Singapore and South Korea have capitalized on global technological demands and their strategic geographic positions to advance rapidly in high-tech industries.
Educational and R&D investments: The strong educational frameworks and R&D capabilities in Finland and the U.S. have fostered environments conducive to technological and economic growth.
Resource availability and management: Australia and Canada's transitions reflect a strategic realignment from being heavily dependent on natural resources to embracing technology and service-driven economies, aiming for sustainable growth and less economic volatility.
Conclusion
Understanding the industry maturity continuum and the stages at which different countries operate provides insights into their economic strategies, competitive advantages, and potential future trajectories. This analysis helps stakeholders, from policymakers to investors, to make informed decisions aligned with these industrial and economic dynamics.
How They Fare
In the context of the Industry Maturity Continuum, a high percentage in any particular stage reflects a significant emphasis or dependency of a country's economy on that stage. Each stage has its implications for economic health and strategy, and the "ideal" percentage can vary depending on the country's economic goals, resource availability, and development strategy. Here’s a general guideline on what could be considered a positive sign for each stage:
Emergence: A smaller percentage, typically around 10-15%, is often seen as positive, indicating that the economy is continually innovating and adding new sectors. Too high a percentage might indicate excessive reliance on unproven industries.
Expansion: Around 20-30% can be considered healthy, signifying a robust pipeline of developing industries that are expanding and likely to contribute significantly to the economy in the future. It shows that the economy is dynamic and adapting.
Stabilization/Maturity: A high percentage, typically above 50%, in this stage is generally considered excellent because it indicates that the country has a strong, stable base of established industries. These industries provide consistent employment and contribute reliably to GDP. However, over-dependence on mature industries without enough growth in new sectors can risk economic stagnation.
Realignment: Around 20-30% can be seen as positive here, indicating that the economy is actively evolving and adapting. This stage reflects efforts to modernize and improve competitiveness, which is crucial for long-term sustainability.
Thank you for your time ❤️
Subscribe to my newsletter
Read articles from Nana Azhar directly inside your inbox. Subscribe to the newsletter, and don't miss out.
Written by
