Dimensionality Reduction - Unsupervised Learning
 Retzam Tarle
print("Dimensionality Reduction")
Dimensionality reduction is a technique/model used in unsupervised learning to reduce the number of features (variables) in a dataset while retaining as much information as possible.
A good example to illustrate dimensionality reduction in unsupervised learning is like this: Consider trying to categorize all items in a typical home, you can have a very long category list if you group everything into its own specific category, say having categories like sofas, tables, stools, chairs, TVs, pots, spoons, etc you can see that the categories would easily go astronomical right?

In dimensionality reduction, we want to try to reduce these categories to the most optimal so we can have a reasonable number of categories. Therefore in our room illustration, we can have sofas, tables, stools in the furniture category, pots, plates, and spoons in the kitchen utensils category, etc... You can now see how we would effectively reduce the categories we have.
That is the basic idea behind dimensionality reduction, to reduce the number of features as much as possible while retaining as much information, our illustration's furniture category gives good information about the type of items in that category, right?
Let's check out one of the popular techniques used for dimensionality reduction, PCA.
Principal Component Analysis (PCA)
PCA reduces the dimensionality of the data by transforming it into a new set of variables (principal components) that are linear combinations of the original variables.
Note that PCA differs from linear regression even though it might look similar, so don't confuse the two 🙂.
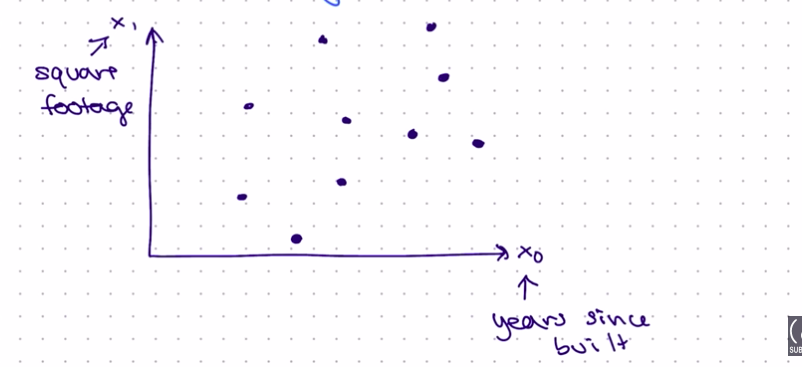
Consider the 2D plane below, showing two features' square footage as x0 and years since built ass x1.
Note it is not feature and outcome/target, it is only features.

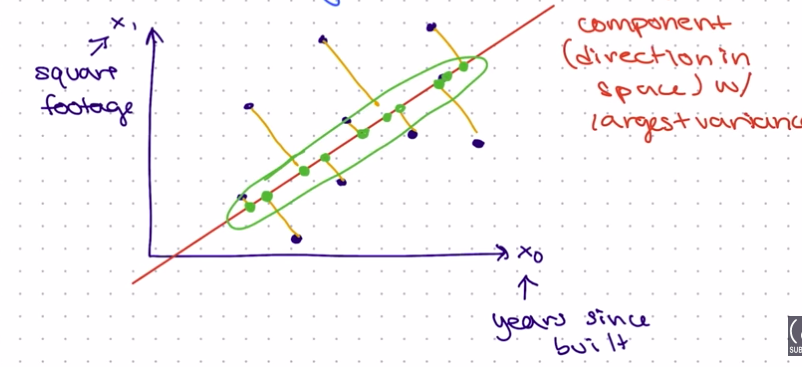
Now using PCA we want to reduce these two features into one feature, we can create a new feature vector as shown in the illustration below marked as green dots.

PCA uses the component (direction in space) with the largest variance to create the optimal line. The red diagonal line is called the PCA dimension, and the green points in the illustration above create the new feature.
Variance measures the spread or dispersion of data points in a dataset. As shown above, the line tries to get as close to each x0 and x1 feature.
The illustration above shows a simple use case of two features. Typically these features can go from x0, x1, x2 to x100 or more... so it will be very effective to get it down to a reasonable amount of features say x0, x1 ... x10 to help make better unsupervised learning tasks.
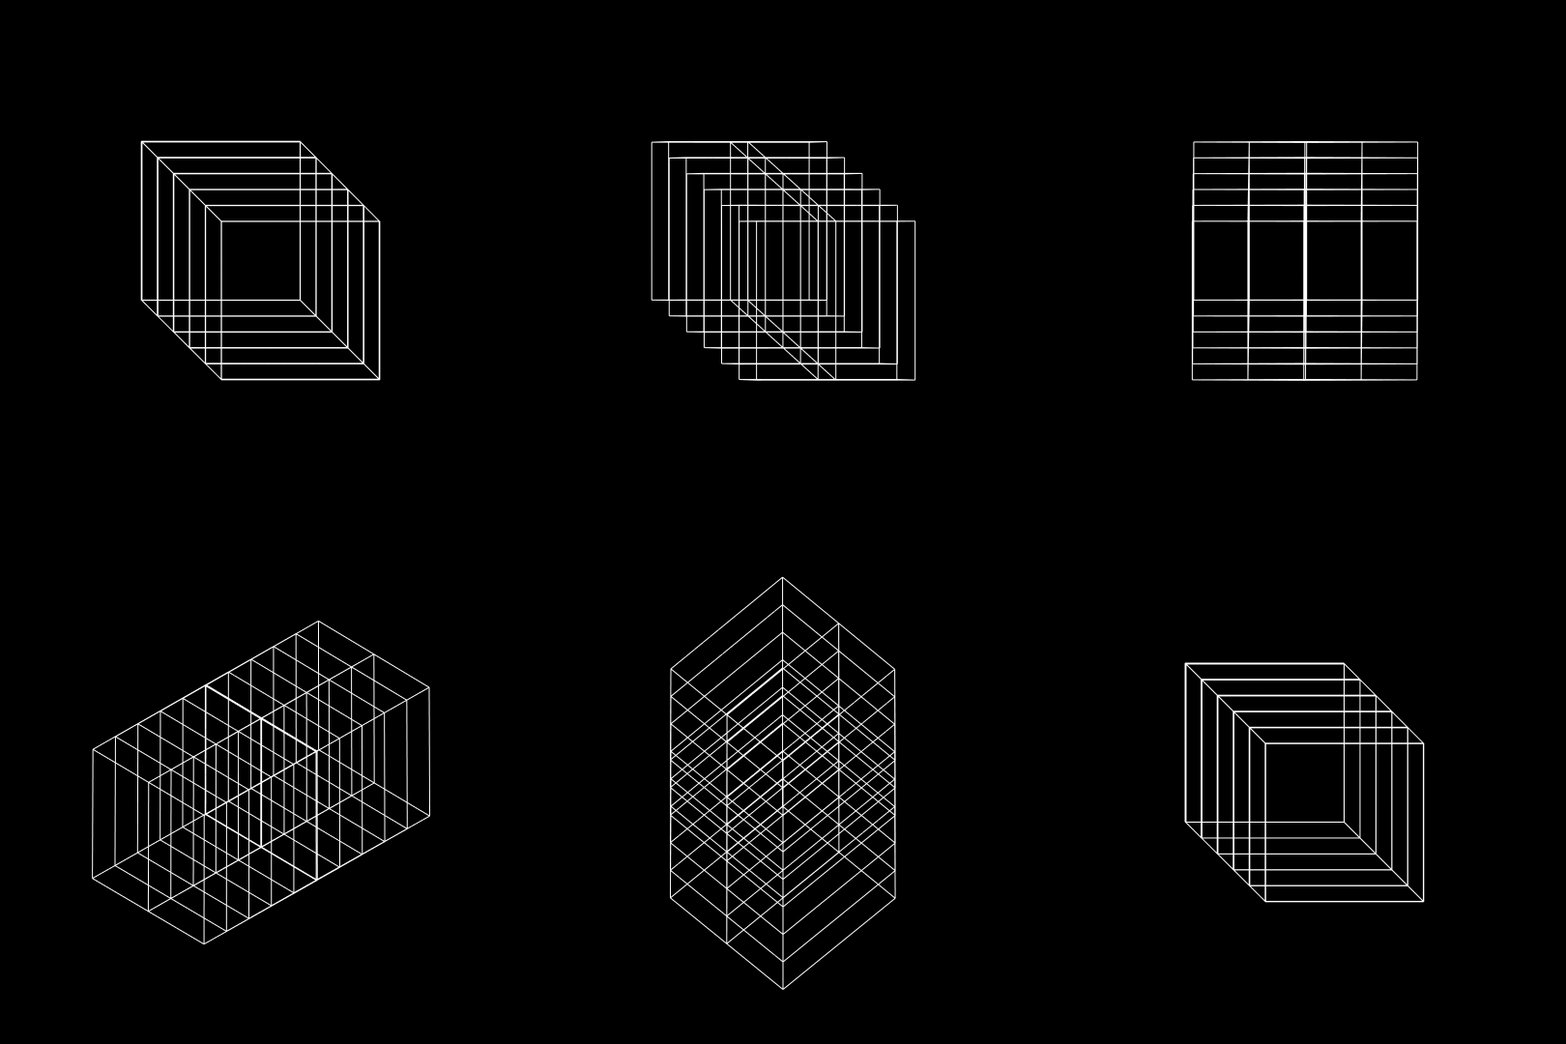
In conclusion, Dimension Reduction using PCA is like being given a 3D object, but you have only a 2D surface to project that object on, how do you go about it? You'll need to approximate and reduce the 3D features(x, y, z) to 2D features (x, y).

Great topic once more right? 🤖 In our next chapter we'll try to practically create and deploy models on the topics we talked about on unsupervised learning, K-Means Clustering, and Dimensionality Reduction. So stay tuned!
See ya! 👽
Subscribe to my newsletter
Read articles from Retzam Tarle directly inside your inbox. Subscribe to the newsletter, and don't miss out.
Written by

Retzam Tarle
Retzam Tarle
I am a software engineer.