Outlier Detection in Election Data Using Geospatial Analysis Case Study: Ensuring Delta State Election Integrity
 Ruth Nwawuzoh
This report shows the recently concluded election in Delta State. The Independent National Electoral Commission (INEC) has faced multiple legal challenges concerning the integrity and accuracy of the election results. Allegations of vote manipulation and irregularities have been widespread, prompting a thorough investigation into the matter.
This report will uncover potential voting irregularities and ensure the transparency of the election results. By identifying outlier polling units where the voting results deviate significantly from neighboring units, indicating potential influences or rigging.
The dataset contains several columns, including:
State, LGA, Ward, PU-Code, PU-Name, and Address for location identification. Latitude and Longitude for Geospatial Analysis. Accredited_Voters and Registered_Voters for voter metrics. Party-specific vote counts: APC, LP, PDP, NNPP. Various flags about the result sheet status. Results_File with URLs to the results.

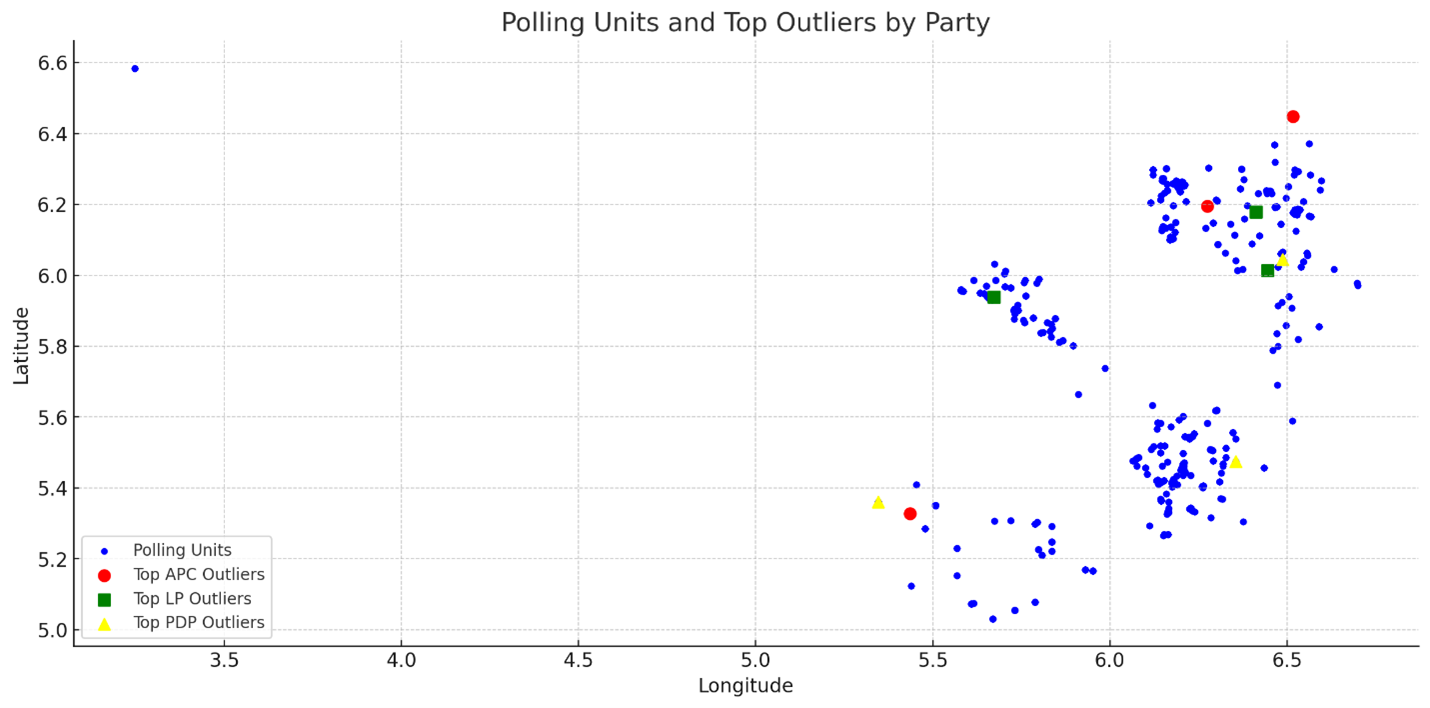
The map above displays polling units in blue, with the top 3 outliers for each party highlighted in different colors:
Red: Top APC outliers
Green: Top LP outliers
Yellow: Top PDP outliers
Methodology
I utilized geospatial techniques (Geocoding) to identify outlier polling units based on the votes each party received. The steps involved:
I loaded and cleaned the dataset to include geographic coordinates and election results.
For each polling unit, I identify neighboring units based on geographic proximity.
I calculated the deviation of votes for each party from the neighboring units and assigned an outlier score.
I created a chart to highlight the top outliers.
Findings: The table below shows the top 3 outliers for each party based on their outlier scores:
| Party | Polling Unit Code | Polling Unit Name | Outlier Score |
| APC | 10-01-09-009 | AZONOBA P/S - UBULUBU I, UBULUBU | 334.86 |
| APC | 10-01-01-001 | KANIDILIMA P/S - ISHIEKPE QUARTERS, ONICHA-UKU | 16.20 |
| APC | 10-01-01-002 | KANIDILIMA P/S - OGBE AKWU, ONICHA-UKU | 16.20 |
| LP | 10-01-01-001 | KANIDILIMA P/S - ISHIEKPE QUARTERS, ONICHA-UKU | 59.00 |
| LP | 10-01-01-002 | KANIDILIMA P/S - OGBE AKWU, ONICHA-UKU | 59.00 |
| LP | 10-01-09-009 | AZONOBA P/S - UBULUBU I, UBULUBU | 66.00 |
| PDP | 10-01-01-001 | KANIDILIMA P/S - ISHIEKPE QUARTERS, ONICHA-UKU | 30.90 |
| PDP | 10-01-01-002 | KANIDILIMA P/S - OGBE AKWU, ONICHA-UKU | 30.90 |
| PDP | 10-01-04-006 | UGBA P/S - OGBE KENU QUARTERS I | 38.67 |
Top 3 Outliers
AZONOBA P/S - UBULUBU I, UBULUBU (10-01-09-009):
APC Outlier Score: 334.86
LP Outlier Score: 66.00
PDP Outlier Score: 29.00
This polling unit shows an unusually high number of votes for the APC compared to its neighbors.
KANIDILIMA P/S - ISHIEKPE QUARTERS, ONICHA-UKU (10-01-01-001):
APC Outlier Score: 16.20
LP Outlier Score: 59.00
PDP Outlier Score: 30.90
This unit has significant deviations for LP and PDP, indicating potential irregularities.
KANIDILIMA P/S - OGBE AKWU, ONICHA-UKU (10-01-01-002):
APC Outlier Score: 16.20
LP Outlier Score: 59.00
PDP Outlier Score: 30.90
Similar to the previous unit, this one also shows significant deviations for LP and PDP.
Conclusion
The geospatial analysis and outlier detection methodology successfully identified polling units with significant deviations in voting patterns. These findings can assist in ensuring the integrity and transparency of the election results.
Subscribe to my newsletter
Read articles from Ruth Nwawuzoh directly inside your inbox. Subscribe to the newsletter, and don't miss out.
Written by
