Visualize data with QuickSight 📊
 Aryaman Punjabi
What it does & how it’s useful ?
Amazon QuickSight lets you create interactive dashboards and visualize data from different sources. It's useful for spotting trends, making informed decisions, and sharing insights with your team quickly and easily.
Amazon QuickSight offers several advantages:
Ease of Use: Intuitive interface for quick data visualization.
Scalability: Handles large datasets effortlessly.
Integration: Works seamlessly with other AWS services.
Collaboration: Share insights and dashboards easily.
Cost-Effective: Pay-per-session pricing model.
Download the dataset
Download netflix_titles.csv (right click, and select Save Link As). This file contains all the data we're analysing!
Download manifest.json (right click, and select Save Link As).
Store Dataset in Amazon S3
Open Amazon S3 console.
Select Create Bucket.
Name the bucket network-quicksight-project.

Keep rest of the setting as default and select create bucket.
Upload the CSV file and manifest.json file into bucket.

Copy the S3 URL of your netfilx_titles.csv file.

Now open the manifest file in text editor in your PC and Replace the URL in the file with the S3 URL of your dataset and Re-Upoad the manifest.json file into bucket and delete the old one.

Create a QUICKSIGHT Account
- Search for Amazon Quicksight

Select Sign up for QUICKSIGHT
Enter your details for your QuickSight account - make sure the email you use is the same email for your AWS account.
Select Amazon S3
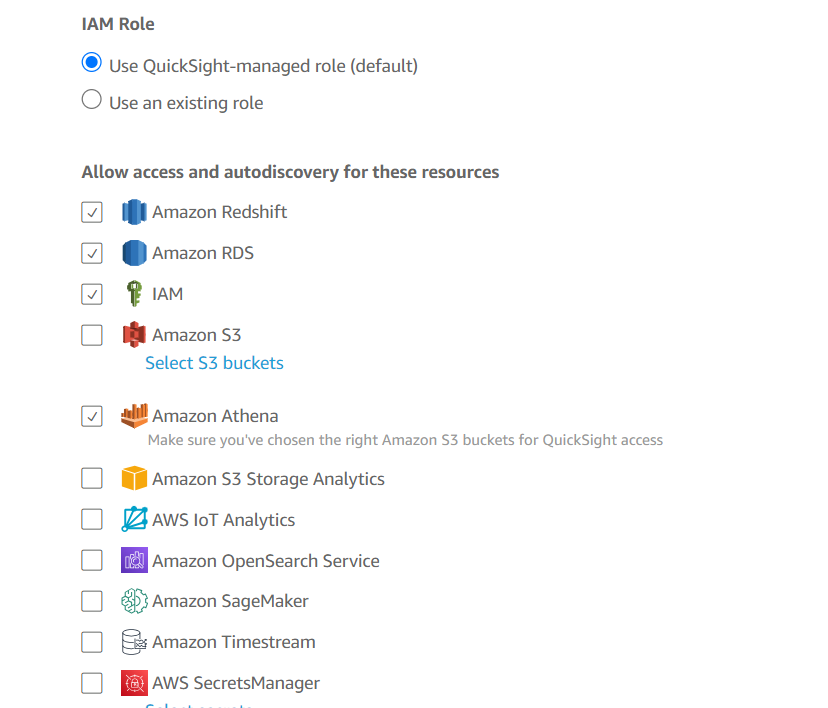
Select S3 Bucket.
Tick box the S3 Bucket you created earlier.

🚨 IMPORTANT STEP 🚨
Make sure you uncheck this Box

Select Finish (It will take some time).
After creating account select Go to Quicksight and you will get like this homepage.

Connect your S3 bucket to Amazon QuickSight
On left hand navigation bar select datasets and Click New datasets.
Then Select S3
Now earlier we had a file named manifest.json ,here we will use this file.
Open a new tab and go to AWS Console and go to S3.
Select the manifest.json and Copy the S3 URL
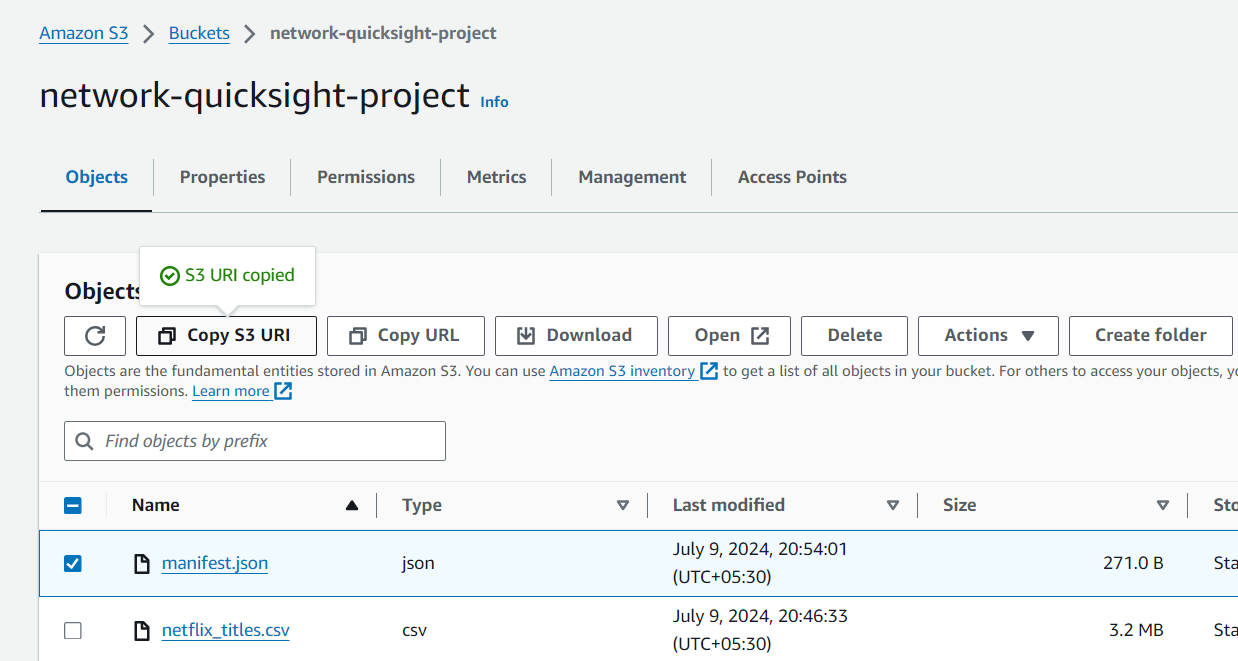
Now again go to AWS QUICKSIGHT.
In that now As you select S3 you will get a pop up "New S3 Data Source".
Note: The source name is a label to remind you where the data came from.
Now in data source name write kaggle-data and in URL paste the S3 URL which we had copied earlier [manifest.json]

What is role of manifest file here ?
"The manifest.json file tells Amazon QuickSight where your data is and how to read it. It acts like a map, helping QuickSight understand and correctly display your data in charts and graphs. Without it, QuickSight might not interpret your data properly."
Select connect.
Select Visualize.
Select Create.
Select Interactive Sheet.
Create Your First QuickSight Visualisation
- On left side you will see that the dataset are imported.

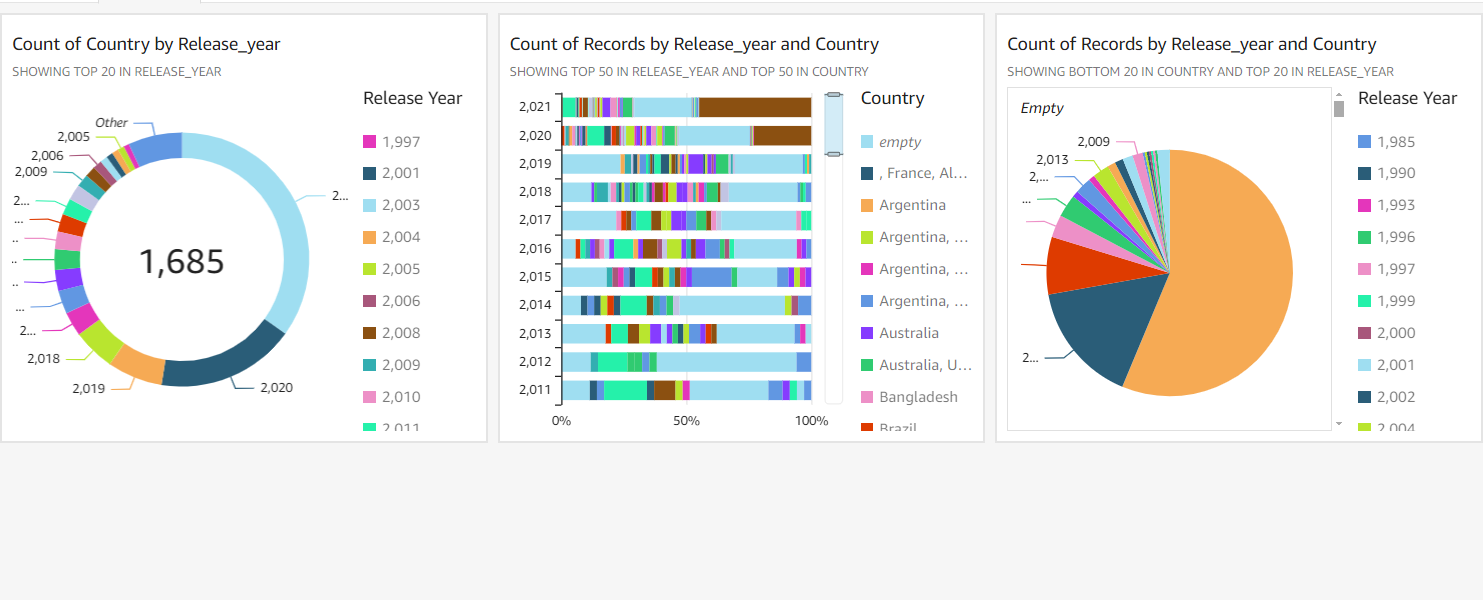
- Drag fields in Visuals and select the visual you want to see example Donut , bar graph , Histogram, Pie etc.

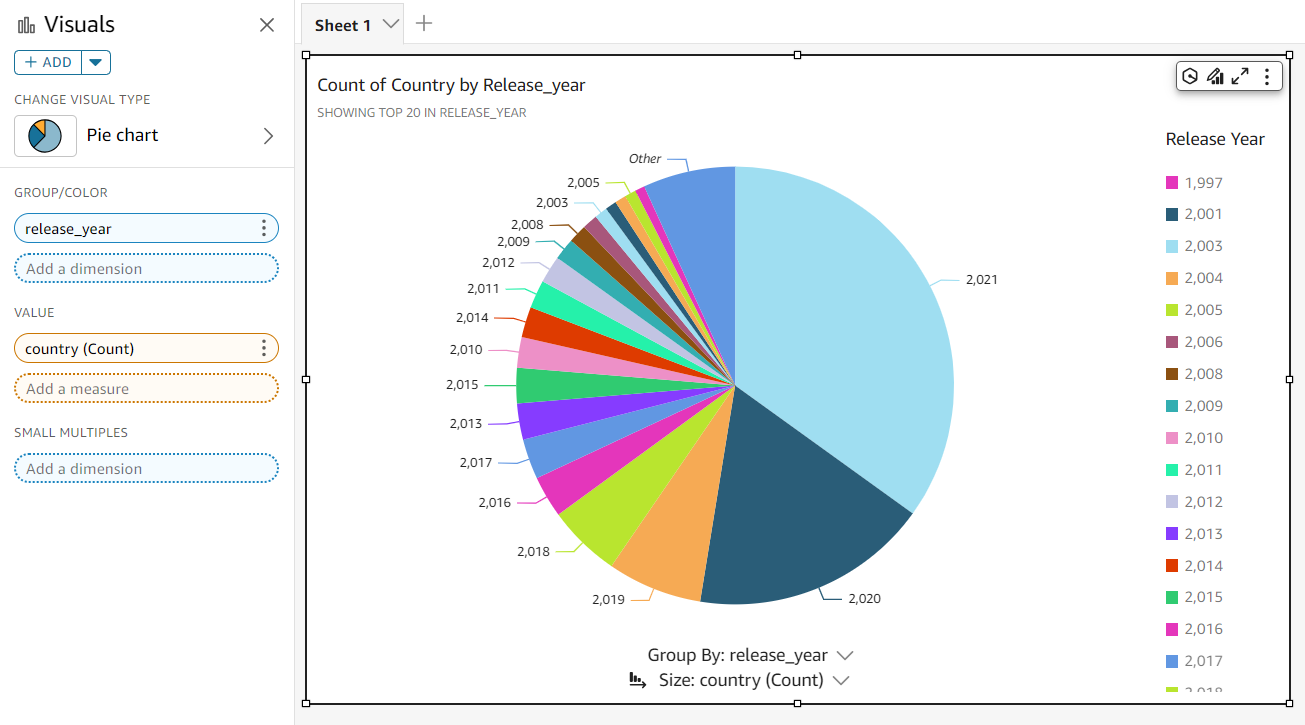
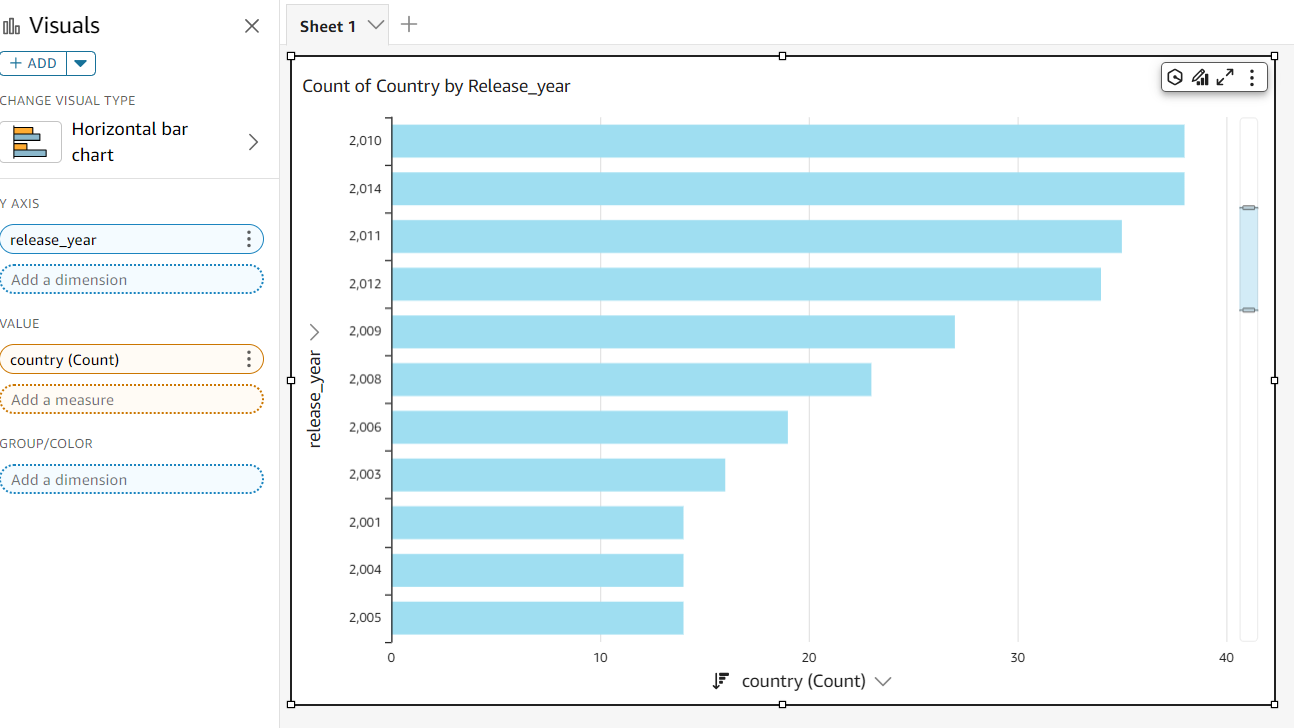
- Now time to Publish for that create Sheet 2 from sheet one make a duplicate to sheet 2 by clicking 3 dots at right corner of your visual and one by one do same to one visuals aslo and at end you will get result like this -->
Click Publish
After Clicking Publish give your dashboard a name which will be public so you can share. [Netflix analysis].
Click publish dashboard
Now click export at right corner of your page.

Click Generate pdf.
It will create a pdf file which will be available on your PC as a copy of your file.
Hurrah! We've completed the project. Using the manifest.json file ensures that Amazon QuickSight can accurately understand and visualize your data, making your insights clear and impactful. Happy analyzing!
Got any queries, ideas, or need help? Drop a comment below!.
Subscribe to my newsletter
Read articles from Aryaman Punjabi directly inside your inbox. Subscribe to the newsletter, and don't miss out.
Written by

Aryaman Punjabi
Aryaman Punjabi
Hello, I'm Aryaman Punjabi, a passionate Cloud Engineer with a focus on DevOps, AWS, Cloud Computing, and a wide range of cutting-edge technologies. #cloud