Flood Prediction for Lagos
 Carlson Oranu
Table of contents

Introduction
In Lagos, Nigeria, flooding has long been a problem that affects public safety, livelihoods, and infrastructure. Since floods are becoming more frequent and severe as a result of climate change and increased urbanisation, it is crucial to accurately anticipate flood events to implement effective disaster preparedness and mitigation techniques.
Purpose of report: In this report, we will make a Random Forest machine learning prediction model that applies historical meteorological data from 2009 till date (2024-07-07), and will outline the next date with the highest probability of flood.
Our dataset: For our analysis, we utilised a weather data set from Visual Crossing Weather API, the dataset contains daily meteorological data for Lagos state, Nigeria from 2009 to 2024. The fields in this sheet, are
(“State”, “temp”, “precip”, “sealevelpressure”, “moonphase”, "precipcover ", "feelslikemax", "feelslikemin", "feelslike", "dew", "humidity", "precipprob", "preciptype", "snow", "snowdepth", "windgust", "windspeed", "winddir", "cloudcover", "visibility", "solarradiation”, "solarenergy", "uvindex", "severerisk", "sunrise", "sunset", "conditions", "description", "icon", "stations", "windspeedmax", "windspeedmin").
Tools used: Excel, Python (pandas, math, numpy, dateutil, sklearn, os, seaborn, matplotlib).
Methodology
To develop the flood prediction model, historical weather data spanning from 2009 to 2024 was collected and preprocessed through the following processes.
1) Data Collection: The data weather data was gotten via Visual Crossing Weather API, and saved in CSV format. The flooding data was sourced from Kaggle, this data contained 1 column which was the data that Lagos experienced flood.
2) Data Cleaning: The date columns in both the weather file and the Lagos flood file were changed to one universal date format of “yyyy-mm-dd”. This change was checked to ensure that the data columns were in the datetime format and missing Values were accounted for, to ensure that columns with integers stayed consistent with the following code below.

3) Data Exploration:
The data was imported into Jupiter notebook and the overall structure was analysed below giving us a (6297 x 36) data set. The first 5 rows were viewed to get a better understanding of the dataset with the code below,
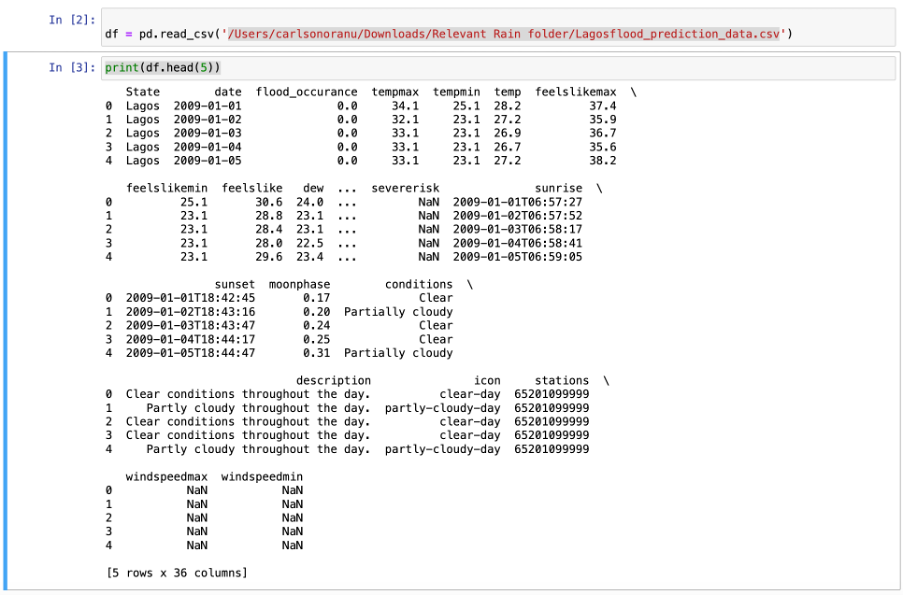
We observed that some of the data contained strings such as “State”, ”conditions”, ”description”, ”icon”, “and “ stations” which were not suitable for our ML model. To check this problem of strings in our dataset, we used a correlation heatmap to determine if these fields were useful for our machine learning prediction, if there were we would encode them in integers, if they showed low correlation to flood occurrence we would drop them.
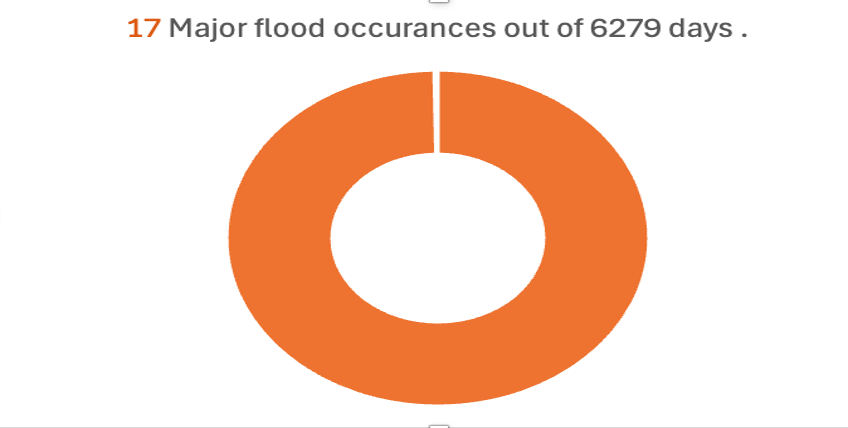
4) EDA Analysis: Normally, the top factors responsible for flow in a region are “Precipitation”, ”Tide level”, and “Land to sea level”; but because our API pulled a dataset that contained other fields, we did a correlation analysis of all 36 columns using heat maps to see the features that will give our model high accuracy.
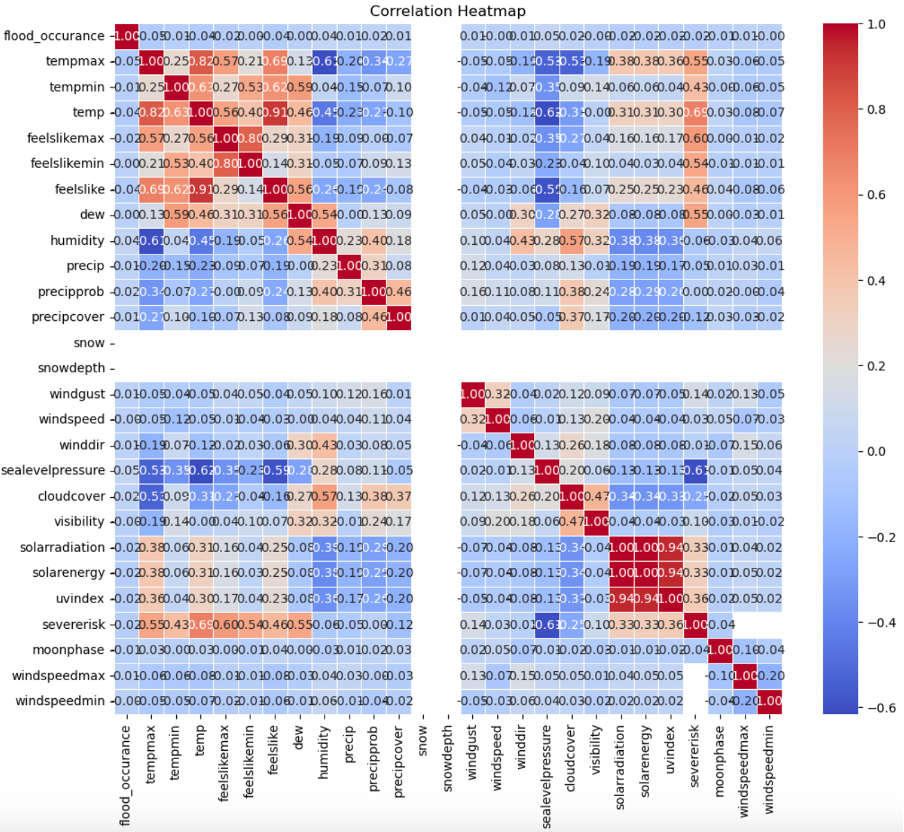
The heatmap above shows us the fields that have the highest correlation with Flood occurrence in Lagos.
5) Correlation Analysis using an 8x8 Heatmap; Our first heatmap gave us an in-depth understanding of the correlating fields. Boxes with high correlation are red and have a positive value with (1) being a perfect correlation, while blue boxes with (-) negative value show low or inverse correlation. This is evident in the heatmap below as heat is maxed heat in the day showing the highest inverse correlation to flooding in Lagos.
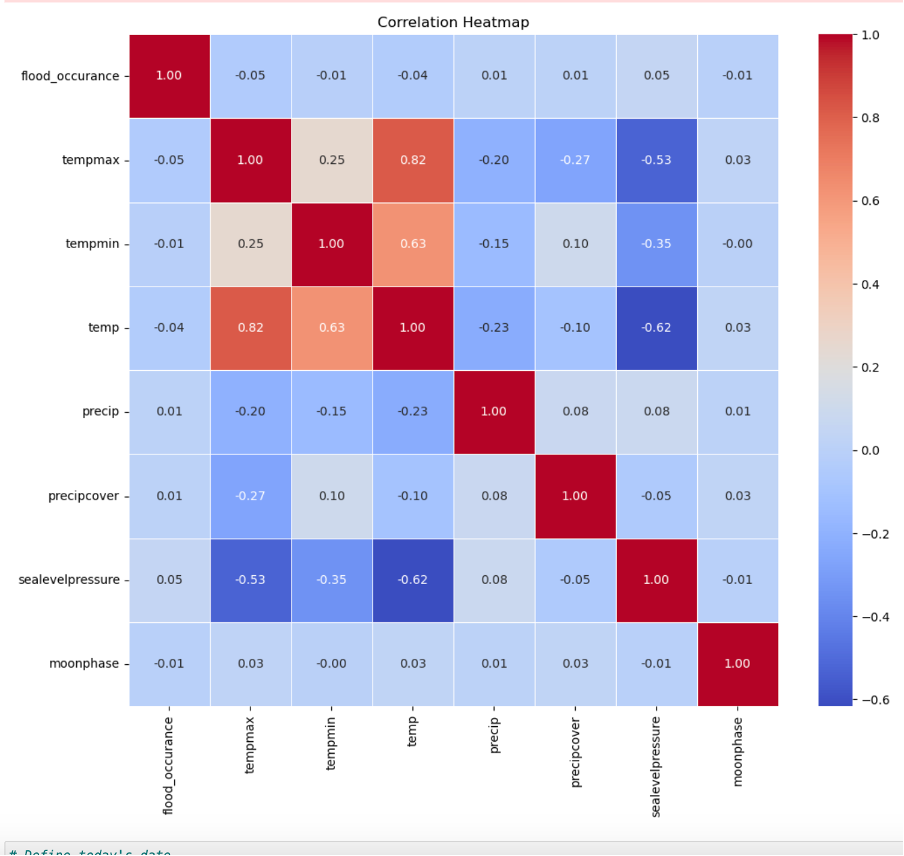
From the further selected fields above, we can see that “sea level pressure” has the highest correlation with flood occurrence in Lagos. As a result, Seal level pressure and precipitation were used as the 2 features to train our model.
6) Model creation (Random Forest): We had the choice to use a regression model or a classification model since we were predicting a future event, to that extent, we selected a Random Forest classification model, this is because our Target Value (flood occurrence) is a binary variable, it was selected for its capability to handle non-linear relationships and interactions between features, making it suitable for binary classification tasks like predicting flood occurrences.. The data set was slipped into 2, the Training and prediction data set as seen below,
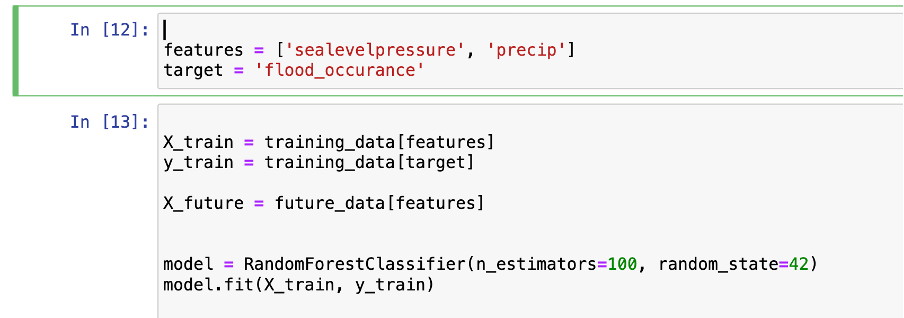
Then they did the random classification model to point out the days that have the highest probability of flood based on the outlined features above in the provided prediction dataset of 2024. These features enabled the model to learn from historical trends and make informed predictions about future flood events in Lagos.

After the feature engineering, the random classification model was trained with historic flood data from 2009 to 2024-07-08.
7) Model Accuracy: Upon training the Random Forest model using data up to July 8, 2024, the model demonstrated robust performance with an accuracy of 0.9975490196078431 on the test set. This performance metric indicates the model's effectiveness in distinguishing between flood and non-flood days as seen below.

Findings
Using probabilistic forecasting, the model predicted future flood probabilities from July 9, 2024, to December 31, 2024. The following were my findings;
1) Dates with the highest probabilities of flooding were identified, providing critical insights into potential risk periods.

· 11th August 2024.
· 17th August 2024.
· 21st August 2024.
2) There was a stronger correlation of 0.5 of flood occurrence to sea level pressure compared to precipitation. This means that according to data, the top factor to measure flood occurrence was the atmospheric pressure at sea level.
3) The correlation heat map above shows a -0.5 negative correlation of max heat with flood occurrence, this means that the days that experienced flood were very cold.
Conclusion
The random classification predictive model presented in this report offers valuable insights into future flood probabilities, enabling Lagos to be proactive and make informed decision-making. sea level pressure was the best indicator for Lagos flood, followed by other factors such as precipitation and temperature. The model predicted the most likely day for the next Lagos state flood to be on 11th August 2024 with a 7% probability. This information can empower local authorities and stakeholders to implement proactive measures and disaster response strategies tailored to forecasted flood risk periods.
Limitations
Limited Access to training data.
Limited Access to historic and forecast tide data.
Limited access to meteorological weather forecast data by local government.
Limited access to high and low-level data and historical meteorological data by local governments in Lagos to determine the particular areas that are most likely to be affected by flood.
References
Subscribe to my newsletter
Read articles from Carlson Oranu directly inside your inbox. Subscribe to the newsletter, and don't miss out.
Written by
