Simple Volatility EMV Strategy
 FMZ Quant
Summary
Unlike other technical indicators, "Ease of Movement Value" reflects changes in price, volume, and popularity. It is a technology that combines prices and volume changes. It measures the price change of unit volume, Forming a price volatility indicator. When the market gathers popularity and the transaction is active, it prompts a buying signal; when the trading volume is low, and the market energy is about to run out, it prompts a selling signal.
Simple volatility EMV is designed according to the principle of equal volume chart and compressed chart. Its core concept is: market price will consume a lot of energy only when the trend turns or is about to turn, and the external performance is that the trading volume becomes larger. When the price is rising, it will not consume too much energy due to the boosting effect. Although this idea is contrary to the view that both quantity and price rise, it does have its own unique features.
EMV calculation formula
Step 1: Calculate mov_mid
Among them, TH represents the highest price of the day, TL represents the lowest price of the day, YH represents the highest price of the previous day, and YL represents the lowest price of the previous day. Then if MID> 0 means today's average price is higher than yesterday's average price.

Step 2: Calculate ratio
Among them, TVOL represents the trading volume of the day, TH represents the highest price of the day, and TL represents the lowest price of the day.

Step 3: Calculate emv

EMV usage
The author of EMV believes that the huge rise is accompanied by the rapid depletion of energy, and the rise often does not last too long; on the contrary, the moderate volume, which can save a certain amount of energy, often makes the rise last longer. Once an upward trend is formed, less trading volume can push prices up, and the value of EMV will increase. Once the downtrend market is formed, it is often accompanied by an infinite or small decline, and the value of EMV will decline. If the price is in a volatile market or the price rises and falls are accompanied by a large volume, the value of EMV will also be close to zero. So you will find that EMV is below the zero axis in most of the market, which is also a major feature of this indicator. From another perspective, EMV values mega-trends and can generate sufficient profit.
The usage of EMV is quite simple, just look at whether EMV crosses the zero axis. When EMV is below 0, it represents a weak market; when EMV is above 0, it represents a strong market. When EMV changes from negative to positive, it should be bought; when EMV changes from positive to negative, it should be sold. Its characteristic is that it can not only avoid the shock market in the market, but also enter the market in time when the trend market starts. However, because EMV reflects the change in volume when prices change, it only has an effect on mid to long-term trends. For short-term or relatively short trading cycles, EMV's effect is very poor.
Strategy realization
Step 1: Write a strategy framework
# Strategy main function
def onTick():
     pass

# Program entry
def main():
     while True: # Enter infinite loop mode
         onTick() # execution strategy main function
         Sleep(1000) # sleep for 1 second
FMZ.COM adopts the rotation training mode. First, you need to define a main function and an onTick function. The main function is the entry function of the strategy, and the program will execute the code line by line from the main function. In the main function, write a while loop and repeatedly execute the onTick function. All the core code of the strategy is written in the onTick function.
Step 2: Get position data
def get_position():
     position = 0 # The number of assigned positions is 0
     position_arr = _C(exchange.GetPosition) # Get array of positions
     if len(position_arr)> 0: # If the position array length is greater than 0
         for i in position_arr: # Traverse the array of positions
             if i['ContractType'] =='IH000': # If the position symbol is equal to the subscription symbol
                 if i['Type']% 2 == 0: # if it is long position
                     position = i['Amount'] # Assign a positive number of positions
                 else:
                     position = -i['Amount'] # Assign the number of positions to be negative
     return position # return position quantity
Because in this strategy, only the number of real-time positions is used, in order to facilitate maintenance, get_position is used here to encapsulate the amount of positions. If the current position is long, it returns a positive number, and if the current position is short, it returns a negative number.
Step 3: Get K-line data
exchange.SetContractType('IH000') # Subscribe to futures variety
bars_arr = exchange.GetRecords() # Get K-line array
if len(bars_arr) <10: # If the number of K lines is less than 10
     return
Before obtaining specific K-line data, you must first subscribe to a specific trading contract, use the SetContractType function from FMZ.COM, and pass in the contract code. If you want to know other information about the contract, you can also use a variable to receive this data. Then use GetRecords function to get K-line data, because the returned is an array, so we use the variable bars_arr to accept it.
Step 4: Calculate emv
bar1 = bars_arr[-2] # Get the previous K-line data
bar2 = bars_arr[-3] # get the previous K-line data
# Calculate the value of mov_mid
mov_mid = (bar1['High'] + bar1['Low']) / 2-(bar2['High'] + bar2['Low']) / 2
if bar1['High'] != bar1['Low']: # If the dividend is not 0
     # Calculate the value of ratio
     ratio = (bar1['Volume'] / 10000) / (bar1['High']-bar1['Low'])
else:
     ratio = 0
# If the value of ratio is greater than 0
if ratio> 0:
     emv = mov_mid / ratio
else:
     emv = 0
Here, we do not use the latest price to calculate the value of EMV, but use the relatively lagging current K line to output the signal and place a K line to issue an order. The purpose of this is to make the backtest closer to real trading. We know that although the quantitative trading software is now very advanced, it is still difficult to completely simulate the real price tick environment, especially when faced with backtesting Bar-level long data, so this compromise method is used.
Step 5: Placing the orders
current_price = bars_arr[-1]['Close'] # latest price
position = get_position() # Get the latest position
if position> 0: # If you are holding long positions
    if emv <0: # If the current price is less than teeth
        exchange.SetDirection("closebuy") # Set the trading direction and type
        exchange.Sell(round(current_price-0.2, 2), 1) # close long position
if position <0: # If you are holding short positions
    if emv> 0: # If the current price is greater than the teeth
        exchange.SetDirection("closesell") # Set the trading direction and type
        exchange.Buy(round(current_price + 0.2, 2), 1) # close short position
if position == 0: # If there is no holding position
    if emv> 0: # If the current price is greater than the upper lip
        exchange.SetDirection("buy") # Set the trading direction and type
        exchange.Buy(round(current_price + 0.2, 2), 1) # open long position
    if emv <0: # if the current price is smaller than the chin
        exchange.SetDirection("sell") # Set the trading direction and type
        exchange.Sell(round(current_price-0.2, 2), 1) # open short position
Before placing the order, we need to determine two data, one is the price of the order and the other is the current position status. The price of placing an order is very simple, just use the current closing price to add or subtract the minimum change price of the variety. Since we have used the get_position function to encapsulate the position, we can call it directly here. Finally, the position is opened and closed according to the positional relationship between the EMV and the zero axis.
Strategy backtest
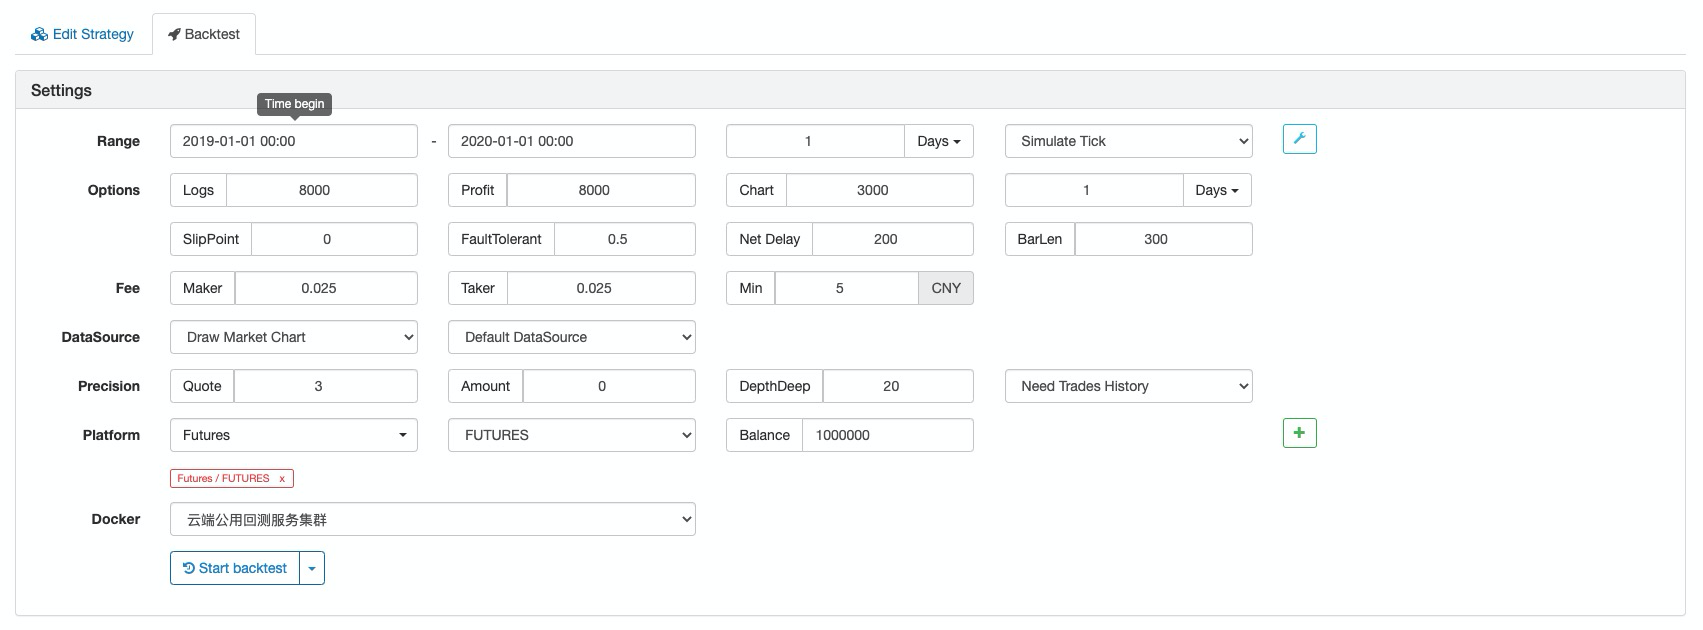
Backtest configuration

Backtest log


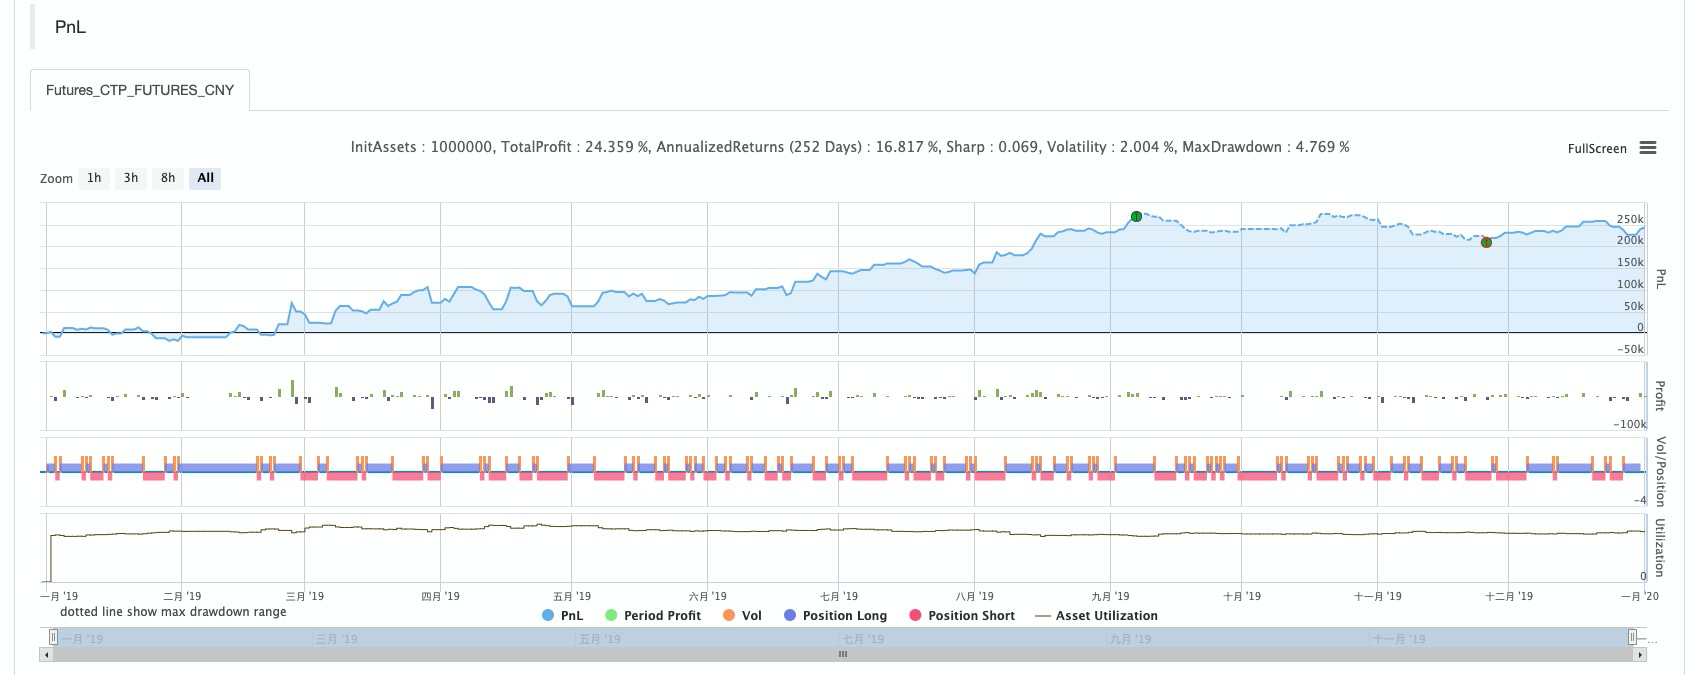
Capital curve

Complete strategy
# Backtest configuration
'''backtest
start: 2019-01-01 00:00:00
end: 2020-01-01 00:00:00
period: 1d
basePeriod: 1d
exchanges: [{"eid":"Futures_CTP","currency":"FUTURES"}]
'''


def get_position():
     position = 0 # The number of assigned positions is 0
     position_arr = _C(exchange.GetPosition) # Get array of positions
     if len(position_arr)> 0: # If the position array length is greater than 0
         for i in position_arr: # Traverse the array of positions
             if i['ContractType'] =='IH000': # If the position symbol is equal to the subscription symbol
                 if i['Type']% 2 == 0: # if it is long position
                     position = i['Amount'] # Assign a positive number of positions
                 else:
                     position = -i['Amount'] # Assign the number of positions to be negative
     return position # return position quantity


# Strategy main function
def onTick():
     # retrieve data
     exchange.SetContractType('IH000') # Subscribe to futures
     bars_arr = exchange.GetRecords() # Get K-line array
     if len(bars_arr) <10: # If the number of K lines is less than 10
         return

     # Calculate emv
     bar1 = bars_arr[-2] # Get the previous K-line data
     bar2 = bars_arr[-3] # get the previous K-line data
     # Calculate the value of mov_mid
     mov_mid = (bar1['High'] + bar1['Low']) / 2-(bar2['High'] + bar2['Low']) / 2
     if bar1['High'] != bar1['Low']: # If the dividend is not 0
          # Calculate the value of ratio
          ratio = (bar1['Volume'] / 10000) / (bar1['High']-bar1['Low'])
     else:
          ratio = 0
     # If the value of ratio is greater than 0
     if ratio> 0:
          emv = mov_mid / ratio
     else:
          emv = 0

     # Placing orders
     current_price = bars_arr[-1]['Close'] # latest price
     position = get_position() # Get the latest position
     if position> 0: # If you are holding long positions
          if emv <0: # If the current price is less than teeth
               exchange.SetDirection("closebuy") # Set the trading direction and type
               exchange.Sell(round(current_price-0.2, 2), 1) # close long position
     if position <0: # If you are holding short positions
          if emv> 0: # If the current price is greater than the teeth
               exchange.SetDirection("closesell") # Set the trading direction and type
               exchange.Buy(round(current_price + 0.2, 2), 1) # close short position
     if position == 0: # If there is no holding position
          if emv> 0: # If the current price is greater than the upper lip
               exchange.SetDirection("buy") # Set the trading direction and type
               exchange.Buy(round(current_price + 0.2, 2), 1) # open long position
     if emv <0: # if the current price is smaller than the chin
               exchange.SetDirection("sell") # Set the trading direction and type
               exchange.Sell(round(current_price-0.2, 2), 1) # open short position

# Program entry
def main():
     while True: # Enter infinite loop mode
         onTick() # execution strategy main function
         Sleep(1000) # sleep for 1 second
The complete strategy has been published to the strategy square of the FMZ.COM website, and it can be used by clicking Copy.
https://www.fmz.com/strategy/213636
To sum up
Through this course of study, we can see that EMV is contrary to ordinary traders, but it is not unreasonable. Because EMV introduces volume data, it is more effective than other technical indicators that use price calculations to find out what's behind the price. Each strategy has different characteristics. Only by fully understanding the advantages and disadvantages of different strategies and removing the dross and extracting its essence can we go further from success.
Subscribe to my newsletter
Read articles from FMZ Quant directly inside your inbox. Subscribe to the newsletter, and don't miss out.
Written by

FMZ Quant
FMZ Quant
Quantitative Trading For Everyone